Distribution of Organic Matter and Al o +1/2Fe o Contents in Soils Using Principal Component and Multiple Regression Analysis in Jeju Island
Kyung-Hwan Moon*, Han-Cheol Lim, and Hae-Nam Hyun
1Agriculture Research Center for Climate Change, RDA,
1Jeju National University
The contents of soil organic matter (SOM) and Al
o+1/2Fe
oin soils are important criteria for the classification of new Andisols in Soil Taxonomy system. There are many soil types in Jeju Island with various soil forming environments.
This paper was conducted to estimate the contents of soil organic matter and the content of ammonium oxalate extracted Al and Fe (Al
o+1/2Fe
o) using various environmental variables and to make soil property maps using a statistical analyses. The soil samples were collected from 321 locations and analyzed to measure the contents of SOM and Al
o+1/2Fe
o. It was analyzed the relationships among them and various environmental variables such as temperature, precipitation, net primary product, radiation, evapotranspiration, altitude, soil forming energy, topographic wetness index, elevation, difference surrounded area, and distances from the shore and the peak. We can exclude multi-collinearity among environmental variables with principal component analysis and reduce all the variables to 3 principal components. The contents of SOM and Al
o+1/2Fe
owere estimated by multiple regression models and maps of them were made using the models.
Key words: Soil organic matter, Andic soil property, Volcanic ash soil, Jeju island
Received : August 8. 2010 Accepted : October 19. 2010
*Corresponding author : Phone: +82647412572 E-mail: [email protected]
Introduction
According to new “Soil Taxonomy”system of the United States Department of Agriculture (USDA), Andisols is defined as soils with Andic soil properties resulted from the presence of significant amount of allophane, imogolite, ferrihydrite, or aluminum-humus complexes. The characteristics of Andic soil properties is related to soil organic carbon, the content of ammonium oxalate extracted Al and Fe (Al
o+1/2Fe
o), bulk density, and phosphate retention of soils (USDA, 2010).
There have been known 63 types of soils in Jeju Island including volcanic ash soils (Andisols). This diversity was originated from several times of volcanic eruption for a long time, various depths of tephra deposition, and different climatic conditions (Song, 1997). Conventionally, soils in Jeju Island were divided 4 groups of dark brown non-volcanic soils, very dark brown soils, black soils, and forest brown soils in mountain area (Moon et al., 2007). Nowadays, Jeju soils are reclassified using new classification
system of Soil Taxonomy by National Academy of Agricultural Science (NAAS), Korea. The contents of soil organic matter (SOM) and Al
o+1/2Fe
oare impor- tant criteria for new soil classification system in the condition of Jeju Island.
Jenny (1941) suggested a state factor theory as a model of dynamic soil system in which soil properties relate to five soil forming factors: climate, organism, topography, parent material, and time. Shoji et al.
(1993) also reported the soil forming process of andosolization using the state factor model. Recently, pedometrics, mostly intensified the application of probability and statistics to soil, was applying for predicting soil properties at remote sites for creating and analyzing classifications and exploring multivariate relations (Webster, 1994). Whole quantitative approach is essential to the study and description of soil in pedometrics technology (McBratney et al., 2000).
Therefore, in this study, we conducted to elucidate
the distribution of soil properties, the contents of soil
organic matter and Al
o+1/2Fe
o, with pedometrics
technology in Jeju Island. We selected some quanti-
tative variables such as mean temperature, precipitation,
elevation, and so on, possibly related to static factors,
and analyzed their relationships to soil properties with
principal component and multiple regression analysis.
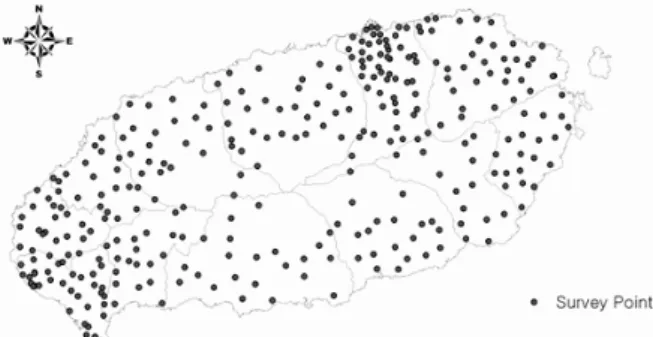
Fig. 1. Sampling locations of soils for analysis.
Statistical models for estimation of soil organic matter and Al
o+1/2Fe
owere made using those variables.
Materials and Methods
Surface and subsurface soils were collected from 321 locations (Fig. 1). Each site was evenly distributed about 5.8 km
2in Jeju Island. Soils were air-dried and passed through 2 mm sieve. The soil samples were analyzed to determine the content of soil organic matter (SOM) by Tyurin method and the content of ammonium oxalate extracted Al and Fe (Al
o+1/2Fe
o) using a Soil Survey Laboratory method reported by Burt (2004).
We also collected information about environmental variables of the sampling locations from environmental variable maps. Quantifiable environmental information was mean temperature (Temp) and annual precipitation (Rain) as climatic factor, net primary product (NPP), radiation (Rs) and reference evapotranspiration (PMET) as vegetative organism factor, and altitude, topographic wetness index (TWI), soil forming energy (EEMT), elevation difference surrounded area of 1 km
2(EleDiff), Euclidean distance from the shore (Codi) and Eucli- dean distance from the peak of Mt. Halla (Distfpeak) as topographic factor.
Annual mean temperature map was made by interpolation of inversed distance weighting method with long-term temperature data of 4 weather stations considering lapse rate of temperature along altitude.
Precipitation map was made by considering the relationships between altitude and annual precipitation with digital elevation model (DEM) with resolution of 30 m × 30 m.
Net primary product map was made using temperature and precipitation like equation (1) (Grace et al., 2006).
Radiation map was made using altitude, maximum and minimum temperatures like equation (2) (Bandyopadhyay et al., 2008). Reference evapotranspiration map was made by Hargreaves method (Hargreaves, 1983) corrected by Penman-Monteith method (Allen et al., 1998; Bandyopadhyay et al., 2008).
NPP = min(NPP
T, NPP
P) (1)
NPP
T= 3000×(1 + exp(1.315-0.0119×T))
-1NPP
P= 3000×(1 +exp(-0.00664×P)) NPP: net primary production(g m
-2yr
-1) T: mean annual temperature(℃) P: mean annual precipitation(mm yr
-1)
R
s=(1+2.7×10
-5×Z)×K
r×(T
max-T
min)
0.5×R
a(2)
R
s: mean daily solar radiation(MJ m
-2d
-1)
T
max, T
min: maximum and minimum temperature(℃) K
r: empirical coefficient(0.16)
R
a: extraterrestrial radiation(MJ m
-2d
-1)
A map of topographic wetness index was made by a method suggested by Moore et al. (1993) with equation (3). Soil forming energy was considered as effective energy and mass transfer (EEMT) suggested by Rasmussen and Tabor (2007) with equation (4). A map of elevation difference surrounded area of 1 km
2(EleDiff) was made by calculating absolute value of difference between mean elevation within 1 km
2and elevation of a center cell. The maps of Euclidean distance from the shore and from the peak of Mt. Halla were made by distance calculation method with spatial data.
TWI = ln(a tan
-1β) (3)
TWI: topographic wetness index
a: local up slope contributing area(m
2m
-1) β: slope(degrees)
EEMT = 347.134×(-0.5×(((T-21.5)/-10.1)
2)
+(((P-4412)/1704)
2)) (4)
EEMT: effective energy and mass transfer (MJ m
-2yr
-1) T: mean annual temperature(℃)
P: mean annual precipitation(mm yr
-1)
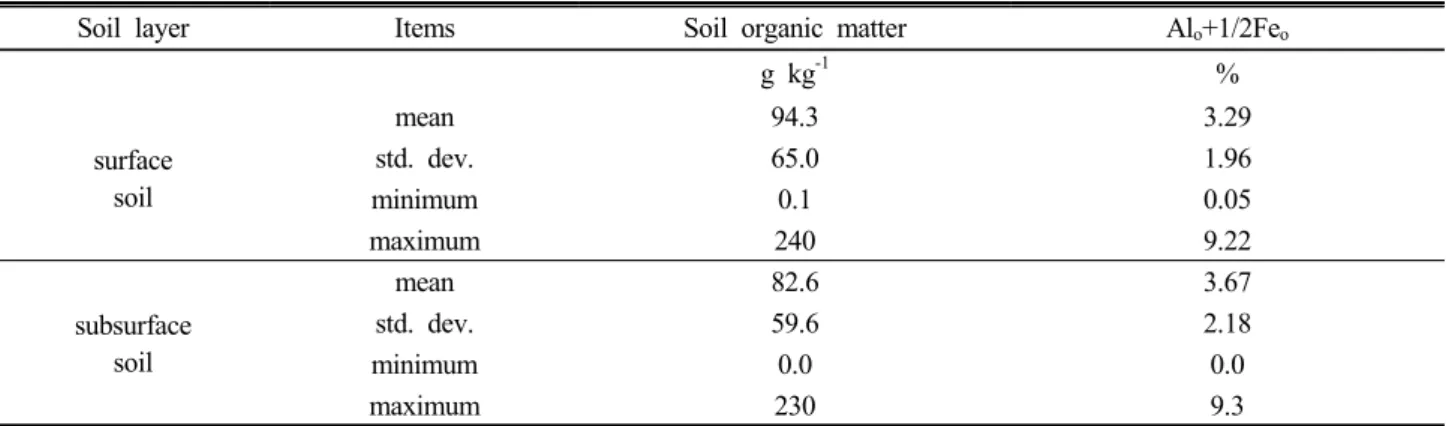
Table 1. Statistics of soil organic matter and contents of Al
o+1/2Fe
oat sampled 321 locations in Jeju Island.
Soil layer Items Soil organic matter Al
o+1/2Fe
og kg
-1%
surface soil
mean 94.3 3.29
std. dev. 65.0 1.96
minimum 0.1 0.05
maximum 240 9.22
subsurface soil
mean 82.6 3.67
std. dev. 59.6 2.18
minimum 0.0 0.0
maximum 230 9.3
Table 2. Correlation matrix between environmental factors collected at sampled 321 locations.
Elevation
*TWI Temp Rain ET NPP Radiation EEMT Codi DistfPeak TWI -0.362
Temp -0.983 0.360
Rain 0.811 -0.362 -0.820
ET 0.052 -0.010 0.064 -0.340
NPP -0.433 0.019 0.394 -0.041 -0.377
Radiation 0.610 -0.313 -0.683 0.836 -0.560 0.252
EEMT 0.685 -0.341 -0.688 0.971 -0.371 0.078 0.805
Codi 0.837 -0.261 -0.840 0.696 -0.029 -0.320 0.521 0.623
DistfPeak -0.728 0.358 0.655 -0.656 -0.373 0.080 -0.443 -0.622 -0.564
Elediff 0.767 -0.457 -0.724 0.622 0.177 -0.241 0.475 0.543 0.517 -0.733
* TWI, topographic wetness index; Temp, temperature; Rain, precipitation; ET, reference evapotranspiration; NPP, net primary product; EEMT, soil forming energy; Codi, distance from the shore; DistfPeak, distance from the peak.
High correlation coefficients among environmental variables show multicollinearity among them at every location (Table 2). Therefore, we conducted principal component analysis (PCA) to eliminate multi-collinearity and reduce environmental variables. The number of variables was determined by Eigenvalue of over one or cumulative explainable value of 0.8. Then we made the linear models to calculate the contents of soil organic matter and Al
o+1/2Fe
ousing reduced number of variables with multiple regression analysis.
Results and Discussion
Table 1 shows the summary of contents of soil organic matter and Al
o+1/2Fe
oof samples soils at all the locations. Means of soil organic matter contents were 94.3 g kg
-1of surface soil, 82.6 g kg
-1of subsurface soil, respectively, and means of Al
o+1/2Fe
ocontents were 3.29% of surface soil, 3.67% of subsurface soil, respectively. As the contents of
Al
o+1/2Fe
o, which were considered one of andic soil properties, were high many locations, we considered that many of sampled soils are Andisols.
Table 2 showed the coefficients of correlation between environmental variables. In the table, altitude which showed significant relationships to other variables, has positive relationships to precipitation, radiation, soil forming energy and negative relationships to temperature, net primary products. Temperature and precipitation also have significant relationships to other variables.
Many of environmental variables are not independent on other environmental variables, in other words, showed multicollinearity. The multicollinearity among variables causes wrong interpretation of the effect of independent variables on dependent variable. So it should be removed from data for correct interpretation using proper data transformation method (Cha, et al., 2008).
Principal component analysis (PCA) can be used to
eliminate multicollinearity (Cha, et al., 2008). With
principal component analysis, all the variables, showed
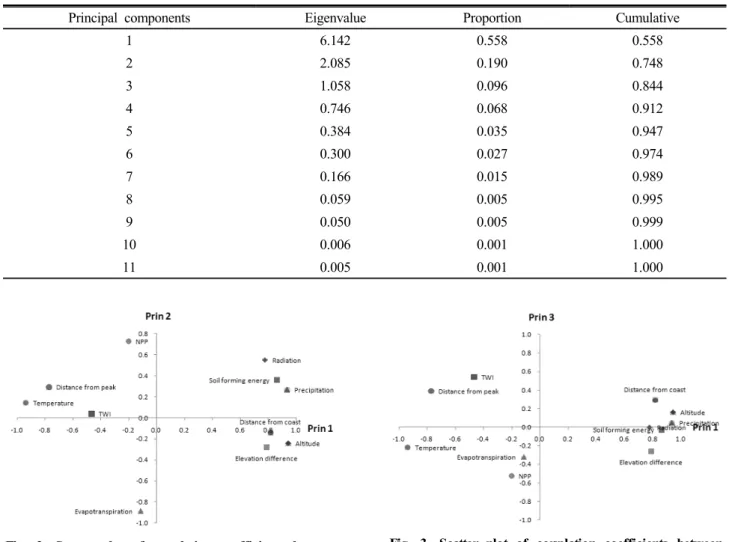
Table 3. Eigenvalues and cumulative variance of the correlation matrix of environmental variables.
Principal components Eigenvalue Proportion Cumulative
1 6.142 0.558 0.558
2 2.085 0.190 0.748
3 1.058 0.096 0.844
4 0.746 0.068 0.912
5 0.384 0.035 0.947
6 0.300 0.027 0.974
7 0.166 0.015 0.989
8 0.059 0.005 0.995
9 0.050 0.005 0.999
10 0.006 0.001 1.000
11 0.005 0.001 1.000
Fig. 2. Scatter plot of correlation coefficients between 11 variables and principal components on principal com- ponent1 and principal component 2 axis.
Fig. 3. Scatter plot of correlation coefficients between 11 variables and principal components on principal com- ponent 1 and principal component 3 axis.
high correlations among them, can be transformed to same number of new variables (components) without loss of explain capacity of independent variables. Usually small number of transformed variables (components) was selected to explain all variation. The selected principal components of all environmental variables were showed in Table 3. The upper three components can explain 84.4% of all variations caused environmental variables.
Scatter plots of component 1 and component 2, and of component 3 and component 4 reveal the relationships among environmental variables (Fig. 2 and Fig. 3). We can name component 1 as “Mountainous effect” which showed the positive relationships to elevation, precipitation, distance from the shore and the negative relationships to temperature, distance from the peak. Component 2 could be named as “Vegetative effect” as it related to net primary product, radiation, evapotranspiration.
Component 3 was difficult to be interpreting, so we named it as “Complex effect”.
The regression model to estimate contents of soil organic matter was made of principal component 1, component 2, and component 3 like equation (5) using multiple regression analysis. This model can be explained 52.4% of all variations of soil organic matter with component 1, 2, and 3. Figure 4 shows the relationship between measured and estimated soil organic matter contents.
SOM(%) = 9.428+1.642×(Prin1)+1.584×(Prin2)+
0.716×(Prin3)+ε (5)
SOM: soil organic matter(%)
Prin1: principal component 1
Prin2: principal component 2
Fig. 4. Measured and estimated soil organic matter contents with 3 principal components in surface layer.
Fig. 5. Measured and estimated Al
o+1/2Fe
ocontents with 2 principal components in surface layer.
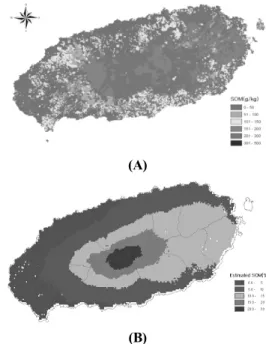
(A)
(B)
Fig. 6. Map (A) of soil organic matter from soil map and estimated map (B) of soil organic matter using a multi-regression model.
Fig. 7. Estimated map of Al
o+1/2Fe
ousing multi- regression model.
Prin3: principal component 3 ε: error
The regression model for Al
o+1/2Fe
ocontents was made using only component 1 and 2 in equation (6).
This model can explain 38% of total variation of Al
o+1/2Fe
ocontents(Fig. 5).
Al
o+1/2Fe
o(%) = 3.289+0.324×(Prin1)+
0.624×(Prin2)+ε (6)
Al
o+1/2Fe
o: content of ammonium oxalate extracted Al and 1/2Fe(%)
Prin1: principal component 1 Prin2: principal component 2
ε: error
The map of soil organic matter from soil map and estimated map of soil organic matter with model were suggested in Fig. 6. the map of soil organic matter from soil map showed organic matter contents of surface soil. As the results, distribution pattern of soil organic matter in estimated map was very similar to that of soil map. The soils of middle and southeastern
regions in Jeju Island have higher contents of soil organic matter in both maps. But there are some different results in detailed parts including mountainous and southwestern area.
Figure 7 showed the map of Al
o+1/2Fe
ocontents using equation (6). As the contents of Al
o+1/2Fe
ois one of criteria for Andic soil properties, we can elucidate that most Andisols distributed on middle, eastern, southern parts of island from the map. This result is consistent with the result of Song et al.
(1997).
Although models for soil organic matter and
Al
o+1/2Fe
ocan explain 52% and 38% of all measured
variation, respectively, estimated maps are very similar
to soil map. So we can suggest the environmental
factors are important for soil distribution pattern in
Jeju Island. And we can suggested the possibility of making soil property maps using environmental variables.
Conclusion
The contents of soil organic matter and Al
o+1/2Fe
oare important criteria for classification of Andisols in new soil classification system. In Jeju Island, there are many types of soils including Andisols. We tried to make the maps of soil organic matter and Al
o+1/2Fe
ousing some environmental factors.
Soils were sampled 321 locations in the island and measured the contents of soil organic matter and Al
o+1/2Fe
o. The quantitative environmental variables, such as elevation, annual mean temperature, annual precipitation, net primary product, radiation, reference evapotranspiration, soil forming energy, topographic wetness index, elevation difference surrounded area of 1 km
2, Euclidean distances from the shore of the island and the peak of Mt. Halla, were collected. There is multicollinearity among various environmental variables.
Using principal component analysis, all the environ- mental variables were reduced 3 principal components.
The first component is interpreted as “Mountainous effect”, the second component as “Vegetative effect”, and the third component as “Complex effect”.
For estimation of soil organic matter content, a regression model was suggested using all 3 principal components. But the contents of Al
o+1/2Fe
owere estimated component 2 and 3. The 52% of variations of soil organic matter and 38% of variation of Al
o+1/2Fe
ocould be explained by the regression models.
The maps of soil organic matter and Al
o+1/2Fe
owere drawn using regression models, and they are consistent with soil map. We can suggest that environmental factors are important on soil distribution in Jeju Island.
It is possible that soil property map can be made using environmental variables and statistical methods.
Acknowledgement
This research was supported by research project funded by Rural Development Administration, Korea.
References
Allen, R., L. Pereira, D. Raes, and M. Smith. 1998. Crop evapotranspiration-Guidelines for computing crop water requirements-FAO Irrigation and drainage paper 56. FAO, Rome 300.
Bandyopadhyay, A., A. Bhadra, N. Raghuwanshi, and R.
Singh. 2008. Estimation of monthly solar radiation from measured air temperature extremes. Agricultural and Forest Meteorology 148:1707-1718.
Burt, R. 2004. Soil survey laboratory methods manual. Soil Survey Investigations Rep 42.
Cha, S.B, H.B. Kim, H.C. Oh, J.H. Yun, and W.K. Kim.
2008. Understanding of multi-variate analysis using examples.
p. 64-66. Baeksan Publishing, Seoul, Korea.
Grace, P., J. Ladd, G. Robertson, and S. Gage. 2006.
SOCRATES-A simple model for predicting long-term changes in soil organic carbon in terrestrial ecosystems.
Soil Biology and Biochemistry 38:1172-1176.
Hargreaves, G.H. 1983. Disscussion of Application of Penman wind function by Guenca, R.H. and Nicholson, M.J. Journal of Irrigation and Drainage Engineering., ASCE 109:277-278.
McBratney, A., I. Odeh, T. Bishop, M. Dunbar, and T.
Shatar. 2000. An overview of pedometric techniques for use in soil survey* 1. Geoderma 97:293-327.
Moon, K.H., H.C. Lim, and H.N. Hyun. 2007. Distribution of soil series in Jeju island by proximity and altitude.
Korean Journal of Soil Science and Fertilizer 40:221-228.
Moore, I., P. Gessler, G. Nielsen, and G. Peterson. 1993. Soil attribute prediction using terrain analysis. Soil Science Society of America Journal 57:443-443.
Rasmussen, C. and N. Tabor. 2007. Applying a quantitative pedogenic energy model across a range of environmental gradients. Soil Science Society of America Journal 71:17-19.
Shoji, S., M. Nanzyo, and R. Dahlgren. 1993. Volcanic ash soils: Genesis, properties, and utilization. Elsevier Science Ltd. Amsterdam, The Netherlands.
Song, K.C. 1997. Distribution and formation of allophane in Jeju soils. Mineral and Industry 10:14-23.
USDA, N. 2010. Keys to Soil Taxonomy. Soil Survey Staff, Washington.
Webster, R. 1994. The development of pedometrics. Geoderma
62:1-15.
주성분분석 및 다중회귀분석에 의한 제주도 토양유기물 및 Al