Community Structure and Diversity across Spatial Scales of Macrobenthos in the Seomjin River
Man Kyu Huh1, Woo Hong Joo2, Choo Joo Choi1 and Jeoung-Yoon Seo3*
1Department of Molecular Biology, Dongeui University, Busan 614-714, Korea
2Department of Biology, Changwon National University, Changwon 641-773, Korea
3Department of Envoronmental Engineering, Changwon National University, Changwon 641-773, Korea Received July 20, 2012 /Revised August 17, 2012 /Accepted August 22, 2012
Biological assessments of the macrobenthos community were carried out in the Seomjin River from May 2009 to November 2010. Fishes from 106 species belonging to 24 families and 10 orders were collected from the survey sites. Locational dominant species differed among sites, and the numbers of species and individuals differed depending on site, although six sites were not significantly differ- ent on the same survey dates. Across sites, the average number of species was 38.3, ranging from five at site 1 to 66 at site 2 in May 2009. Site 2 had the highest number of species on November 2009, while site 3 had the lowest. Arthropods dominated the macrobenthic community at species (63.2%
May) and individual (60.9% November) levels. DO, BOD, and COD were shown to have the greatest effect on the numbers of macrobenthos. Peaks in the diversity index trended downwards from up- stream to downstream sites.
Key words : Macro-benthos, environmental factors, Seomjin River, diversity index
*Corresponding author
*Tel:+82-55-213-3742, Fax:+82-55-281-3011
*E-mail : [email protected]
Introduction
The ecosystem of a river is the river viewed as a system operating in its natural environment, and includes biotic (living) interactions amongst plants, animals and micro-or- ganisms, as well as abiotic (non-living) physical and chem- ical interactions [3,5].
A river ecosystem provides a home for such animals as freshwater fish, frogs, salamanders, turtles and even an occa- sional birds. Various insects live in rivers, such as the water strider and the mayfly larva. A healthy river ecosystem has a food chain that provides food for all, with such plankton as diatoms and heliozoans on the bottom and ducks and otters farther up. Such animals as the mink occasionally come to fish, and deer come to drink.
The Seomjin River is located in the northern part of the Korea to the Pacific Sea and the length of river is 223.86 km. With an increase in human activities such as in- dustrialization and urbanization, this river is one of the most seriously impacted areas by eutrophication in Korea coastal areas. However, it is not only one of the most industrially developed areas in Korea, but it is also a major fishing
ground, oyster (Corbiculidae) and the seaweeds. In partic- ular, the Corbiculidae (common name "basket clams") are a family of aquatic bivalve mollusks, which its cultivation is of significant economic importance for farmers in Hadong-gun with an average production of around 295-414 million weon per year [2]. In recent years, production is se- verely reduced (1,586 million weon for 2001, 813 million weon for 2004, 662 million weon for 2006, and 454 million weon for 2008).
A critical part of improving river health is accurate assess- ment of the current ecological state of river ecosystems [4].
Of the various functional measures available, we have chos- en to focus on two that are relatively straightforward to esti- mate and which describe fundamental aspects of ecosystem functional health, namely the composition of micro-benthos in the Seomjin River and environmental factors. Data gath- ered in the Seomjin River and overseas indicate that both indicators show considerable differences between up-stream and low-stream sites and thus have potential to act as good indicators of ecosystem health.
Macrobenthos such as Polychaeta, Decapoda and Mollusca are important sea-bed fauna. Some species of this group are considered to be useful biological indicators for aquatic ecosystems. The macro-benthos are mostly non-mi- grant inhabitants, and can be used as indices of ecological
Table 1. The sites for water- and sediment-analyses in the Seomjin river
Water Sediment Site G.P.S.
W-1 S-1 Geomdu-naru 35° 9'26.28"N 127°39'40.68"E
W-2 S-2 Agyang-kyo 35° 8'0.36"N 127°41'42.60"E
W-3 S-3 Seomjin-kyo 35° 4'15.12"N 127°44'22.02"E
W-4 S-4 Hajeogu-naru 35° 3'10.92"N 127°46'5.22"E
W-5 S-5 Sintang-naru 35° 0'20.76"N 127°47'9.00"E
W-6 S-6 Baealdo 34°57'44.00"N 127°45'51.21"E
changes in the water environment [16]. This paper reports on this baseline survey of benthic macrofaunal community within the Seomjin River. Water quality measurements were also compared so as to assess the impacts of existing water quality in this area.
Materials and Methods Sites and collections
Micro-benthos were collected monthly at a station located in the Seomjin River (Fig. 1 and Table 1) from January to November during the period 2009-2010 by the Surber net (30x30 cm2) [1,15]. Saplings were done in the six sites (Table 1). In every study sites, 4 quadrats of 10 m X 10 m size were randomly laid to study micro-benthos species.
For species identification, we referred to the illustrated books. Assessment of species composition, abundance and
Fig. 1. The surveyed sites of water (W) and sediments (S) for fish in the Seomjin River.
richness of aquatic plants and macro-invertebrates are im- portant for assessing the nature conservation value of a reach and can be used as indicators of ecosystem health.
Biotic indices
We are able to analyse data sets that may be in the pos- session of organization for trends in the data or statistical differences between rivers and reaches or before and after treatments/activities.
Shannon-Weaver [13] index of diversity: the formula for calculating the Shannon diversity index is
H’=-Σ pi In pi
Where, H’=Shannon index of diversity.
pi=the proportion of important value of the ith species (pi=ni/N, ni is the important value index of ith species and N is the important value index of all the species).
Dominance Index (DI) was calculated by McNaughton's dominance index [7].
DI=(n1+n2)/N
(N: N is the total number of entities in the dataset, n1 and n2: The first and second dominant individuals of spe- cies)
Evenness index (EI) was calculated using important value index of species.
Species diversity and dominance were evaluated by using the following methods [11].
EI= H' ln(S)
S: the number of species, H': Shannon diversity index.
The species richness of micro-benthos was calculated by using the method ‘Margalef’s index of richness’ (Dmg) [6].
Dmg=(S-1)/In N
Where, S=Total number of species.
N=Total number of individuals.
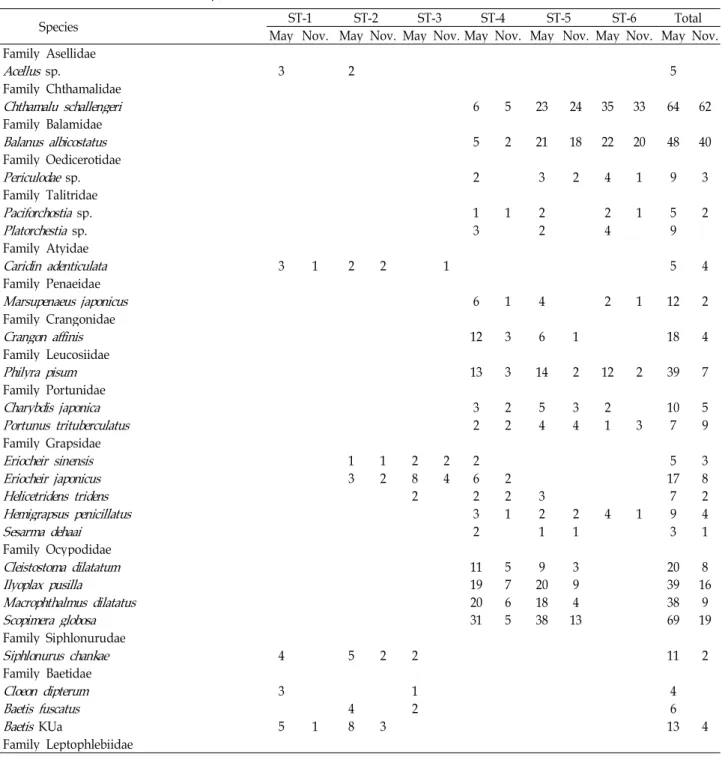
Table 2. The lists of macro-benthos species at the six sites
Species ST-1 ST-2 ST-3 ST-4 ST-5 ST-6 Total
May Nov. May Nov. May Nov. May Nov. May Nov. May Nov. May Nov.
Family Asellidae
Acellus sp. 3 2 5
Family Chthamalidae
Chthamalu schallengeri 6 5 23 24 35 33 64 62
Family Balamidae
Balanus albicostatus 5 2 21 18 22 20 48 40
Family Oedicerotidae
Periculodaesp. 2 3 2 4 1 9 3
Family Talitridae
Paciforchostiasp. 1 1 2 2 1 5 2
Platorchestiasp. 3 2 4 9
Family Atyidae
Caridin adenticulata 3 1 2 2 1 5 4
Family Penaeidae
Marsupenaeus japonicus 6 1 4 2 1 12 2
Family Crangonidae
Crangon affinis 12 3 6 1 18 4
Family Leucosiidae
Philyra pisum 13 3 14 2 12 2 39 7
Family Portunidae
Charybdis japonica 3 2 5 3 2 10 5
Portunus trituberculatus 2 2 4 4 1 3 7 9
Family Grapsidae
Eriocheir sinensis 1 1 2 2 2 5 3
Eriocheir japonicus 3 2 8 4 6 2 17 8
Helicetridens tridens 2 2 2 3 7 2
Hemigrapsus penicillatus 3 1 2 2 4 1 9 4
Sesarma dehaai 2 1 1 3 1
Family Ocypodidae
Cleistostoma dilatatum 11 5 9 3 20 8
Ilyoplax pusilla 19 7 20 9 39 16
Macrophthalmus dilatatus 20 6 18 4 38 9
Scopimera globosa 31 5 38 13 69 19
Family Siphlonurudae
Siphlonurus chankae 4 5 2 2 11 2
Family Baetidae
Cloeon dipterum 3 1 4
Baetis fuscatus 4 2 6
Baetis KUa 5 1 8 3 13 4
Family Leptophlebiidae
Environmental factors for macro-benthos
We have laboratories and equipment that can measure a range of water quality parameters including suspended solids, pH, dissolved oxygen, dissolved carbon, phosphate, nitrate and a number of other anions and cations. We are able to analyse data that may be in the possession of organ- ization for trends in the data or statistical differences be- tween rivers and reaches or before and after treat- ments/activities. We examined the effect of environmental
factors for macro-benthos using SMATR freeware [18] with a standardized critical axes.
Results
The collected fish from the surveyed sites were 106 spe- cies belonging to 65 families, 26 orders, 7 classes, and 4 divi- sions (Table 2). Species were different depending on six sites and two seasons (Figs. 2 and 3). Across sites, the average
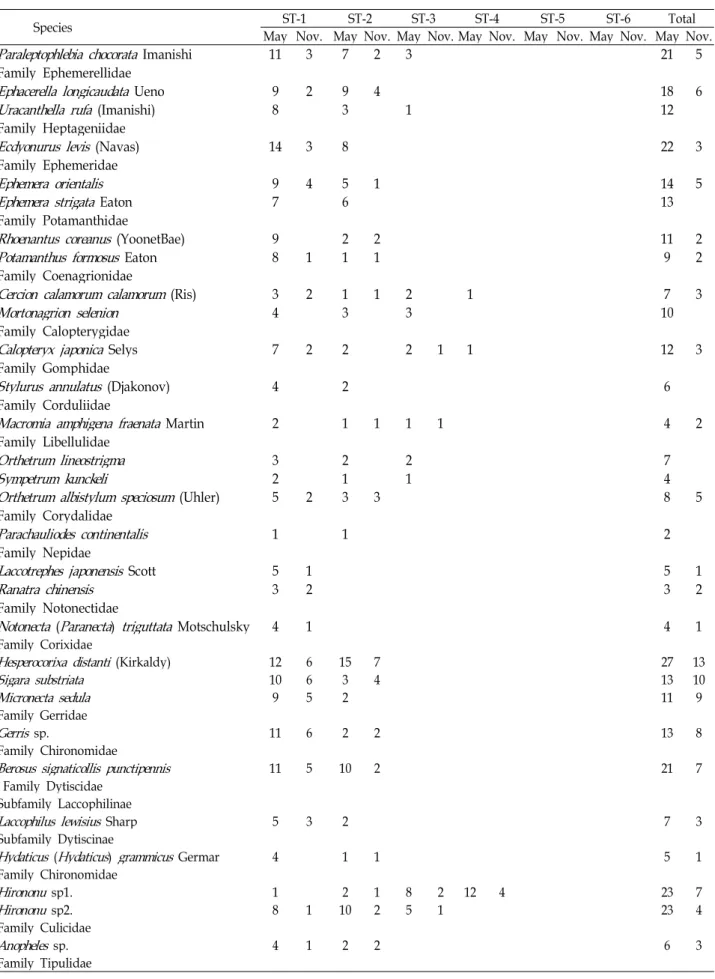
Table 2. Continued
Species ST-1 ST-2 ST-3 ST-4 ST-5 ST-6 Total
May Nov. May Nov. May Nov. May Nov. May Nov. May Nov. May Nov.
Paraleptophlebia chocorata Imanishi 11 3 7 2 3 21 5
Family Ephemerellidae
Ephacerella longicaudata Ueno 9 2 9 4 18 6
Uracanthella rufa (Imanishi) 8 3 1 12
Family Heptageniidae
Ecdyonurus levis (Navas) 14 3 8 22 3
Family Ephemeridae
Ephemera orientalis 9 4 5 1 14 5
Ephemera strigata Eaton 7 6 13
Family Potamanthidae
Rhoenantus coreanus (YoonetBae) 9 2 2 11 2
Potamanthus formosus Eaton 8 1 1 1 9 2
Family Coenagrionidae
Cercion calamorum calamorum (Ris) 3 2 1 1 2 1 7 3
Mortonagrion selenion 4 3 3 10
Family Calopterygidae
Calopteryx japonica Selys 7 2 2 2 1 1 12 3
Family Gomphidae
Stylurus annulatus (Djakonov) 4 2 6
Family Corduliidae
Macromia amphigena fraenata Martin 2 1 1 1 1 4 2
Family Libellulidae
Orthetrum lineostrigma 3 2 2 7
Sympetrum kunckeli 2 1 1 4
Orthetrum albistylum speciosum (Uhler) 5 2 3 3 8 5
Family Corydalidae
Parachauliodes continentalis 1 1 2
Family Nepidae
Laccotrephes japonensis Scott 5 1 5 1
Ranatra chinensis 3 2 3 2
Family Notonectidae
Notonecta (Paranecta) triguttata Motschulsky 4 1 4 1
Family Corixidae
Hesperocorixa distanti (Kirkaldy) 12 6 15 7 27 13
Sigara substriata 10 6 3 4 13 10
Micronecta sedula 9 5 2 11 9
Family Gerridae
Gerris sp. 11 6 2 2 13 8
Family Chironomidae
Berosus signaticollis punctipennis 11 5 10 2 21 7
Family Dytiscidae
Subfamily Laccophilinae
Laccophilus lewisius Sharp 5 3 2 7 3
Subfamily Dytiscinae
Hydaticus(Hydaticus) grammicusGermar 4 1 1 5 1
Family Chironomidae
Hirononusp1. 1 2 1 8 2 12 4 23 7
Hirononusp2. 8 1 10 2 5 1 23 4
Family Culicidae
Anophelessp. 4 1 2 2 6 3
Family Tipulidae
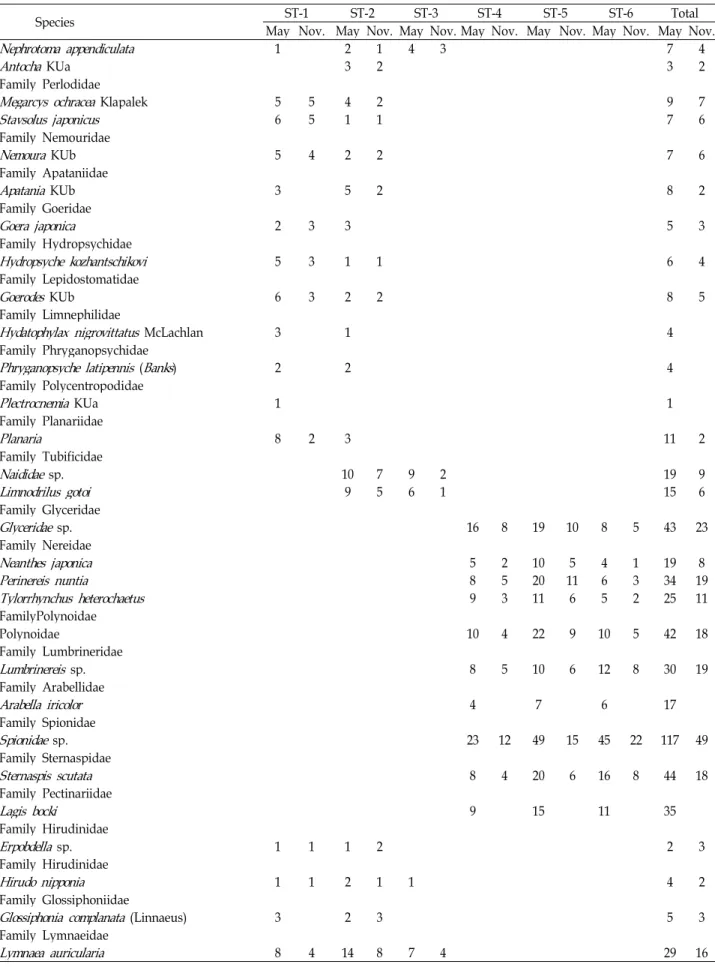
Table 2. Continued
Species ST-1 ST-2 ST-3 ST-4 ST-5 ST-6 Total
May Nov. May Nov. May Nov. May Nov. May Nov. May Nov. May Nov.
Nephrotoma appendiculata 1 2 1 4 3 7 4
AntochaKUa 3 2 3 2
Family Perlodidae
Megarcys ochraceaKlapalek 5 5 4 2 9 7
Stavsolus japonicus 6 5 1 1 7 6
Family Nemouridae
Nemoura KUb 5 4 2 2 7 6
Family Apataniidae
ApataniaKUb 3 5 2 8 2
Family Goeridae
Goera japonica 2 3 3 5 3
Family Hydropsychidae
Hydropsyche kozhantschikovi 5 3 1 1 6 4
Family Lepidostomatidae
GoerodesKUb 6 3 2 2 8 5
Family Limnephilidae
Hydatophylax nigrovittatusMcLachlan 3 1 4
Family Phryganopsychidae
Phryganopsyche latipennis (Banks) 2 2 4
Family Polycentropodidae
PlectrocnemiaKUa 1 1
Family Planariidae
Planaria 8 2 3 11 2
Family Tubificidae
Naididaesp. 10 7 9 2 19 9
Limnodrilus gotoi 9 5 6 1 15 6
Family Glyceridae
Glyceridaesp. 16 8 19 10 8 5 43 23
Family Nereidae
Neanthes japonica 5 2 10 5 4 1 19 8
Perinereis nuntia 8 5 20 11 6 3 34 19
Tylorrhynchus heterochaetus 9 3 11 6 5 2 25 11
FamilyPolynoidae
Polynoidae 10 4 22 9 10 5 42 18
Family Lumbrineridae
Lumbrinereissp. 8 5 10 6 12 8 30 19
Family Arabellidae
Arabella iricolor 4 7 6 17
Family Spionidae
Spionidaesp. 23 12 49 15 45 22 117 49
Family Sternaspidae
Sternaspis scutata 8 4 20 6 16 8 44 18
Family Pectinariidae
Lagis bocki 9 15 11 35
Family Hirudinidae
Erpobdella sp. 1 1 1 2 2 3
Family Hirudinidae
Hirudo nipponia 1 1 2 1 1 4 2
Family Glossiphoniidae
Glossiphonia complanata(Linnaeus) 3 2 3 5 3
Family Lymnaeidae
Lymnaea auricularia 8 4 14 8 7 4 29 16
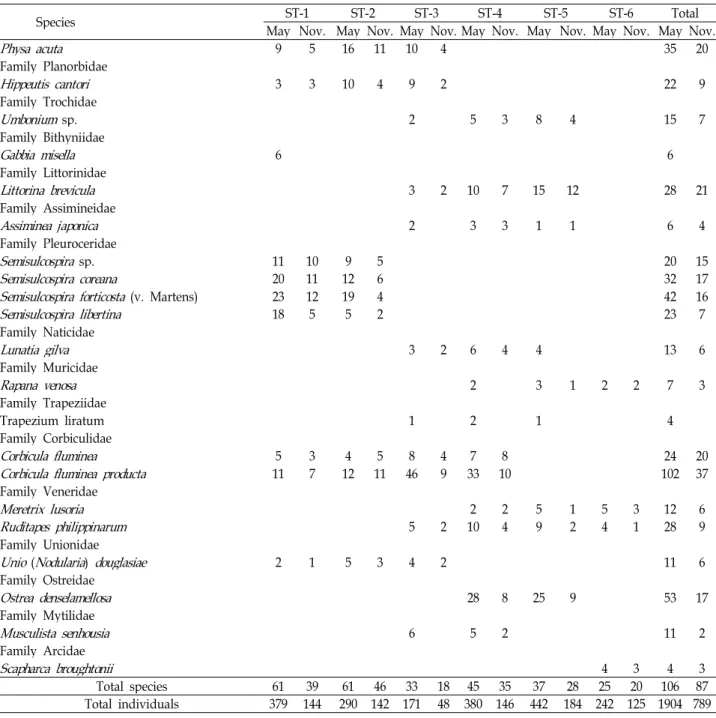
Table 2. Continued
Species ST-1 ST-2 ST-3 ST-4 ST-5 ST-6 Total
May Nov. May Nov. May Nov. May Nov. May Nov. May Nov. May Nov.
Physa acuta 9 5 16 11 10 4 35 20
Family Planorbidae
Hippeutis cantori 3 3 10 4 9 2 22 9
Family Trochidae
Umboniumsp. 2 5 3 8 4 15 7
Family Bithyniidae
Gabbia misella 6 6
Family Littorinidae
Littorina brevicula 3 2 10 7 15 12 28 21
Family Assimineidae
Assiminea japonica 2 3 3 1 1 6 4
Family Pleuroceridae
Semisulcospirasp. 11 10 9 5 20 15
Semisulcospira coreana 20 11 12 6 32 17
Semisulcospira forticosta(v. Martens) 23 12 19 4 42 16
Semisulcospira libertina 18 5 5 2 23 7
Family Naticidae
Lunatia gilva 3 2 6 4 4 13 6
Family Muricidae
Rapana venosa 2 3 1 2 2 7 3
Family Trapeziidae
Trapezium liratum 1 2 1 4
Family Corbiculidae
Corbicula fluminea 5 3 4 5 8 4 7 8 24 20
Corbicula fluminea producta 11 7 12 11 46 9 33 10 102 37
Family Veneridae
Meretrix lusoria 2 2 5 1 5 3 12 6
Ruditapes philippinarum 5 2 10 4 9 2 4 1 28 9
Family Unionidae
Unio(Nodularia) douglasiae 2 1 5 3 4 2 11 6
Family Ostreidae
Ostrea denselamellosa 28 8 25 9 53 17
Family Mytilidae
Musculista senhousia 6 5 2 11 2
Family Arcidae
Scapharca broughtonii 4 3 4 3
Total species 61 39 61 46 33 18 45 35 37 28 25 20 106 87
Total individuals 379 144 290 142 171 48 380 146 442 184 242 125 1904 789 number of species was 38.3, ranging from 5 for site 1 to
66 for site 2 on May, 2009. Whereas, the site 2 had the highest on November 2009; the site 3, the lowest (Fig. 3). The num- bers of individuals per site were also shown significance on six sites and two seasons. Across sites, the average number of species was 636.8, ranging from 212 for site 1 to 1013 for site 2 on May, 2009.
Phylum Arthropods dominated the macro-benthos com- munity both numerically (at individual level) and quantita- tively (at species level), with the dominancy of 63.2% on May
(Fig. 4) at the level of species and 60.9% on november (Fig.
5). There is no seasonal differences in species. Phylum Mollusca was the second dominancy of 22 species (22.75%) on May 2009 and 20 species (22.99%) on November 2009.
As a result of an analysis about environmental factors for the numbers of macro-benthos species and individuals in each surveyed sites, the most effective groups were DO, BOD, and COD (Table 3). In particular, salinity has a sig- nificant influence on the three points (W-4, W-5, and W-6) (Fig. 6).
Table 3. Pearson correlations (r) of species traits between environmental factors across macro-benthos community
Factors No. of species on May No. of individuals on Nov.
r P r P
Salinity 0.77 <0.001 0.78 <0.001
pH 0.69 <0.001 0.72 <0.001
BOD 0.90 <0.001 0.91 <0.001
DO 0.94 <0.001 0.92 <0.001
SS 0.55 <0.050 0.56 <0.050
COD 0.82 <0.001 0.85 <0.050
Fig. 2. Species and individuals of macro-benthos on May 2009.
The bars and line were shown on the sites at levels of species and individuals, respectively.
Fig. 3. Species and individuals of macro-benthos on November 2009. The symbols of bar and line were same as Fig. 2.
Fig. 4. Order ratio of macro-benthos on May.
Fig. 5. Order ratio of macro-benthos on November.
Fig. 6. The distribution of salinity at the study sites.
A total of 106 species were identified, of which 104 species were collected at least two sites of the sampling occasion.
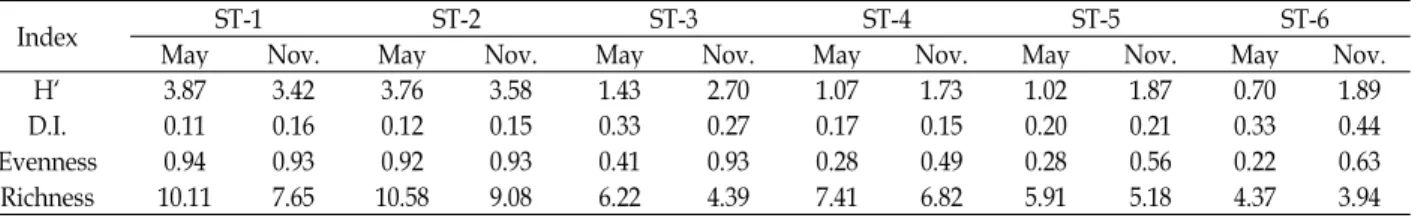
Plectrocnemia KUa and Gabbia misella were excluded in the analysis because they were occurred in one site and one season. The number of individuals from each season ranged from 789 (November) to 1,904 (May). The species number and diversity index were the highest in the ST-1 (May) and the lowest in the ST-6 (May). The peaks in the diversity in- dex in each site tended to shift to lower from upstream to low stream (Table 4). The richness indexes of May were gen- erally high than those of November.
In ordination analysis, there was no immediate visual separation between groups between sampling methods. We used a permutation test to test for differences between groups and detected no differences between sampling
Table 4. Diversity index in the studied areas
Index ST-1 ST-2 ST-3 ST-4 ST-5 ST-6
May Nov. May Nov. May Nov. May Nov. May Nov. May Nov.
H` 3.87 3.42 3.76 3.58 1.43 2.70 1.07 1.73 1.02 1.87 0.70 1.89
D.I. 0.11 0.16 0.12 0.15 0.33 0.27 0.17 0.15 0.20 0.21 0.33 0.44
Evenness 0.94 0.93 0.92 0.93 0.41 0.93 0.28 0.49 0.28 0.56 0.22 0.63
Richness 10.11 7.65 10.58 9.08 6.22 4.39 7.41 6.82 5.91 5.18 4.37 3.94
Fig. 7. Analysis of species distribution on sites and seasons ac- cording to low- and upstream on near-term population dynamics. Groups I, II, III, and IV were illustrated in texts. Horizontal dashed lines indicate bounds where transient projections fall within 10% of asymptotic projections.
methods in ordination space for species frequency. These results support little or no effect of method selection on detecting changes in species composition.
Cluster analysis based on the Jaccard similarity indices between sample identified four major groups among the all species at an 85% dissimilarity level (Fig. 7). Group I mainly appeared to correspond with the seasonal pattern without water condition. Group II were included the species in- creased from May to November at the significant level.
Group III were occurred on May, but not November or the opposite. Group IV were included the species decreased from May to November at the significant level.
Discussion
The river ecosystem is the foundation for the life of many species [10]. Watersheds connect the terrestrial environment with the aquatic environment. The landscape, type of rocks and human activity in an area have an impact on the big river via its watershed. Rivers are heavily affected by the conditions on land surrounding feeder streams [17].
Sometimes big rivers magnify the problems upstream by flooding after heavy rains. At other times, big rivers dilute pollutants directly dumped into the water.
The very low local diversity in low stream (ST-6) in the Seomjin River was results in the influence of a variety of water quality that may be responsible for the observed changes in species composition of macro-benthos both in space and time. In the present study, high species diversity was found during Winter. It is surprising that animals were more active in Spring and Summer than Winter. Macro-ben- thos are activity participating in the biogeochemical cycles by their consumption and they affect the microbial regime spatially and temporally by affecting redox boundaries and chemical fluxes in sediments [13]. ST-6 has been affected many chemical factories near Gwangyang. in addition, ac- cording to Nagai et al. [9,10] the occurrence and abundance of plankton species is highly dependent on temperature, but only partially on salinity. In the present study, some species were distributed across a wide range of salinities but over a narrow range of high temperatures. Conversely, some plankton occurred over a wide range of temperatures but in a limited salinity range. It should be noted that these ap- parent differential influences of temperature and salinity ac- cording to the species distribution may not be due to a direct response of the species to these factors, but could rather re- flect a complex mixing of waters and the ecological specific- ity of the population growth of any particular species in such waters.
Low- and middle stream registered lowest abundance of Order Ephemeroptera, Order Odonata, Order Neuroptera, Order Diptera, Order Diptera, Order Plecoptera, and Order Trichoptera of Class Insecta (Table 2). These are important food sources of fish [14].Plecoglossus altivelis declined or dis- appeared as well as Corbiculidae in the Seomjin River.
Furthermore, decreases in P. altivelis populations were in- tensified by increased fishing in their feeding habitat at sea.
Fishery biologists are attempting to stem theP. altivelis de- clines by enhancing wild stocks, for example, by releasing large numbers of captive-reared, young fish. This so-called
초록:섬진강 하구에 서식하는 저서성 대형무척추동물의 군집구조 및 공간 규모에서 다양성 허만규1․주우홍2․최주수1․서정윤3*
(1동의대학교 분자생물학과, 2창원대학교 생물학과, 3창원대학교 환경공학과)
섬진강에서 2009년과 2010년 사이의 대형무척추동물에 대한 생물학적 군락 분석을 실시하였다. 조사 정점에 재해 총 10목 24과 106종이 채집이 되었다. 비록 정점별 종과 개체수는 다르지만 조사 시기별로는 정점 간 유의한 차이를 나타내지 않았다. 정점별 우점종은 달랐다. 2009년 5월 정점에 대해 정점 1이 5종인 반면 정점 2는 66종으 로 차이를 보였으며 평균 종수는 38.3종이었다. 반면에 정점 2는 2009년 11월에 가장 많은 종수를 나타내었고 정점 3은 가장 낮았다. 대형무척추동물 중에서 절지동물문(Phylum Arthropod)이 종 수준 또는 개체 수준에서 우점이었는데 종 수준으로 5월은 63.2%, 11월은 60.9%였다. 조사 정점에 대한 환경 인자 분석의 결과 대형무척추 동물의 서식에 미치는 인자로 용존산소량(DO), 생물학적 산소요구량(BOD), 화학적 산소요구량(COD)이 중요한 것으로 나타났다. 생물학적 종다양도는 섬진강 상류에서 하류로 갈수록 낮아지는 경향을 나타내었다.
"stock enhancement" can help, but it is also necessary to stop or repair the damage to aquatic habitat, and control the rate of fishing.
In conclusion, this study showed that seasonal patterns in the community structure of the macro-benthos in the Seomjin River correspond with the dynamics of the river environment, including the DO, BOD, COD, and salinity of water. The relationship between macro-benthos community and the environment shown by this fine-scale investigative study will contribute to future studies, such as those on long-term changes in their community structure and spatial distributions.
References
1. APHA. 1985. American Public Health Association. Standard Methods for the examination of water and waste water 15th edition.
2. Hadong-gun. 2012. http://www.hadong.go.kr/main.
3. Hynes, H. B. N. 1963. Imported organic matter and secon- dary productivity in streams. Proc. 16th Int.Congr. Zool.4, 324-329.
4. Jawad, L. 2003. Impact of environmental change on the fresh- water fish Fauna of Iraq, Inter.J. Environ. Stud.60, 581-593.
5. Kehde, P. M. and Wilhm, J. L. 1972. The effects of grazing by snails on community structure of periphyton in labo- ratory streams. Am. Midl. Nat. 87, 8-24.
6. Magurran, A. E. 1988. Ecological diversity and its measurement. Univ. Press, Cambridge.
7. McNaughton, S. J. 1967. Relationship among functional properties of California Glassland. Nature216, 144-168.
8. Nagai, N., Tadokoro, K., Kuroda, K. and Sugimoto, T. 2006.
Occurrence characteristics of chaetognath species along the PM transect in the Japan Sea during 1972-2002.J. Oceanogr.
62, 597-606.
9. Nagai, N., Tadokoro, K., Kuroda, K. and Sugimoto, T. 2008.
Chaetognath species-specific responses to climate regime shifts in the Tsushima Warm Current of the Japan Sea.
Plankton Benthos Res. 3, 86-95.
10. Nelson, J. S. 1994.Fishes of the World. pp. 1-600, 3rd eds., John Wiley and Sons Inc., New York.
11. Pielou, E. C. 1975.Ecological Diversity. pp. 1-165, John Wiley and Sons, New York.
12. Shajan, K. P. 2001. Geochemistry of bottom sediments from a river-estuary-shelf mixing zone on the tropical southwest coast of India. Bull. Geol. Survey Japan52, 371-382.
13. Shannon, C. E. and Weaver, W. 1963. The mathematical theo- ry of communications. University of Illinois press. Urbana, pp. 117. ISBN: 0-252-72548-4.
14. Sheik, R. A., Fisher, S. J. and Willis, D. W. 1998. White crap- pie biology in an upper missouri river backwater. Proc.
Acad. Sci. 77, 151-161.
15. Surber, E. W. 1937. Rainbow trout and bottom fauna pro- duction in one mile of stream. Trans. Am. Fish Soc. 66, 193-202.
16. Tabatabaie, T. and Amiri, F. 2010. The impact of industrial pollution on macrobenthic fauna communities. Afr. J.
Environ. Sci. Tech. 4, 547-557.
17. Tejerina-Garro, F. L., Maldonado, M., Ibanez, C., Pont, D., Roset, N. and Oberdorff, T. 2005. Effects of natural and an- thropogenic environmental changes on riverine fish assemb- lages: a framework for ecological assessment of rivers.
Brazilian Arch. Biol. Tech. 48, 91-108.
18. Warton, D. I., Wright, I. J., Falster, D. S. and Westoby, M.
2006. Bivariate line fitting methods for allometry.Biol. Rev.
Camb. Philos. Soc. 81, 259-291.