〈Research Paper〉
Particle Size, Morphology and Color Characteristics of C.I. Pigment Red 57:1 : 2. Effect of Salt Milling Process
Hee Sung Seo, Hyun Kyung Lee1 and Eui Sang Yoo1,†
Department of Clothing and Textiles, Ewha Womans University, Seoul, Korea
1Human and Culture Convergence Technology R&D Group, Korea Institute of Industrial Technology, Ansan, Korea
(Received: October 12, 2015 / Revised: November 24, 2015 / Accepted: December 01, 2015)
Abstract: The effect of salt milling process on the crystal size, morphology, and color characteristics of C.I.
Pigment Red 57:1 was studied. The primitive morphology and color properties of the pigment after synthesis were studied in the former series work. The size and morphology of primary particles and the second aggregation features should be considered because they are very important to determine pigment quality. We compared the primary morphology of pigment particles before drying with the secondary aggregated morphology of pigment particles after drying and salt milling process. Morphological properties were investigated by particle size analysis, X-ray diffraction, and scanning electron microscopy and color measurement was carried out. Significant reduction in particle size as well as enhanced crystallite size after salt milling process was observed. This result might give a difference in color of the pigment, turning into brighter and more blue-toned red color. It was revealed that synthesis condition affect the morphology and color of the pigment even after milling. Increase in HCl concentration in the synthesis process enhanced crystal size and quality forming bluer-red pigments but an increase in CaCl2 concentration resulted in more amorphous crystals forming darker-red pigments after salt milling.
Keywords: C.I. Pigment Red 57:1, salt milling process, crystal size, crystal morphology, color characteristics
†Corresponding author: Eui Sang Yoo ([email protected])
ⓒ2015 The Korean Society of Dyers and Finishers.
All rights reserved. TCF 27-4/2015-12/245-260
1. Introduction
Morphological characteristics and the dispersion properties of pigments are very important factors for quality of inks such as clear hue and high color strength. Many efforts have been made to improve particle dispersions effectively for applications such as dyeing, ink, paints and so on. The process to reduce the size of the coarse aggregate particle to a fine size of dispersed particle for use as color pigment is called ‘Pigmentation’1–3).
The initial crude pigment form, i.e., the coarse- crystalline or solid form right after synthesis, is then converted to a pigmentary form comprising discrete primary particles. Since the crude is generally irregular in particle size, lacking in tinctorial strength and
harsh in texture4), the need for improved properties suitable for printing inks has motivated the pigmen- tation. Milling is the well-known method of the pigmentation5).
This study focuses on the pigmentation particularly of the calcium-complex azo pigment, C.I. Pigment Red 57:1 (PR 57:1). A series of pigment samples prepared systematically with various synthesis conditions were attempted to produce good pigments with improved properties in terms of their crystal size and mor- phology, and color properties. It is well-known in the industry that, not only conditions of synthesis, but subsequent post-procedures (including drying and grinding of pigment particles) also act importantly on the particle properties such as particle/crystal size and the aggregation state6).
The deaggregation provides smaller particles and higher surface area thus allows stronger color develo- pment, brightness, and hiding power, with better
flow properties7). These definitely determine the appli- cation performance of the pigment. In this work, as a milling process, modified lab-scale salt milling process was employed instead of a conventional salt milling process widely used in display industry8,9).
This new lab-scale salt milling process turned out to be effective for reducing the pigment particle size.
PR 57:1 has been reported that it has a crystalline structure and anisotropic growth features in the com- plex form10-17), but there have been no studies on their morphological changes by the milling and resulting color changes.
The objective of this study is to investigate the effects of the salt milling process on the morphology of PR 57:1 pigment particle such as particle size and crys- tallite size (primary particle) and to study on the relationship between the morphology of pigment particle and colorimetric properties.
Pristine pigments before salt milling were pre- pared through several varied synthesis conditions, i.e., variation of HCl and CaCl2 concentrations; there- fore, they have different crystallite size and pigment particle size, and those results of particle aggregate size were discussed in detail in another previous series work.
As a consequence based on the experimental data, we could suggest schematic diagrams of the morpho- logical changes of pigments during salt milling process including primary particle size and aggregated particle formation.
2. Experimental
2.1 Preparation of the pigment samples of PR 57:1
All reagents used in the synthesis of PR 57:1 were kindly donated by Ukseung Chemical Co., Ltd.
The pigment samples of PR 57:1, for the calcium -complex azo pigment, were synthesized by coupling 3-hydroxy-2-naphthoic acid (BON-acid) onto 2-amino- 5-methyl benzene sulfonic acid (4B-acid) via well
-known azo-coupling reaction and subsequent calcium salt conversion procedure under alkaline conditions18-20), using a procedure described in the previous series work. Variously synthesized pigment samples of PR 57:1 were prepared and then used for salt milling process. HCl and CaCl2 concentrations were changed in the synthesis process at pH of 9.5. On the basis of stoichiometric amounts of 4B acid (88.8g, 0.474mol) and BON-acid (89.2g, 0.474mol), the standard amounts of HCl and CaCl2, i.e., 22% HCl solution (136mℓ) and CaCl2 (95.6g) in water (500mℓ) are used for the reaction. Then, the amounts of HCl or CaCl2
were changed by addition or subtraction by 10% for the other reaction.
As a result, 9 samples of pigment of the PR 57:1 were obtained and listed in Table 1 with sample codes. Amount HCl and CaCl2 for the standard reaction in above description are denoted as “0” in Table 1.
2.2 Process of salt milling
The crude pigment suspensions of all the synthesized samples were dried in an oven at 60ºC for 24hour, and grinded in the presence of the salt, NaCl, by means of a mechanical force, a millstone (Dolgreen, Banseok Electronics, Korea).
The salt used for milling is the same one as used in mill-base manufacturing process in the display industry. The particle size of the salt used in the present study was characterized at Table 2.
Proportion of salt to pigment was 4:1 by weight, using methanol as a solvent. A 30mℓ of methanol was added to the mixture of 2g of pigment and 8g of salt. The milling process was carried out at room temperature, and repeated 3 times.
Centrifugal filtration was conducted for the salt- elimination, at 70,000rpm, for 1hour and in 5- repetition. Complete salt removal was confirmed with SEM-EDX (JSM-5510, JEOL Co., Japan).
After drying the resultant product, fine red powder of PR 57:1 was finally obtained.
No. HCl CaCl2 pH No. HCl CaCl2 pH No. HCl CaCl2 pH
1 −10% −10% 9.5 4 0 −10% 9.5 7 +10% −10% 9.5
2 −10% 0 9.5 5 0 0 9.5 8 +10% 0 9.5
3 −10% +10% 9.5 6 0 +10% 9.5 9 +10% +10% 9.5
Table 1. Sample codes for synthesized pigments with respective synthesis conditions
Salt Mean(µm) Median(µm) Mean/Median ratio S.D(µm)
46.03 39.33 1.170 35.61
Table 2. Particle size of the salt used for salt-milling
2.3 Measurements of properties
Liquid suspensions of all the salt-milled/non-milled pigment samples were prepared without drying to measure particle size. The pigment suspensions were diluted 100-fold in distilled water, then sonicated for 2hour for dispersion of the pigments before particle size analysis. The particle sizes were measured using a particle size analyzer (LS™ 13 320 Particle Size Analyzer, Beckman Coulter Inc., USA).
All pigment samples were dried in a 60°C oven, for 24hour. The degrees of crystallization of the dried samples were examined by a wide-angle X-ray diff- ractometer (WAXD; Rigaku Denki Co., Japan) with nickel-filtered CuKα radiation (λ=1.5406Å) at 40kV and 100mA. The scanning experiment was carried out at the equator over a 2θ range from 3° to 40° at a scan speed of 10°/min.
For the SEM sample preparation, all pigment samples were dispersed ultrasonically in distilled water.
One droplet of solution by Pt wire was placed on a piece of silicon wafer and the solvent was allowed to evaporate at room temperature. The micrographs were obtained on a Scanning Electron Microscope (JSM-5510, JEOL Co., Japan) with an exposure time of 4s at a magnification of 5,000.
1.2g of pigment was mixed with 0.2g of mineral oil varnish, and the color mixture was painted on a white pater using a doctor blade21).
This painted paper was then covered with a transparent OHP film for diffusion control, and dried before measuring the color. The dried paint- films were tested for color measurement. CIE L*a*b* values were measured using CIE 1976 L*a*b* method22) by Computer Color Matching (CCM; Color-eye® 3100, Gretag Macbeth Co., USA) at illuminant D65/10º.
3. Results and Discussion
Modified lab-scale salt milling method yielded in most cases submicron-scale particles. The PR 57:1 particle size variation after salt-milling, compared to that in non-milled samples is shown in Figure 1.
1 2 3 4 5 6 7 8 9
0.0 0.5 1.0 10 15 20 25
Particle size (um)
Sample No.
non-milled sample salt-milled sample
Figure 1. Particle size variation of salt-milled samples compared with non-milled samples.
As shown in Figure 1, the pigment particle size was reduced drastically down to hundreds of nano- meter-scale (in the range 0.5-1.0µm) by salt milling.
This scale is 3-4% of the original particles size, tens of micrometer-scale (in the range 15-28µm). The new lab-scale salt milling process was therefore found to be so effective for reducing the pigment particle size.
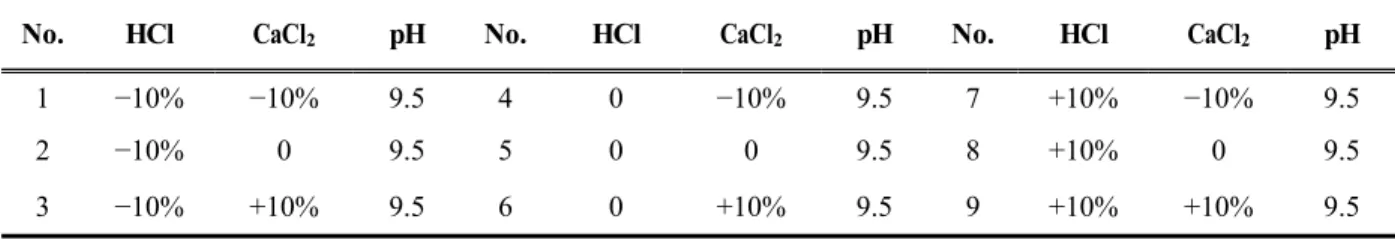
It was also found that primary particle size of the pigment, i.e., crystallite size, increased through the salt milling process as well as pigment particle size reduction by XRD diffraction analysis. The crystalline characteristic such as degree of crystal- linity and the crystallite size were presented in Figures 2a and 2b for non-milled samples and salt-milled samples, respectively.
Both XRD patterns in Figures 2a and 2b showed that synthesized PR 57:1 is so highly crystalline before and after salt milling. XRD peaks are composed of sharp and highly-intense crystalline diffraction peaks and few broad background peaks (related to disordered molecular packing).
The peak patterns in Figures 2a and 2b were practically identical in a crystalline peak position, meaning crystalline phase was not changed after salt milling. The XRD pattern reflects the intrinsic crysta- lline structure of PR 57:1.
5 10 15 20 25 30 35 40
0 500 1000 1500 2000 2500 3000 3500 4000 4500
4 5
600 900 1200 1500 1800 2100 2400 2700 3000
3300 non-milled 1
non-milled 2 non-milled 3 non-milled 4 non-milled 5 non-milled 6 non-milled 7 non-milled 8 non-milled 9
(a)
Diffraction angle (2 , o )
Intensity (non-milled particles)
X 5
5 10 15 20 25 30 35 40
0 500 1000 1500 2000 2500 3000 3500 4000 4500
4 5
600 900 1200 1500 1800 2100 2400 2700 3000 3300 3600 3900
4200 Salt-milled 1
Salt-milled 2 Salt-milled 3 Salt-milled 4 Salt-milled 5 Salt-milled 6 Salt-milled 7 Salt-milled 8 Salt-milled 9
Intensity (Salt-milled particles)
Diffraction angle (2 , o ) X 5
(b)
Figure 2. X-ray powder diffraction traces of (a) non-milled samples and (b) salt-milled samples overlapping each graph of 9 samples.
Although all the synthesized samples before salt milling were highly crystalline, the crystallinity of all the samples further increased after salt milling process.
Apparently, the 002 diffraction peaks in Figure 2b get sharper and shift to higher angle compared to Figure 2a.
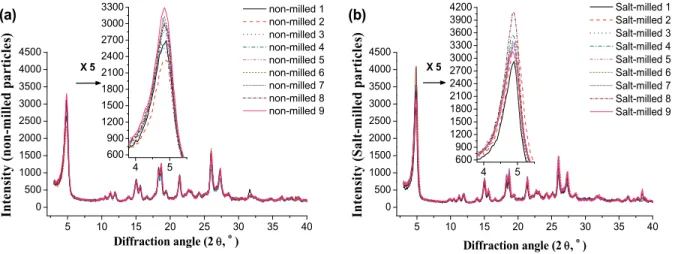
It would be the implication of the increase in lattice orientation and decrease in inter-planar spacing in the crystal lattice. In Figure 3, one pair of the XRD peaks of PR 57:1 before and after salt milling was drawn to explain the differences.
In Figure 3, the observed decreases in intensities of crystalline diffraction peaks at 2θ in the range of 10-30º for salt-milled sample No. 8 could be inter- preted as a possible reduction of amorphous or disordered region resulting the apparent increase of crystallinity.
The crystallinity in XRD patterns should be calcu- lated by the ratio of crystalline diffraction peak area and amorphous diffraction peak area.
However, sometimes the peak separation process in the whole 2θ region is too complicated to get meaningful results. In this study, it is tried to sup- pose the relative degree of crystallinity simply from the intensity differences of the strongest diffraction peaks23).
5 10 15 20 25 30 35 40 0
1000 2000 3000 4000
Intensity
Diffraction angle (2 , o)
Salt-milled sample No.8 Non-milled sample No.8
Diffraction angle
Figure 3. An example of X-ray powder diffraction pattern of salt-milled sample compared to non- milled sample.
The strongest diffraction in PR 57:1 XRD pattern is at 2θ of around 4.9º assigned to (002) plane diff- raction according to the study on crystallographic feature of PR 57:1 by S. L. Bekö17) and using Bragg equation (λ=2dβsinθ; λ=1.5406Å)24).
The PR 57:1 pigment had been reported to cry- stallize in a double-layer structure of Ca-complex, taking the growth direction parallel to the crystal- lographic b-planes15–17).
But even then, it has the lattice elongated along its c axis in a unit cell dimension25), in a rod-like crystal form. No preferred orientations can be also accepted for this crystalline phase15).
The crystallinity judging from (002) planes diff- raction absolutely increase by salt milling. With the subtle peak-location shifts without broadening, their lattice distortions can be negligible26-28).
Thus the observed narrowing of the peaks is pre- dominantly attributed to the increase in crystallite size. Using the Scherrer equation (d=0.9λ/βcosθ, λ=
1.5406Å) and FWHM of (002) diffraction peak, the crystallite size was calculated23). Calculated crystallite size revealed the original crystallites (106.07-122.96Å) grew to bigger size (120.41-144.48Å).
With a significant (96-97%) reduction in particle size (Figure 1), the growth (16%) of crystallite size and concomitant increase (21%) in (002) peak intensity due to salt milling were observed.
All these evidences could be a sign of the recrysta- llization by the growth of preexisting crystallites, i.e., crystal-regrowth behavior of the particles. It demon- strates their morphology transitions to coherently- crystalline fine particles from coarse-crystalline large particles.
This might be a result of absorbing the high energy from milling process, e.g., a shear force induced during grinding pigments, a power of breaking particles down, effects of frictional heat, strain and solvent involved. More perfect crystals are less prone to agglo- merate, and disperse more easily18); it is essential in the advanced color development of pigments.
By the way, it was found there was a noticeable difference in the extent of the particle size reduction in each sample in Figure 1. We prepared each sample by different synthesis condition, different HCl and CaCl2 concentrations. This affected the particle and crystallite size and aggregation shape of the syn- thesized pigments.
These different morphological aspects of pristine sample might be considered as the main reason for difference in the extent of the particle size reduction in each sample in Figure 1. The differences of pristine samples can also make the salt milling-induced crystallization in each sample.
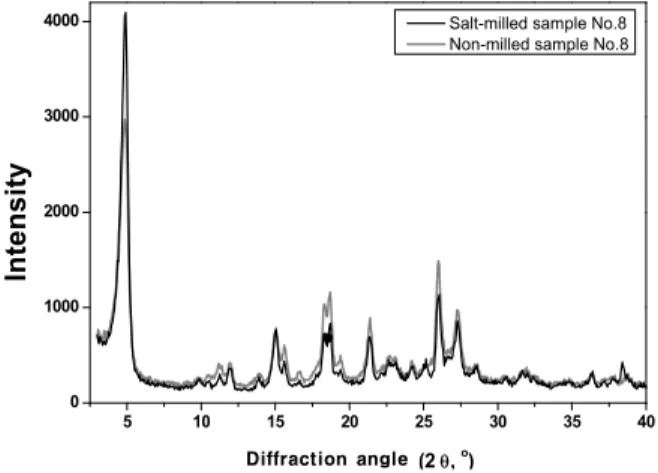
In Figure 4, we introduced the meaning of ‘average value’ of the particle sizes, crystallite sizes, and in- tensities of (002) diffraction peaks of XRD. As denoted in Table 1, HCl concentration has changed with three levels at fixed CaCl2 concentration. And reverse has been done, also. The average particle size at one component concentration in Figure 4 could be calculated using that of samples with fixed CaCl2 (or HCl) concentration with three levels of HCl (or CaCl2) concentrations.
Figures 4a, 4b, and 4c show the average particle size variations, average crystallite size variations, and average (002) diffraction peak intensity variations, respectively.
Average particle size in Figure 4a decreased with both concentrations of HCl and CaCl2 for non-milled
-10% 0 +10% -10% 0 +10%
0.7 0.8 0.9 1.0 14 16 18 20 22
(a)
Average particle size
Synthesis Condition
Non-milled paricles Salt-milled particles HCl con.
CaCl2 con.
HCl con.
CaCl2 con.
-10% 0 +10% -10% 0 +10%
105 110 115 125 130 135 140
Non-milled paricles Salt-milled particles HCl con
CaCl2 con.
Average crystallite size
Synthesis condition
HCl con CaCl2 con.
(b) Non-milled paricles Salt-milled particles HCl con
CaCl2 con.
HCl con CaCl2con.
-10% 0 +10% -10% 0 +10%
2500 2600 2700 2800 2900 3000 3100 3200 3300 3400 3500 3600
Average Intensity of main peak
Synthesis condition Non-milled paricles Salt-milled particles
HCl con CaCl2 con.
HCl con.
CaCl2 con.
(c)
Figure 4. Average particle size, crystallite size, and intensity of main peak of XRD for non-milled and salt-milled samples, as functions of HCl and CaCl2 concentrations.
samples, but for salt-milled samples, it decreased linearly with CaCl2 concentration and non-linearly with HCl concentration.
It implies that morphology and aggregation states of the particles had been formed in different ways depending on each synthesis parameter condition.
From Figure 4a, the biggest decrement of average particle size (a 96.4% decrease, from 20.74 to 0.75µm) by salt-milling was observed at the samples of a
−10% of HCl concentration.
The particle size decrement after salt milling was found inversely dependent on HCl concentration. It could be indicative of harder solid structures of synthesized particles with HCl concentration.
In Figures 4b and 4c, it was also observed that the average crystallite size and crystal (002) diffraction peak intensity increased with HCl concentration. It means that their constituent crystallites are larger and
strong enough to withstand the shear stress during salt milling. This might account for the crystal- line-aggregate morphology of the particles synthesized at higher HCl concentration.
Such crystalline structures might be ascribed to the strong aggregation tendency of pigment particles.
Because of the strong aggregation effect, the particles synthesized at higher HCl concentration might result in smaller particle size than those synthesized at lower HCl concentration (Figure 4a, left).
The particles synthesized at lower HCl concentration (Figure 4a, left) could have an easily dissociable bulk form. Such a tendency to easily break may arise from an agglomeration (weak aggregation) structure of the pigment particles.
In general, the smaller primary particles in synthesis make an agglomeration structure. The lower average crystallite size of the synthesized particles (Figure
4b, left) could reflect their agglomeration potential at lower HCl concentration. This characteristic was also proved by the decreased average (002) diffraction peak intensity (Figure 4c, left) of the particles, im- plying the degraded crystallinity of the particles.
This could characterize the possible coarse-aggregate morphology of the particles due to lower HCl con- centration.
These results suggest that the HCl concentration in the diazotization process is critical in determining for the selected aggregation states of the particles29). It means that the acidity during the formation of the particles may influence the inter-particle cohesion, which could be responsible for the stiffness or strength of the aggregates and the size of primary crystallites. Increasing the HCl concentration can be beneficial for providing small compact crystal structures of pigment particles.
From Figure 4a, the decrease in average particle size during salt milling for the sample of −10% CaCl2
concentration had a decrease of 95.1% (from 20.37 to 1.00µm); the sample of a +10% CaCl2 concentration showed a 95.0% decrease (from 14.31 to 0.71µm).
This means that the extent of deaggregation was not appreciably changed with the variation in CaCl2
concentration, suggesting that the aggregation states of the synthesized particles did not change. Such invariant properties of the aggregation structure might indicate the unaffected cohesive strengths of the particles against shear stress, meaning their invariable crystal- linity. It was manifested in the insignificant variation in the average (002) diffraction peak intensity with CaCl2 concentration in Figure 4c (left). This might result from the consistency in size of the primary particles. It corresponds to the almost constant variation in the average crystallite size with CaCl2
concentration in Figure 4b (left).
The definite decrease in average particle size for the synthesized particles at different CaCl2 concentration (Figures 4a and 4b, left) should be noted. The increase in particle size with decreasing Ca2+ concentration might be predominantly due to the increasing number
of crystallites in the aggregates. The increased particle size seems little affected by the size of the grown crystallites or by the agglomeration tendency of the crystallized particles, which was found with decreasing HCl concentration. The larger number of crystallites formed during the synthesis might allow for the increase in crystallite size and hence, increase in particle size with shear stress during salt milling (Figures 4a and 4b, right).
We have recognized the HCl concentration-dependent variation in aggregation states and morphology of the synthesized particles. We also observed in Figures 4b and 4c (right) that increasing the HCl con- centration increases the average crystallite size and the (002) diffraction peak intensity of the particles after salt milling, as opposed to increasing the CaCl2
concentration. It could be evidence of increases in the cohesion and orientation of crystallites in the aggregates, in combination with the salt-milling effect described above. The HCl concentration increase seems to be involved in the salt-milling-induced recrystallization of particles more progressively. It means that the growing crystal phase of the particles is stabilized at increasing HCl concentrations, toward the formation of a more perfect crystal structure.
It is important to note that, in comparing the figures from left to right in Figures 4b and 4c, the increases in the average crystallite size and (002) diffraction peak intensity during salt milling were reduced when the concentrations of HCl and CaCl2 increased.
The increases in average crystallite size and (002) diffraction peak intensity at a –10% HCl concen- tration, i.e., 22% (from 107.1 to 130.8Å) and 27%
(from 2554.3 to 3244.3cps), respectively, are higher than the 13% (from 116.7 to 132.1Å and from 3128.7 to 3535.7cps, respectively) at a +10% HCl concentration.
Their increases at a –10% CaCl2 concentration, i.e., 22% (from 113.1 to 137.5Å) and 11% (from 2935 to 3277.3cps) are also higher than those at a +10%
CaCl2 concentration, i.e., 10% (from 112.2 to 123.7Å) and 7% (from 3026 to 3242cps), respectively.
If the increase in the crystallite size during salt milling is a result of regrowth of crystallites that take part in the recrystallization during salt milling, then the reduction in crystallite size could represent a more stable state of the aggregate structure.
Alternatively, this could represent a higher resistance against further growth by the milling force, that is, a higher degree of crystallinity of the particle. Thus, the degraded crystallinity of the particles might result in acceleration of the regrowth of crystallites under shear stress.
In other words, the crystallite regrowth of the particles via salt milling could be inversely pro- portional to their original crystallinity. The lower the original crystallinity of the particle (Figure 4c, left) the greater the increase in the crystallite size (Figure 4b, right). This is evident especially for particles synthesized at lower HCl concentration; the greater the extent of agglomeration that occurs (Figure 4a, left), the smaller the size of the crystallites (Figure 4b, left) and in turn, the higher the crystal regrowth of particles tended to be.
This is considered to be related to the structural relaxations at the lower concentrations. Greater stress absorption during the milling and the residual stress in the relaxed structure to grow the crystallites could be the reason for the higher regrowth efficiency of the particles. Such a relaxed structure at the lower concentrations was confirmed in our later SEM results. On the contrary, the particles with a higher crystallinity could show the retardation of their regrowth, due to the decelerated absorption of shear stress into the stabilized structure.
The possible relaxed structure of the particles at the lower HCl concentration might be due to supp- ressed nucleation and inhibitory effect of the azo coupling reaction30).
The partial irregular forms could be formed by solidification prior to crystallization with Ca2+.
It might increase the instability of the particle, such as a lack of crystal orientation, a degeneracy of the crystalline phase, and a loss of crystallinity.
It is suggestive of a serious agglomeration pheno- menon, giving more chance for crystallite regrowth, which results in an increase in the average crystal- lite size after salt milling (as high as that at higher HCl concentration) (Figure 4b, right). But here, lower average (002) diffraction peak intensities of the particles were observed even after salt milling (Figure 4c, right).
This might reflect their locally disordered character, resulting from the heterogeneity of the size of the synthesized particles due to their slower nucleation.
Contrarily, the numerous uniform nuclei formed by the rapid nucleation of the particles at the higher HCl concentration might have caused hard crystallite aggregation, preferred orientation, and larger cry- stalline phase, and as a result, the retarded regro- wth of crystallites during salt milling.
Particles synthesized at ±10% HCl concentrations appear to be analogous in crystallite size (Figure 4b, right), but they are qualitatively different. It could be related to their differentiation of color changes.
Because of the reduced Ca2+ ions, the particles might contain several noncomplexed ligand sites. These could induce disorders, spacing, or larger boundaries in the aggregates, as possible causes for defects in the particle.
In turn, they might act as a regrowth-inducing factor because of the higher milling-energy absorption of the defects. However, the particles still seem to have severely damaged crystalline phases (Figure 4c, right), even with the highly grown crystallite size after salt milling (Figure 4b, right).
The imbalance between their regrowth rates over the crystalline regions with the defects might have affected the result.
However, with increased Ca2+ ions, the particles reduced the regrowth of crystallites during salt milling.
The reason could be the relatively slight increase in the average (002) diffraction peak intensity (Figure 4c, left) combined with the almost constant average crystallite size (Figure 4b, left) with CaCl2 concen- tration.
This means that the increased Ca2+ ions might lead to a slight aggregation effect on the crystallites of the synthesized particles, even if the effect was not very significant here.
In general, an increase in salt concentration can result in particle aggregation during crystallization31). A portion of the aggregating effect seemed to deteriorate their regrowth efficiency during salt milling.
Furthermore, for the salt-milled samples, significant reductions in average particle and crystallite sizes with higher Ca2+ concentration (Figures 4a and 4b, right) were observed.
It could result from suppression of the salt-milling -induced recrystallization of the particles due to the increase in Ca2+ ions.
The average (002) diffraction peak intensity was also found to decrease (Figure 4c, right).
This suggests that the Ca2+ ions can cause a poor crystalline nature of the particles with salt milling.
We could define the control of crystal growth and morphology of pigment particles as depending on Ca2+ concentration. Such a Ca2+-dependent growth control effect could be related to the impurities given off from the unreacted and trapped Ca2+ ions (Ca impurities) in the crystal lattice.
(a) A function of HCl concentration (b) A function of CaCl2 concentration
Figure 5. Schematic diagrams for particle phases of PR 57:1 showing changes in morphology of secondary aggregates and the primary particles via salt-milling process, as functions of HCl and CaCl2 concentrations.
The Ca impurities might act as a growth barrier32,33) of particles, limiting not only the crystallization, as seen in the particle size reduction of the synthesized particles (Figure 4a, left), but also the subsequent recrystallization during salt milling (Figure 4b, right).
The recrystallization control effect might result from the localized shear stress due to the Ca im- purities trapped during the synthesis. Such defective morphologies with lower and higher numbers of Ca2+ ions are both assumed to be instable.
The instable characters would affect the color results of the particles with respect to the degradation of the crystal quality.
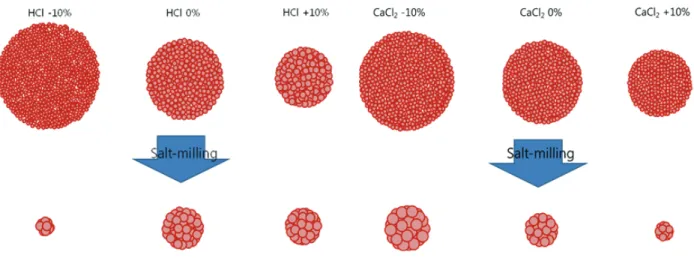
The changes in morphology of primary particles and the secondary aggregates of this pigment caused by changes in HCl and CaCl2 concentrations are sim- plified in diagram form in Figures 5a and 5b, respectively (for convenience, the pigment particles are described as spheres).
These figures give a better understanding of the reconstructed crystalline phases of the particles in salt-milling processing; (a) HCl results in a small, strong aggregate of large particles, changing to a large primary particle of large crystallites; (b) CaCl2 results in a small aggregate of constant-size particles, changing to a small primary particle of small crystallites.
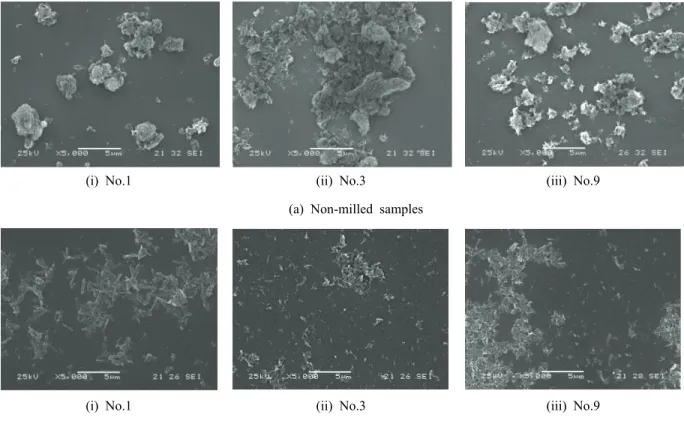
(i) No.1 (ii) No.3 (iii) No.9 (a) Non-milled samples
(i) No.1 (ii) No.3 (iii) No.9
(b) Salt-milled samples
Figure 6. Scanning electron micrographs of non-milled samples (×5000) (a) non-milled samples, (b) salt-milled samples
.
Therefore, HCl addition is suggested to induce the formation of larger crystals of pigment particles during salt milling.
The morphological differences of the particles with salt-milling at various synthesis conditions were observed in SEM micrographs. The examples are shown in Figure 6. A better dispersion of pigment particles was achieved through salt milling (Figure 6b), resulting in a disappearance of particle agglomerations. The bulky and coarse-crystalline phase of synthesized (non- milled) particles was confirmed, evidenced by the irregular sizes and forms with rough surfaces (Figure 6a). A morphological change of the particles due to salt milling into a discrete fine phase of rod-shaped crystals was observed.
For the given set of variation in synthesis con- ditions in the SEM images in Figure 6, the following tendency was observed.
(1) Comparing Figure 6a ii with Figure 6a iii, a reduction in particle size with increasing HCl con- centration was noticed, because the extensive agglo- merate phase was diminished and distributed.
The relative smaller, lighter and denser particles in Figure 6a iii could infer the HCl concentration- induced particle aggregation phenomenon. This, there- fore resulted in less ground larger particles with salt milling in Figure 6b iii than in Figure 6b ii.
(2) Comparing Figure 6a ii with Figure 6a i, the particle agglomeration structure is more pronounced with increasing CaCl2 concentration, if combined with a decreasing HCl concentration.
The smaller crystallite size and the inferior crys- tallinity of the particles induced by the Ca impurities are proven, causing such massive agglomerate for- mation externally. This leads to an enhancement of the reduction in particle size during salt milling, as seen in Figure 6b ii.
(3) The most distinct growth (or elongation) of primary particles was identified visually when both HCl and CaCl2 concentrations were decreased, in Figure 6b i.
It shows that the primary particles grew more progressively during salt milling, provided that their secondary aggregate is denser and smoother (Figure 6a i) rather than looser and coarser (Figure 6a ii),
implying a stronger aggregated structure. Thus, it might be related to the impacts of the aggregation states and the stability of the particles on their crystal regrowth ability. In other words, such particle growth or elongation effects could be due to higher surface reactivity of the particles originally present, resulting in a greater regrowth potential of crystallites by shearing with salts. This demonstrates the inverse correlation between the crystallite size increase during salt milling and the original crystallinity of the synthesized particles that we defined above.
It should be noted that the size of this particle (Figure 6a i) based on particle size analysis is larger (26.76µm) than that based on SEM (roughly 3-4µm).
This difference may arise because this particle could have been coarsely agglomerated by weak inter- actions during the size analysis, disturbing the size definition, whereas the ultrasonication for the agglo- merate breakup before SEM inspection could result in the determination of a smaller size.
This demonstrates the relative small secondary particle size in Figure 6a i compared to Figure 6a ii, showing only a portion of the particle agglomerates that caused by lower HCl/CaCl2 concentrations. This could imply the instability of the agglomeration structure. Such an unstable state of the particle is the factor that induces the development of crystallites during salt milling with an improved efficiency, as observed.
As a result, the milling-induced morphology transition into an elongated rod-like crystal phase is manifested
Non-milled samples Salt-milled samples
No. L* a* b* No. L* a* b*
1 24.28 45.51 29.7 1 32.93 50.0 21.55
2 28.88 40.31 21.69 2 30.70 48.61 17.17
3 26.54 46.41 28.38 3 31.59 46.80 13.98
4 27.81 49.31 31.98 4 31.88 44.07 11.19
5 26.96 47.86 30.65 5 30.36 44.26 11.37
6 26.73 47.98 31.67 6 29.14 45.64 15.92
7 27.94 49.3 33.16 7 33.08 45.3 6.52
8 28.91 47.41 28.84 8 34.64 39.82 8.03
9 24.47 48.41 33.44 9 29.01 46.05 12.58
Table 3. Color characteristics (CIE L*a*b*) of variously synthesized pigments
particularly in Figure 6b i. Even if no accurate estimation of the individual size per agglomerate is available, it is obvious that the primary particles, several nanometers size (Figure 6a i), could be recrys- tallized into the elongated particles of roughly 2-3 µm in Figure 6b i, possibly propagating the shear stress along the c axis.
They might have followed, however, an inevitable deterioration of the crystal quality (Figure 4c, right) during the rapid regrowth process.
The differences in aggregate size and morphology of the particles could be important factors that determine the color variation in the pigment system.
The pigment color change as a result of salt milling was confirmed to stem from the dependence of the color on the size of the primary particles or crystal- lites formed during synthesis.
Table 3 provides the CIE L*a*b* color charac- teristics of both salt-milled and non-milled samples.
The ‘average values’ of the color parameters, a*, b*, and L* values, obtained from Table 3, were calculated and displayed as functions of HCl and CaCl2 concentrations, in Figures 7a, 7b, and 7c, respectively.
From Figure 7, salt milling results in a very small change in a*, whereas b* decreases and L* increases significantly. These changes indicate that an app- reciable color shift of the pigment occurs upon salt milling, i.e., increasing blueness and whiteness while retaining the redness, ultimately producing a brighter bluish red (bluish effect).
-10% 0 +10% -10% 0 +10%
0.7 0.8 0.9 1.0 14 16 18 20 22
(a)
Average particle size
Synthesis Condition
Non-milled paricles Salt-milled particles HCl con.
CaCl2 con.
HCl con.
CaCl2 con.
-10% 0 +10% -10% 0 +10%
105 110 115 125 130 135 140
Non-milled paricles Salt-milled particles HCl con
CaCl2 con.
Average crystallite size
Synthesis condition
HCl con CaCl2 con.
(b) Non-milled paricles Salt-milled particles HCl con
CaCl2 con.
HCl con CaCl2con.
-10% 0 +10% -10% 0 +10%
2500 2600 2700 2800 2900 3000 3100 3200 3300 3400 3500 3600
Average Intensity of main peak
Synthesis condition Non-milled paricles Salt-milled particles
HCl con CaCl2 con.
HCl con.
CaCl2 con.
(c)
Figure 7. Average a*, b* and L* values of salt-milled samples, as functions of synthesis conditions of HCl and CaCl2 concentration.
This result reflects the color variation of the pigment as a function of particle size, i.e., from the darker yellow-red of the larger coarse particles (12–2µm) through the bluish effect to the brighter blue-red of smaller discrete particles (< 1µm) with salt milling.
These results can be explained by the reduction in secondary agglomeration and individual primary crystal growth features of the particles by salt-milling, verified by particle size, XRD, and SEM analyses.
The color of pigments in paint system is impacted by spectral reflectance, originating from scattering on the surface, and related to the particle size and roughness33). The observed color shifts are accounted for by the reduction in particle size, because small particles predominantly scatter short wavelengths of light, whereas large particles scatter all wavelengths.
Therefore, the red reflectance increases as the pigment particles are more exposed and scatter all wavelengths35,36). The observed bluish effect of the red pigment shown in Figure 7b could be due to the increased scattering activities for short wavelengths
on the submicron-scale of the small particle surface, since the surface roughness decreases as a result of salt milling.
However, the inherent redness of this pigment survived the salt milling process (Figure 7a). This reveals that such particle size reduction effects enhanced the reflectance/scattering ability of the particles at short wavelengths, with no affecting red reflectance.
In addition, the developed crystallite size and the possible reduction of inter-planar spacing inside the particle due to salt-milling would provide more ext -ended conjugation and faster charge transfer37). This could cause the particle to enhance the light absorption at longer wavelengths with the reduced band gap energy38,39), thus resulting in a blue color shift for this smaller-sized (submicron) particle.
Therefore, the dependence of the color on particle size of the pigment with salt milling could be a direct consequence of the crystallite size. The larger and longer the crystals/crystallites are, the more the color shade will be blue shifted40).
The apparent brighter color of the salt-milled samples (Figure 7c) might be an indication of enhanced light scattering from the regularly distributed submicron -sized particles, resulting in a reduced angle of refraction and an increased reflecting surface35).
Particles with larger crystallite size and lower surface roughness, i.e., properties related to higher crystal- linity, would scatter light more effectively from a larger portion of the crystal centers, thus resulting in a brighter color. In addition, the overall whitish effect of the pigment could be a result of multiple -light scattering from the larger size crystallites and increased crystallinity within the particles. However, the smaller crystallite size, poorer crystalline quality, and rough surface morphology estimated in the coarse aggregate structure for non-milled samples could be the reasons for the lower L* values.
In principle, as particle aggregation (agglomeration) states increase, extinction (absorbance and scattering) at longer wavelengths increase because of increased scattering from the increased coarse surfaces.
However, extinction at shorter wavelengths can decrease in aggregation, because of a decrease in small primary particle surfaces40-42). In general, an increase in aggregation results in a blue color shift, which is true for the non-milled samples, especially with lower HCl concentrations (Figure 7b, left).
From Figures 7a and 7b, increases in both a*
and b* values, red and yellow tones, were most pro- minent with increasing HCl concentration for non- milled samples; however, for salt-milled samples these tones were more noticeable with decreasing HCl concentration. These results may be a consequence of the particle size reduction, which was achieved in both non-milled and salt-milled samples (Figure 2). Therefore, particles with smaller sizes and larger surface areas appear to have darker, and more reddish and yellowish colors. In other words, the yellow-red color shift is more intense for smaller particles, but scattering is more efficient for larger particles, hence larger particles produce a blue color shift. This trend was observed for both the particle sizes of the secondary aggregates and the primary particles of the pigment. Therefore, the red pigment comprised of yellowish-red particle aggregates may behave the same optically as large red primary
particles.
Similarly, the larger primary particles and aggre- gated large particles both exhibit a more pronounced bluer-red color. Ultimately, reducing the number of aggregates with salt milling can result in the color of the pigment being dictated by that of the individual primary particles.
The decrease in the b* value, the bluer-red shade, of salt-milled samples was found more clearly with higher HCl concentration (Figure 7b, right). These results are likely caused by increases in the particle and crystallite sizes (Figures 4a and 4b, right), with a more extended conjugation length. However, the yellowish-red color of salt-milled samples, corresp- onding to their smaller particle and crystallite sizes, might suggest partial crystalline damage, i.e., resonance damage, with lower HCl concentration (Figures 4b and 4c, right). An increase in L*, the brighter color, was observed at both lower and higher con- centrations of HCl (Figure 7c, right). This result may be due to larger crystallites instead of the particle size, because the average L* values depend on the average crystallite size variation (Figure 4b, right), not on the average particle size (Figure 4a, right). One possible explanation is that the particles having larger crystallite sizes make the light scattering pattern more isotropic, thus intensifying the scattering to a brighter blue color.
In contrast to the color changes produced by HCl concentration, the pigment particles grown during salt-milling with reduced CaCl2 concentration had progressively elevated L* values, rather than changed a* or b* values. This may result because the aggre- gation state, and thus the scattering ability at shorter wavelengths, mainly depends on the acidity in the diazotization process which is controlled. However, Ca2+ concentration is directly related to crystallization since Ca-chelation predominantly controls the size of the particles and crystallites formed (Figures 4a and 4b, right), which may improve the whiteness more efficiently.
Interestingly, increasing crystallite size of the particles with lower Ca2+ concentrations resulted in an increase in the L* value. Considering the influence of Ca2+ ions on the number of forming particles, rather than on their size, the drastic increase in L*
0.5 0.6 0.7 0.8 0.9 1.0 1.1 29
30 31 32 33 34 35
L* value
Particle size (um)
120 125 130 135 140 145 29
30 31 32 33 34 35
Crystallite size (A) Figure 8. Scatter plots of salt-milled particle size and crystallite size vs L* values of synthesized pigments.
values (Figure 7c, right) is the result of the large crystallite size with increasing numbers of crystallites in the aggregates. One potential explanation is that crystalline defects inside the large crystal regions, potentially caused by reducing the CaCl2 concen- tration, may increase whiteness in addition to redness.
Therefore, defects in the larger-grown particles might act as color centers, resulting in multiscattering, broader absorption, and a reduced loss of light.
However, the b* values (bluish shade) with lower Ca2+ ion concentration were not affected, even with significant increases in the crystallite size. Therefore, the increased crystallite numbers in the aggregates might increase extinction at shorter-wavelengths, and counteract the expected blue shift effect for the large crystal size.
These findings indicate that visual color transitions are not governed simply by the external size effect, but by changes in the internal crystal morphology.
Therefore, the crystallite size has a large influence on the whiteness, i.e., larger crystallites have higher L* values. This relationship is well reflected in Figure 8. While the particle size is the general factor determining the reflectance of a particle, the crys- tallite size appears to be more influential on the scattering ability and whiteness.
4. Conclusion
Well-dispersed, finely-milled submicron particles of Ca-complex azo pigments, C.I. Pigment Red 57:1,
were achieved by the salt milling process. In addition, pigment irregularities and dispersion were improved. Furthermore, the crystallite size and degree of crystallinity of individual primary particles in- creased, enhancing rigidity, elongation, and a lower roughness. Hence, a discrete rod-like primary mor- phology was produced. These morphological changes resulted in a more brilliant bluer-red pigment. Increased brightness results from the individual crystal growth and larger crystallite size.
The blue color shift was particularly significant for deaggregated primary particles with greater crystalline order and quality.
The color features in salt-milled pigment systems are the result of different particle growth mechanisms that are dependent on the concentrations of HCl and CaCl2, which influenced the crystalline morphology.
A yellow/red color shift dominated in the coarse aggregate particles of small crystals, which was con- verted into an intense blue-toned red color by in- creasing the HCl concentration. Higher HCl concen- trations are required for larger crystal size and higher crystalline quality. In addition, the HCl concentration also affected the crystal regrowth in this pigment, and the blue-shifted red color in the salt milling process. In contrast, increasing CaCl2 concentration reduced the crystal size, suppressed crystal growth and recrystallization degree, and led to more amor- phous-like crystals, thus forming a darker-red pigment.
This study can be used for pigment preparation to improve morphology control, and serve as a basis for engineering pigments with controlled size, mor- phology, crystal phase, and growth of particles by the salt milling process. Ultimately, this method may be applied to produce submicron milled-particles for coloristic reasons.
Acknowledgements
This work was supported by a grant from the Fundamental R&D Program for Core Technology of Materials and the Materials and Components Techno-
logy Development Program (10047681, Development of low cost conductive paste capable of fine pattern for touch panel and high conductivity for solar cell using metal composite with core-shell structure pre- pared by highly productive wet process), which is funded by the Ministry of Trade, Industry and Energy (MI, Korea).
References
1. V. A. Hackley and C. F. Ferraris, “The Use of No- menclature in Dispersion Science and Technology”, NIST, Washington, pp.4-30, 2001.
2. J. Kassel, Particle Dispersion for Size Analysis, J. of GXP Compliance, 15(3), 17(2011).
3. Toyo Ink Manufacturing Co. Ltd., U.S. Pat. 5776237 (1998).
4. The California Ink Co. Inc., U.S. Pat. 2982666 (1961).
5. H. Yüngevis and E. Ozel, Effect of the Milling Process on the Properties of CoFe2O4 Pigment, Ceramics International, 39(5), 5503(2013).
6. Bayer Corporation, E. I., DuPont De Nemours and Company, U.S. Pat. 6410619 B2(2002).
7. L. Pal and P. D. Fleming, The Study of Ink Pigment Dispersion Parameters, The Hilltop Review, J. of Western Michigan University Graduate Student Research, 2(1), 61(2006).
8. D. Shiota, Y. Tadokoro, K. Noda, M. Shida, and M. Fujii, Development of Low Reflectivity and High Resolution Negative-tone Photoresist, J. of Photopolymer Science and Technology, 24(4), 397(2011).
9. Toray Industries Inc., U.S. Pat. 6455208 B1 (2002).
10. R. K. Harris, P. Jonsen, K. J. Packer, and C. D.
Campbell, Investigation of the Structure of an Insoluble Pigment by Means of Nuclear Magnetic Resonance, J. of the Chemical Society, Perkin Transactions, 2(10), 1383(1987).
11. R. O. Loutfy and J. H. Sharp, Electrochemical and Spectroscopic Studies of Arylazo-2-naphthol
Metal Complexes in Dimethylformamide Solution, J. of the American Chemical Society, 99(12), 4049(1977).
12. G. R. Duckett, J. R. Fryer, and T. Baird, Electron Microscope Studies of a Mono-azo Pigment, Elec- tron Microscopy and Analysis, Proceedings of the Institute of Physics Electron Microscopy and Analysis Group Conference Held at the Uni- versity of Newcastle-upon-Tyne, 2-5 September 1985 (EMAG 85), Adam Hilger, Vol.78, p.437, 1985.
13. J. Clarkson, D. R. Armstrong, C. H. Munro, and W. E. Smith, Vibrational Analysis of the Pheny- lazonaphthol Pigment Ca4B, J. of Raman Spectro- scopy, 29(5), 421(1998).
14. Z. Hao and A. Iqbal, Some Aspects of Organic Pigments, Chemical Society Reviews, 26(3), 203 (1997).
15. A. R. Kennedy, C. M. Nair, W. E. Smith, G.
Chisholm, and S. J. Teat, The First Red Azo Lake Pigment whose Structure is Characterized by Single Crystal Diffraction, Angewandte Chemie International Edition, 39(3), 638(2000).
16. R. M. Christie and J. L. Mackay, Metal Salt Azo Pigments, Coloration Technology, 124(3), 133(2008).
17. S. L. Bekö, S. M. Hammer, and M. U. Schmidt, Crystal Structures of the Hydration States of Pigment Red 57:1, Angewandte Chemie Inter- national Edition, 51(19), 4735(2012).
18. W. Herbst and K. Hunger, “Industrial Organic Pigments: Production, Properties, Applications, 3rd ed.”, Wiley-VCH, Weinheim, p.44, 2004.
19. H. Zollinger, “Color Chemistry: Synthesis, Properties and Applications of Organic Dyes and Pigments, 2nd ed.”, VCH, Weinheim, p.182, pp.100-127, p.296, 1991.
20. R. M. Christie and S. Moss, Metal Salt Azo Pig- ments Derived from 3-hydroxy-2-naphthohydrox- amic Acid, Dyes and Pigments, 8(3), 211(1987).
21. I. M. Arabatzis, S. Antonaraki, T. Stergiopoulos, A. Hiskia, and E. Papaconstantinou, Preparation, Characterization and Photocatalytic Activity of Nanocrystalline Thin Film TiO2 Catalysts towards 3,5-dichlorophenol Degradation, J. of Photochemistry
and Photobiology A: Chemistry, 149(1-3), 237(2002).
22. R. W. G. Hunt and M. R. Pointer, “Measuring Colour, 4th ed.”, John Wiley and Sons, Ltd., UK, p.57, 2011.
23. N. M. Deraz and A. Alarifi, Structural, Mor- phological and Magnetic Properties of Nano- crystalline Zinc Substituted Cobalt Ferrite System, J. of Analytical and Applied Pyrolysis, 94, 41(2012).
24. B. D. Cullity, “Elements of X-ray Diffraction, 2nd ed.”, Addison-Wesley, USA, p.99, 1990.
25. The Supplementary Crystallographic Data for this Paper are Available from The Cambridge Crystallo- graphic Data Centre via(CCDC 851322; C18H12
CaN2O6S·3H2O, Mr=478.49, monoclinic, P21/c, a=8.7613(5)Å, b=5.8155(3)Å, c=37.943(2)Å, β
=90.883(3)º, V=1933.03(18)Å, Z=4, ρcalc=1.644gcm-3, CuKa1radiation(λ=1.5406Å), 2θ=2-80º, Measured at Ambient Temperature, Available at https://www.
ccdc.cam.ac.uk, 2015.10.01.
26. J. Lee, T. Isobe, and M. Senna, Preparation of Ultrafine Fe3O4 Particles by Precipitation in the Presence of PVA at High pH, J. of Colloid and Interface Science, 177(2), 490(1996).
27. W. H. Hall, X-ray Line Broadening in Metals, Proceedings of the Physical Society: Section A, London, Vol.62, No.11, p.741, 1949.
28. A. J. Maisano, Cryomilling of Aluminum-based and Magnesium-based Metal Powders, M.S. Thesis, Virginia Polytechnic Institute and State University, 2006.
29. R. R. Mather, The Degree of Crystal Aggregation in Organic Pigments, Dyes and Pigments, 42(1), 103(1999).
30. E. N. Oparah, Synthesis of Acid Azo Dyes based on 6-amino-1-naphthol-3-sulphonic Acid and the Assessment of their Properties on Nylon, Wool and Leather, Ph.D. Thesis, Ahmadu Bello Uni- versity, 2010.
31. M. Quinten, The Color of Finely Dispersed Nano- particles, Applied Physics B: Lasers and Optics, 73(4), 317(2001).
32. K. S. L. Corre, E. V. Jones, P. Hobbs, and S.
A. Parsons, Impact of Calcium on Struvite Crystal
Size, Shape and Purity, J. of Crystal Growth, 283 (3), 514(2005).
33. H. H. Ko, G. Yang, H. Z. Cheng, M. C. Wang, and X. J. Zhao, Growth and Optical Properties of Cerium Dioxide Nanocrystallites Prepared by Coprecipitation Routes, Ceramics International, 40(3), 4055(2014).
34. J. J. Joshi, D. B. Vaidya, and H. S. Shah, Application of Multi-flux Theory based on Mie Scattering to the Problem of Modeling the Optical Characteristics of Colored Pigmented Paint Films, Color Research and Application, 26(3), 234(2001).
35. C. F. Bohren and D. R. Huffman, “Absorption and Scattering of Light by Small Particles”, Wiley-VCH, Weinheim, pp.8-9, 2004.
36. C. S. Roesler, S. M. Etheridge, and G. C. Pitcher, Application of an Ocean Color Algal Taxa Detection Model to Red Tides in the Southern Benguela, Proceedings of the Xth International Conference on Harmful Algae, Florida Fish and Wildlife Conservation Commission and Intergovern- mental Oceanographic Commission of UNESCO, St. Petersburg Beach, Florida, USA, p.303, 2003.
37. F. Xuening, Z. Tianyong, and Z. Chunlong, Modi- fication Study Involving a Naphthol as Red Pig- ment, Dyes and Pigments, 44(2), 75(2000).
38. J. S. Bae, S. Y. Gwon, and S. H. Kim, Anthra- quinone-carbamodithiolate Assembly as Selective Chromogenic Chemosensor for Fe3+, Textile Colo- ration and Finishing, 25(1), 13(2013).
39. H. Kim, X. Li, and Y. A. Son, Electrochemical Study on Energy Potential Levels with Pyrene Mole- cule, Textile Coloration and Finishing, 25(3), 159(2013).
40. L. Chromy and E. Kaminska, Relationship between the Optical Properties of Coloured Pigments and their Morphology and Crystalline Structure, Progress in Organic Coatings, 6(1), 31(1978).
41. M. Quinten, Optical Effects Associated with Aggre- gates of Clusters, J. of Cluster Science, 10(2), 319(1999).
42. J. Turkevich, Colloidal Gold, Part II, Gold Bulletin, 18(4), 125(1985).