Investigation of geosmin removal efficiency by microorganism isolated from biological activated carbon
생물활성탄에서 분리한 미생물의 지오스민 제거효율 평가
Dawoon Baek
1・Jaewon Lim
1・Yoonjung Cho
1・Yong-Tae Ahn
2・Hyeyoung Lee
1・ Donghee Park
2・Dongju Jung
3・Tae-Ue Kim
1*백다운
1・임재원
1・조윤정
1・안용태
2・이혜영
1・박동희
2・정동주
3・김태우
1*1
Department of Biomedical Laboratory Science, College of Health Sciences, Yonsei University, Wonju, Kangwon-do, 220-710, Republic of Korea
2
Department of Environmental Engineering, Yonsei University, Wonju, Kangwon-do, 220-710, Republic of Korea
3
Department of Biomedical Laboratory Science, College of Natural Sciences, Hoseo University, Asan, Chungcheongnam-do 336-795, Republic of Korea
1연세대학교 보건과학대학 임상병리학과, 2연세대학교 보건과학대학 환경공학과,
3호서대학교 자연과학대학 임상병리학과
ABSTRACT
Recently, the production of taste and odor (T&O) compounds is a common problem in water industry. Geosmin is one of the T&O components in drinking water. However, geosmin is hardly eliminated through the conventional water treatment systems. Among various advanced processes capable of removing geosmin, adsorption process using granular activated carbon (GAC) is the most commonly used process. As time passes, however GAC process changes into biological activated carbon (BAC) process. There is little information on the BAC process in the literature. In this study, we isolated and identified microorganisms existing within various BAC processes. The microbial concentrations of BAC processes examined were 3.5×10⁵ colony forming units (CFU/g), 2.2×10⁶ CFU/g and 7.0×10⁵ CFU/g in the Seongnam plant, Goyang plant and Goryeong pilot plant, respectively. The dominant bacterial species were found to be
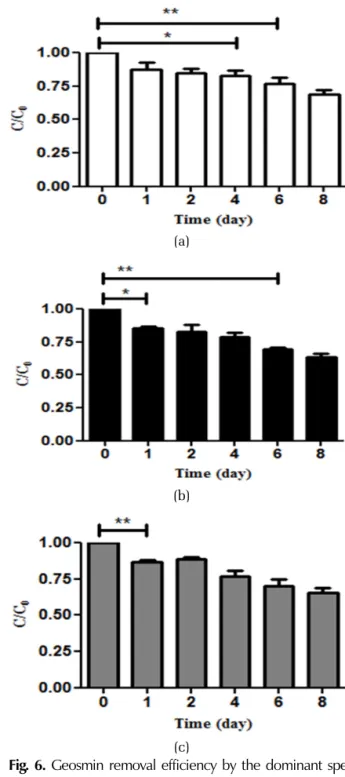
Bradyrhizobium japonicum, Novosphingobium rosa
andAfipia broomeae
in each plants. Removal efficiencies of 3 µg/L geosmin by the dominant species were 36.1%, 36.5% and 34.3% in mineral salts medium(MSM) where geosmin was a sole carbon source.Key words: Biological Activated Carbon, Drinking Water, Geosmin, Microbial Community, 16S ribosomal RNA gene 주제어: 군집분석, 먹는물, 생물활성탄, 지오스민, 16S rRNA 유전자
1. Introduction
1)Economic growth has increased living standards around the world. However this growth has affected the quality
Received 26 November 2014; Revised 28 January 2015; Accepted 02 February 2015
*Corresponding author: Tae-Ue Kim (E-mail: [email protected] )
of water, atmosphere, soil, sea pollution and has led to
the increased incidents of flooding, drought and water
bloom, which are considered a threat to public health
(Ho et al., 2007; Vorosmarty et al., 2010). Especially
water pollution is a public relation issue because of a
direct threat to our life. A common and recurrent problem
Water treatment
plant Company Goods Quality Iodine
number (mg/g)
Methylene blue number
(mL/g)
Specific surface area
(m2/g)
Total pore volume
(cc/g)
Average pore width
(nm)
Seongnam Hanyoung SLP Coal 881.2 249.4 998 0.232 3.196
Goyang Norit co. GAC1240 Coal 944.5 207.1 767 0.525 2.408
Goryeong Norit co. GAC1240 Coal 1,110.7 239.7 884 0.261 2.566
Table 1. Characteristic of activated carbons used in drinking water treatment plants in drinking water is the formation of taste and odor (T&O)
compounds (Gerber and Lechevalier, 1965; Ho et al., 2007). These compounds are naturally occurring terpene alcohols produced by cyanobacteria and actinobacteria in the aquatic environment (Bruce et al., 2002; Izaguirre et al., 1982; Robertson et al., 2006). Among T&O compounds, geosmin and 2-Methylisoborneol (2-MIB) are main metabolites of cyanobacteria in surface water, which are resulted from cellular destruction of certain species of Oscillatoria sp., Anabaena and Mougeotia sp., (Ho et al., 2007; Young et al., 1996). Both of them can cause T&O problems to sensitive people at levels as low as 10 ng/L (Meng and Suffet, 1997; Rashash et al., 1997).
It has been reported that T&O compounds have psychosomatic effects that cause consumer complaints such as headache, stress, stomach upset (Xue et al., 2011).
The removal of these compounds from water is very important for its use and consumption (Suffet et al., 1966).
Nevertheless, T&O compounds are hardly eliminated through the conventional water treatment systems composted of coagulation, filtration and chlorination. To reduce the T&O compounds in drinking water, many methods have been applied and suggested in field and laboratory scale. For example, oxidation process with ozone or adsorption process with activated carbon has been used to remove the T&O compounds (Izaguirre et al., 1988; Lalezary et al., 1986; Yagi et al., 1988). Among the advanced drinking water treatment processes, granular activated carbon (GAC) process has been known to be effective one (Asami et al., 1999; Moll et al., 1999;
Robertson et al., 2006; Suffet et al., 1996). However its long operation results in the change of GAC process into biological activated carbon (BAC) process, where microorganisms grow on the surface of GAC and form
organic biofilms affecting the process performance. BAC process has been known to be a type of biofiltration that uses adsorption property of activated carbon and biodegradation property of microorganisms for the removal of harmful substances including T&O compounds in drinking water. Although importance of BAC in drinking water treatment process, there are less information on microorganisms forming BAC and its roles in removing T&O compounds.
The aims of this study are to identify and isolate microorganisms within BAC process and to examine their roles in removing T&O compounds. For this, BAC processes of two field plants and one pilot plant were studied in this study. Microbial community and diversity of each BAC process were investigated with colony plate method and 16S rRNA gene sequence analysis.
Furthermore the removal efficiency of geosmin by main dominant species was evaluated in batch cultivation system.
2. Materials and Methods
2.1 Materials
In this study, three GAC processes of different drinking-
water treatment plants located at Seongnam-city,
Goyang-city and Goryeong-gun were examined. The
former two plants are real ones, but the latter is a pilot-scale
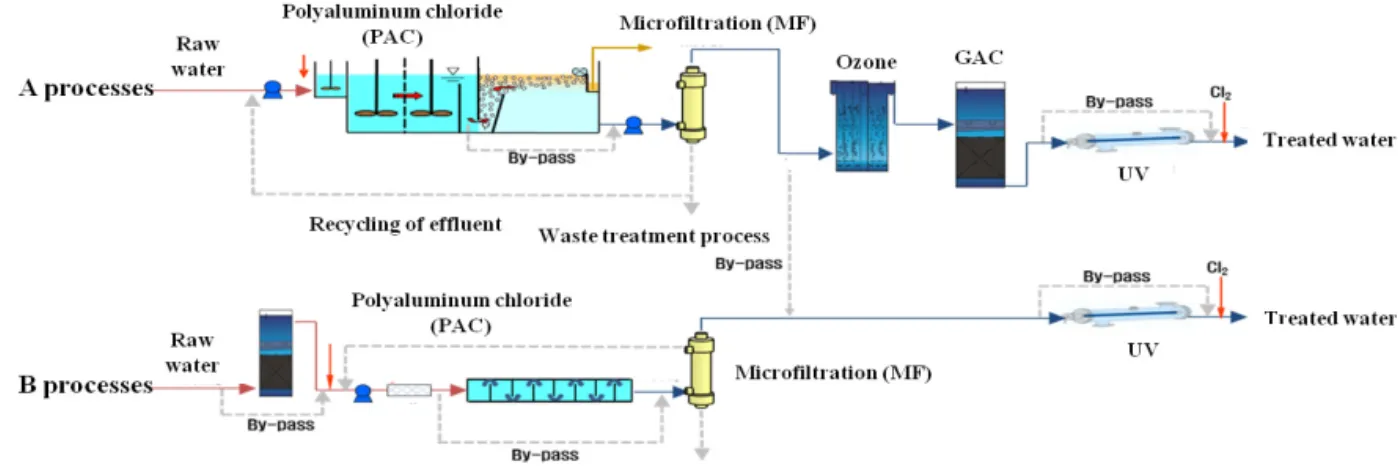
one constructed for R&D project. Fig. 1 shows a schematic
diagram of the pilot plant composed of coagulation,
microfiltration, ozonation, GAC and UV parts. Table 1
shows the characteristics of original activated carbons
used in the three GAC processes. The GAC processes
were changed into BAC processes through long operation
Fig. 1. A schematic diagram of Goryeong pilot plant.
over 2 years, 5 years and 6 months, respectively. BAC samples were sampled at 50 cm below the surface layer of the GAC parts in March 2014. R2A agar was purchased from Difco Laboratories (Difco, Detroit, MI, U.S.A.).
5% CHELEX-100 (Bio-Rad Laboratories, Hercules, CA, U.S.A.) was used for DNA extraction.
2.2. Isolation of microorganisms attached on GAC
For the isolation of microorganisms attached on GAC, 1 g of activated carbon sampled was added to a sterile 14 mL round bottom tubes containing 10 mL of 0.85%
NaCl solution. Ultrasonication (20 kHz, 180 w, 2 min) was delivered to the suspension using a XL2020 ultrasonic liquid processor (heat systems INC, Plainview, NY, U.S.A.). Suspensions (1 mL) were serially diluted in 0.85%
NaCl solution and 100 μL of each suspension was spread on a R2A agar and incubated at 37˚C for 5 days. The biomass of the attached microorganism from the BAC was detected by plate count method. The plates with 30 to 300 colony forming units (CFU) were calculated in triplicates.
2.3 DNA extraction method
To isolate single microorganism, the morphologically different colonies were separated. Each colony was cultured in brain heart infusion (BHI) broth (Difco, Detroit, MI, U.S.A.) at 37˚C for 24 hours. The medium was centrifuged at 13,000 g for 5 min and the supernatant
was discarded. For DNA extraction, boiling method was used with 5% CHELEX solution. After boiling and being centrifuged at 17,949 g in an Eppendorf 5417 R centrifuge for 5 min, supernatant was collected for further procedures.
2.4 Polymerase chain reaction (PCR) amplification and DNA purification
The DNA from the BAC was used as template for PCR amplification of the 16S ribosomal RNA gene (16S rRNA gene). Final volume of 20 μL reaction mixture contained, approximately, 100 ng of the DNA from the BAC samples, 10 pmol of bacteria-specific 16S rRNA gene primers 27F/1492R (1 μL/1 μL), 1 U of prime Taq DNA polymerase, 0.5 mM of dNTPs, 4 mM MgCl
2and 2x reaction buffer (Genetbio, Cheon-an, South Korea).
Primer sequences are as follows: 27F; 5'-AGA GTT TGA
TCC TGG CTC AG-3', 1492R; 5'- GGT TAC CTT GTT
ACG ACT T-3'. The PCR program consisted of an initial
denaturation at 94˚C for 5 min, 25 reaction cycles of
30 sec denaturation, 45 sec annealing at 55˚C and 90 sec
polymerization at 72˚C, followed by an additionally 7
min polymerization at 72˚C. The amplified DNA fragments
were electrophoresed in a 1.0% agarose gel, visualized
ethidium bromide (EtBr) staining and purified from the
agarose gel using a Labopass PCR purification kit
(Cosmogenetech, Seoul, South Korea) and then 16S rRNA
gene sequence analysis were analyzed by Genotech
(Daejeon, South Korea).
2.5 Identification of microorganisms by 16S rRNA gene sequence analysis
Identification of microorganisms was confirmed by analyzing sequence of the 16S rRNA gene using the Basic Local Alignment Tool (BLAST) supported by National Center for Biotechnology Information (NCBI).
2.6 Geosmin removal efficiency by dominant microorganisms isolated from BAC process Three dominant species from each BAC process in the three water treatment plants were prepared for the following batch cultivation experiments. Each species of 1.0 × 10
8CFU/mL was inoculated into mineral salts medium (MSM) containing geosmin (3 μg/L) as a sole carbon source in 150 mL bottle. MSM is composed of ammonium nitrate 0.1%, dipotassium phosphate 0.1%, magnesium sulfate 0.05%, and potassium chloride 0.02%
and adjusted to pH 7.0. To investigate the removal efficiency of geosmin, the bottles were incubated at 30˚C for 8 days in shaking incubator. Geosmin was analyzed by a gas chromatography-mass spectrometry equipped with a mass selective detector coupled to a solid phase microextraction (SPME-GC/MS). The growth rate of the dominant species was calculated by plate count method in triplicates.
2.7. Statistical analysis
Experimental data were collected from three independent experiments and average values were used in the tables and figures. Student’s t-test of the experiment data indicated that there was not significant effect (p-value
>0.05).
3. Results and Discussion
3.1 Microbial diversity and community structure of BAC process
Currently, a common problem in drinking water industry is the production of T&O compounds (Ho et al., 2007).
Geosmin is one of the musty odor components in water, which is a matter of great interest and also a threat to the fish farming industry (Ho et al., 2002). Nevertheless, geosmin is hardly eliminated by conventional water treatment processes (Gerber and Lechevalier, 1965).
Among advanced water treatment processes, BAC is most commonly used to solve this problem (Bruce et al., 2002;
Izaguirre et al., 1982; Meng and Suffet, 1997; Robertson et al., 2006; Young et al., 1996). In this study, three BAC processes were examined in the view point of microbiology.
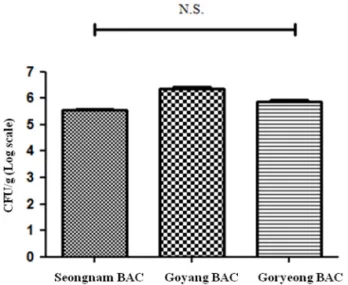
Plate counting method was used to determine the concentrations of microorganisms within the BAC processes of different water treatment plants. As shown in Fig. 2, more amounts of microorganisms existed within in the BAC process of Goyang drinking water treatment plant; the order was Goyang plant (2.2×10
6CFU/g) >
Goryeong pilot plant (7.0×10
5CFU/g) > Seongnam plant (3.5 ×10
5CFU/g). Goyang plant has been operated longer than Seongnam plant; the former was 5 years and latter 2 years. It is well known that long operation of GAC results in the change of it into BAC since surface waters such as river or lake water contains enough nutrients for various microorganisms to grow (Li AYL and Digiano FA, 1983; Reasoner DJ and Geldreich EE, 1985; Velten S et al,. 2011). Finally, it could be confirmed that GAC was naturally changed into BAC due to microbial growth on its surface as time passes.
Fig. 2. Concentration of microorganisms within BAC processes
of various drinking water treatment plants.
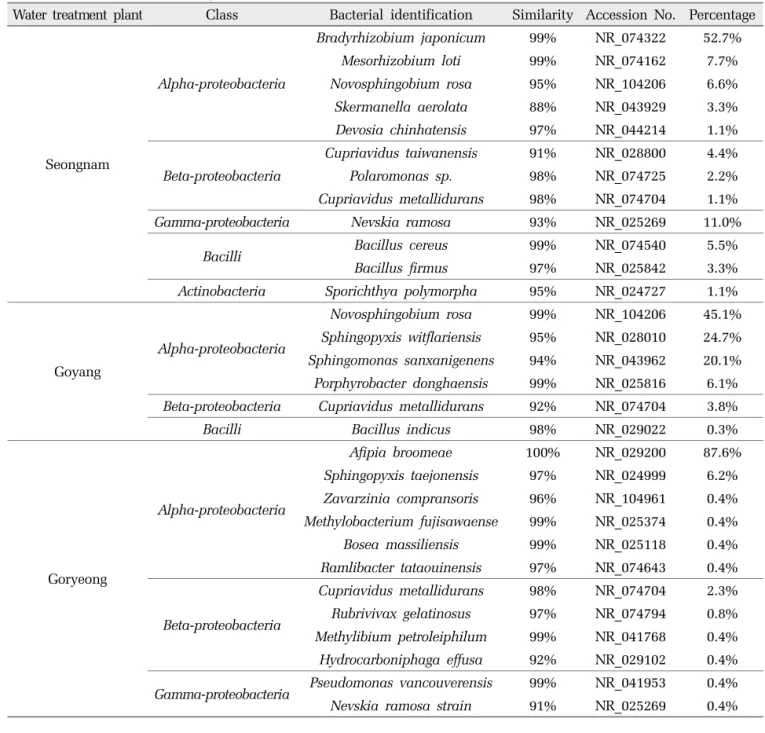
Water treatment plant Class Bacterial identification Similarity Accession No. Percentage
Seongnam
Alpha-proteobacteria
Bradyrhizobium japonicum
99% NR_074322 52.7%Mesorhizobium loti
99% NR_074162 7.7%Novosphingobium rosa
95% NR_104206 6.6%Skermanella aerolata
88% NR_043929 3.3%Devosia chinhatensis
97% NR_044214 1.1%Beta-proteobacteria
Cupriavidus taiwanensis
91% NR_028800 4.4%Polaromonas sp.
98% NR_074725 2.2%Cupriavidus metallidurans
98% NR_074704 1.1%Gamma-proteobacteria Nevskia ramosa
93% NR_025269 11.0%Bacilli Bacillus cereus
99% NR_074540 5.5%Bacillus firmus
97% NR_025842 3.3%Actinobacteria Sporichthya polymorpha
95% NR_024727 1.1%Goyang
Alpha-proteobacteria
Novosphingobium rosa
99% NR_104206 45.1%Sphingopyxis witflariensis
95% NR_028010 24.7%Sphingomonas sanxanigenens
94% NR_043962 20.1%Porphyrobacter donghaensis
99% NR_025816 6.1%Beta-proteobacteria Cupriavidus metallidurans
92% NR_074704 3.8%Bacilli Bacillus indicus
98% NR_029022 0.3%Goryeong
Alpha-proteobacteria
Afipia broomeae
100% NR_029200 87.6%Sphingopyxis taejonensis
97% NR_024999 6.2%Zavarzinia compransoris
96% NR_104961 0.4%Methylobacterium fujisawaense
99% NR_025374 0.4%Bosea massiliensis
99% NR_025118 0.4%Ramlibacter tataouinensis
97% NR_074643 0.4%Beta-proteobacteria
Cupriavidus metallidurans
98% NR_074704 2.3%Rubrivivax gelatinosus
97% NR_074794 0.8%Methylibium petroleiphilum
99% NR_041768 0.4%Hydrocarboniphaga effusa
92% NR_029102 0.4%Gamma-proteobacteria Pseudomonas vancouverensis
99% NR_041953 0.4%Nevskia ramosa strain
91% NR_025269 0.4%Table 2. Distribution of microorganisms isolated from various BACs To analyze the microbial community of the BAC
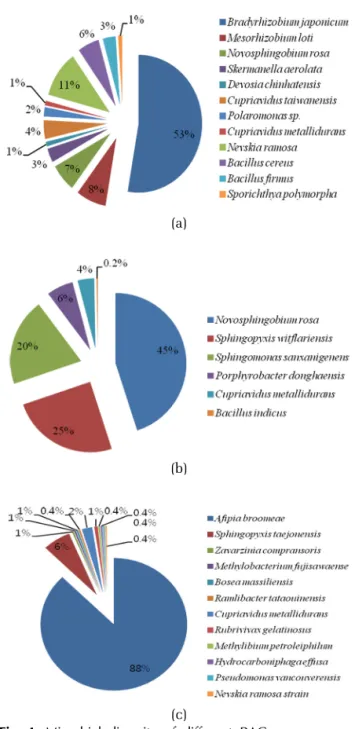
processes, we isolated and identified the microorganisms attached on GAC by using 16S rRNA gene sequence analysis. Table 2 shows the distribution of microorganisms isolated from each BAC process. Various microorganisms existed on each BAC process. In total 12 types of strains were identified, which belonged to proteobacteria, bacilli and actinobacteria respectively. As shown in Fig. 3 and 4, alpha-proteobacteria was main microorganisms in the 3 different BAC processes, but their diversity and
community were different and independent on each process. In Seongnam plant, Bradyrhizobium japonicum (52.7%), Nevskia ramose (11.0%) and Mesorhizobium loti (7.7%) were main microorganisms. Novosphingobium rosa (45.1%), Sphingopyxis witflariensis (24.7%), Sphingomonas sanxanigenens (20.1%) were main microorganisms in Goyang plant. Proteobacteria were only identified in Goryeong pilot plant, where Afipia broomeae (87.6%) and Sphingopyxis taejonensis (6.2%) were main ones.
The Goryeong pilot plant was operated for short period
Fig. 3. Phylogenetic class of microorganisms isolated from different BAC.
(A: Seongnam plant; B: Goyang plant; C: Goryeong pilot plant)
(a)
(b)
(c)
Fig. 4. Microbial diversity of different BAC processes.
(6 months) compared to other two plants (over 2 years).
The reason that bacilli and actinobacteria were not detected in the Goryeong pilot plant might be due to the short operation period of it. Diversity in the microbial community of the three plants might be due to the influences of various factors including raw water source, activated carbon type and geological aspects. There have been many studies about the presence of alpha- proteobacteria dominantly in drinking water biofilter (Herzberg et al., 2003). Liao XB et al. (2012 and 2013) reported the existence of alpha-proteobacteria, gamma- proteobacteria and acidobacteria within the surface layer of BAC filters in drinking water treatment plant. Previous research studies have also shown that the microbial community structure in BAC may be influenced by the carbon substrates, the availability of nutrients as well as the operational conditions and water quality, so that the results may be different even by BAC process efficiency (Fonseca et al., 2001; Kihn et al., 2002; Liao XB et al., 2013; Yapsakli and Cecen, 2010).
3.2 Biodegradation of geosmin by the dominant species isolated from BAC process
In this study, three bacteria species (Bradyrhizobium japonicum, Novosphingobium rosa and Afipia broomeae) existed dominantly within the different plants. It could be presumed that these bacteria played an important role in the biodegradation of geosmin. Thus we examined the cultivation of them with a MSM containing geosmim which was a sole carbon source. As shown in Fig. 5, all of the species could grow with geosmin as carbon source, but growth rate of them were different. The growth range of Bradyrhizobium japonicum was 3.9×10
5CFU/mL when cultured for 24 hours and from 1.2×10
6CFU/mL to 2.0×10
6CFU/mL when cultured for 48~192 hours (Fig.
5A). The growth range of Novosphingobium rosa was
5.0×10
5CFU/mL when cultured for just 48 hours and
from 1.2×10
6CFU/mL to 3.4×10
6CFU/mL when cultured
for 96~192 hours (Fig. 5B). The growth range of Afipia
broomeae was 3.0×10
5CFU/mL in cultured for just 48
hours and from 3.1×10
5CFU/mL to 4.1×10
5CFU/mL
(a)
(b)
(c)
Fig. 5. Growth curves of the dominant species isolated from different BAC processes.
(A: Bradyrhizobium japonicum isolated from Seongnam plant; B: Novosphingobium rosa isolated from Goyang plant; C: Afipia broomeae isolated from Goryeong pilot plant)
when cultured for 96~192 hours (Fig. 5C). These results meant that the growth of the three species were different depending on their enzyme activity which utilizes the geosmin as carbon source. It was interesting that Bradyrhizobium japonicum could grow in the MSM without any carbon source including geosmin, but its growth rate was low relatively. It has been known that this species can be cultured in inorganic nutrient solution (Guttman L and van Rijn J., 2012; Lorite MJ et al., 2000;
Sachiko Masuda et al., 2010).
Fig. 6 shows the removal efficiency of geosmin by the three species. Bradyrhizobium japonicum, Novosphingobium
(a)
(b)
(c)