∙ Received: June 27, 2011. Accepted: July 5, 2011.
∙ Corresponding author: Se Moon Oh
Department of Nuclear Medicine, Seoul National University Hospital 101 Daehang-ro, Jongno-gu, Seoul, 110-744, Korea
Tel: +82-2-2072-3937, Fax: +82-2-747-0208 E-mail: [email protected]
Original Article
저선량에서의 TrueX 재구성 방법에 의한 유용성 평가서울대학교병원 핵의학과
오세문⋅김계환⋅김승정⋅이홍재⋅김진의
The Evaluation of TrueX Reconstruction Method in Low Dose
Se Moon Oh, Kye Hwan Kim, Seung Jeong Kim, Hong Jae Lee and Jin Eui Kim Dept. of Nuclear Medicine, Seoul National University Hospital, Seoul, Korea
Purpose: Recently in diagnostics area PET/CT is using a variety of areas including oncology, as well as in cardiology, neurology, etc. While increasing in the importance of PET/CT, there are various researches in the image quality related to reconstruction method. We compared and tested Iterative 2D Reconstruction Method with True X Reconstruction method by Siemens through phantom experiment, so we can see increasing of clinical usefulness of PET/CT. Materials and Methods: We measured contrast ratio and FWHM due to evaluating images on dose and experiment using Biograph 40 True Point PET/CT (Siemens, Germany). Getting a result of contrast ratio and FWHM, we used NEMA IEC PET body phantom (Data Spectrum Corp.) and capillary tube. We used the current TrueX and the previous Iterative 2D algorithm for all images which have 10 minutes long. Also, a clinical suitability of parameter for Iterative 2D and a recommended parameter by Siemens for True X are applied to the experiment. Results: We tested FWHM using capillary tube. As a result, TrueX was less than Iterative 2D. Also, the differences of FWHM get bigger in low dose. On the other hand, we tested contrasts ratio using NEMA IEC PET body phantom. As a result, TrueX was better aspect than Iterative 2D.
However, there was no difference in dose. Conclusion: In this experiment, TrueX get higher results of contrast ratio and spatial resolution than Itertive 2D through experiment. Also, in the reconstruction result through TrueX, TrueX had better aspect of resolution than Iterative 2D in low dose. However, contrast ratio had no specific difference. In other words, TrueX reconstruction method in PET/CT had higher clinical value in use because TrueX can reduce exposure of patient and had a better quality of screen. (Korean J Nucl Med Technol 2011;15(2):83-87)
Key Words : Iterative 2D, TrueX, spatial resolution, FWHM, PET/CT
서 론
최근 진단분야에서 PET/CT는 종양학 분야는 물론 심장, 신경 등 여러 가지 분야에서 널리 활용되고 있다.1) PET/CT 의 중요성이 높아짐에 따라 보급이 활발해지고 있고 영상의 질을 향상시키기 위해 1960년대 후반부터 현재까지 영상의 재구성에 관한 연구가 활발히 진행되고 있다.2) 이 중 Siemens
사에서 개발된 Iterative 방식의 재구성 기법인 TrueX는 원형 으로 생긴 검출기의 특성상 생기는 잘못된 LOR의 위치를 Point Spread Function (PSF)을 이용하여 영상의 왜곡을 보정 해주는 특징이 있다. 본 논문에서는 Lu (Lutetium)을 기반으 로 한 검출기와 관련된 기준이 추가된 NEMA STANDARD NU 2-20073,4)에 따라 TrueX 재구성 방법과 기존에 사용하던 Iterative 2D 재구성 기법을 phantom 실험을 통해 대조도와 분해능을 비교하였고, 선량이 적어질수록 두 가지 재구성 기 법이 어떠한 차이점을 보이는지 비교하면서 TrueX의 특징을 알아보고자 하였다.
Table 2. CT and PET reconstruction paremeters
CT 120 kVp, 170 mAs (ref), collimation: 1.2 mm, Rotation time: 0.5 s, Pitch: 0.8 PET (Iterative 2D) Image size: 168x168, Iteration: 4, Subsets: 8, Filter: Gaussian (5 mm)
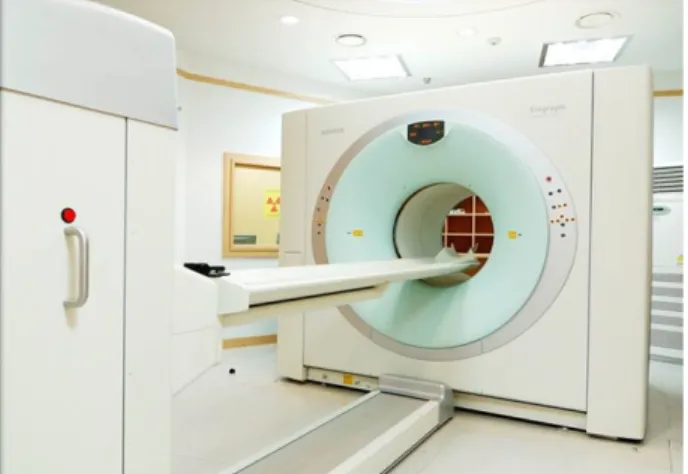
PET (TrueX) Image size: 168x168, Iteration: 3, Subsets: 21, Filter: Gaussian (5 mm) Fig. 1. Biograph 40 True-point used in this study
Fig. 2. NEMA IEC PET body phantom which consists of 6 spheres used in this study.
Fig. 3. capillary tube used to estimate FWHM.
Table 1. Specification of Biograph 40 True-point (Siemens) Detector marterial LSO (Letetium Oxyorthosilicate) Detector demension (mm) 4×4×20
PMT per Block 2×2
Block per ring 48
Number of ring 52
Number of Block 192
Number of PMT 768
Detector per ring 8112
Number of detector 32448
Axial FOV (mm) 21.6
Transaxial FOV (mm) 605
Ring diameter (mm) 842
실험재료 및 방법
1. 실험재료
영상의 분석을 위해 IEC body phantom과 1.2 mm 직경의 capillary tube를 사용하였고, NEMA STANDARD NU 2 2007을 기준으로 contrast ratio와 FWHM을 선량에 따라 비 교하였다. 영상은 본원에서 사용하는 Biograph 40 True- point를 이용하여 획득하였고 기본 사양은 Table 1.과 같다 (Fig. 1).
2. 방법
FWHM을 구하기 위해 1.2 mm의 capillary tube를 이용하
였고 contrast ratio를 구하기 위해 IEC body phantom의 37 mm 열소(hot sphere)를 이용하였다(Fig. 2, 3). 각각의 선량에 따른 영상을 분석하기 위해서 F-18을 capillary tube에 120, 100, 80, 60, 40, 20 μCi를 투여하여 FWHM을 구하였고, IEC body phantom에 3, 2.5, 2, 1.5, 1 mCi씩 투여해 열소와 배후 방사능비의 평균섭취 계수비가 9:1이 되도록 모형을 제작하 여 contrast ratio를 구하였다. CT의 조건은 재구성 방법에 관 계없이 동일하게 주었고, PET의 조건은 본원에서 사용하고 있는 Iterative 2D와 Siemens사에서 권고하는 TrueX의 parameter를 사용하였다.
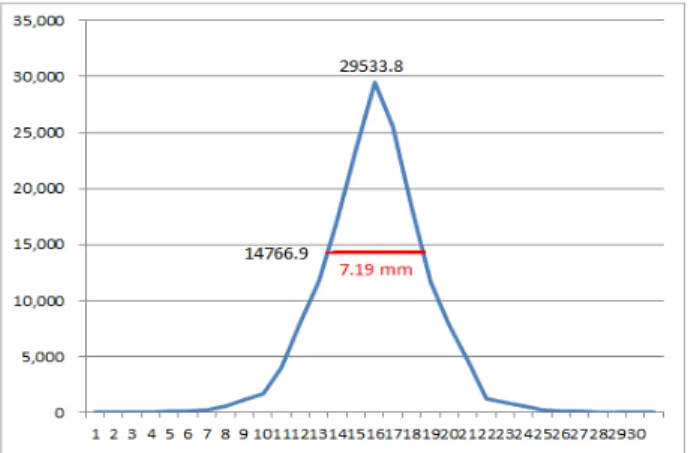
Fig. 4. The profile showed estimation of FWHM.
<Percent contrast for each hot sphere j>
Fig. 5. The formula represented contrast ratio.
Fig. 6. The different results of FWHM for Iterative 2D and
TrueX are shown. Fig. 7. The Curves of contrast ratio for Iterative2D and TrueX are shown.
3. 분석 1) FWHM 측정
NEMA STANDARD NU 2-2007에 따라 1.2 mm의 capillary tube를 이용해 영상을 획득한 후 MRIcro를 이용해 프로파일을 아래 그림과 같이 구하였다. 그리고 counts가 가 장 높을 때의 1/2값에서 반치폭을 계산하여 각각 선량(120, 100, 80, 60, 40, 20 μCi)에서의 FWHM을 Iterative 2D와 TrueX 방식을 이용해 비교 분석하였다.
2) Contrast ratio 측정
NEMA IEC body phantom의 배후방사능과 열소의 비를 1:9로 하여 37 mm의 열소와 배후방사능을 측정하였다. 그리 고 Philips사의 Skylight를 이용하여 열소의 관심영역과 배후 방사능의 관심영역을 동일한 크기로 설정하였다. 배후방사 능은 앞뒤 4슬라이스를 포함한 24개의 관심영역의 평균을 구 하였고 Iterative 2D와 TrueX 방식을 이용해 contrast ratio를 다음과 같은 수식으로 계산하였다(Fig. 5).
결 과
1. 분해능 비교
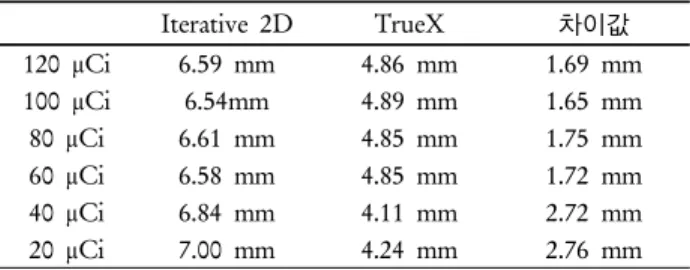
Capillary tube를 사용하여 FWHM을 측정한 결과 Iterative 2D로 재구성을 했을 때 6.5-7 mm로 나타났고, TrueX 재구성 방법에서는 4-4.5 mm가 나타났다(Fig. 6). 따 라서 TrueX 방식이 Iterative 2D 방식보다 1.7-2.8 mm 정도 적게 나타났다. 그리고 두 가지 방식을 선량에 따라 비교했 을 때 투여된 선량이 줄어들수록 FWHM의 차이가 커졌다.
Table 3. Diffrence values depend on dose in FWHM
Iterative 2D TrueX 차이값
120 μCi 6.59 mm 4.86 mm 1.69 mm
100 μCi 6.54mm 4.89 mm 1.65 mm
80 μCi 6.61 mm 4.85 mm 1.75 mm
60 μCi 6.58 mm 4.85 mm 1.72 mm
40 μCi 6.84 mm 4.11 mm 2.72 mm
20 μCi 7.00 mm 4.24 mm 2.76 mm
Table 4. Diffrence values depend on dose in contrast ratio
Iterative 2D TrueX 차이값
3 mCi 91.10 % 97.81 % 6.71 %
2.5 mCi 86.19 % 91.57 % 5.39 %
2 mCi 85.80 % 92.42 % 6.62 %
1.5 mCi 86.55 % 92.05 % 5.50 %
1 mCi 88.96 % 95.53 % 6.57 %
3. Contrast ratio 비교
IEC body phantom을 이용해 TrueX와 Iterative 2D 방식 으로 재구성을 한 결과 Iterative 2D 방식에서는 85-91%의 비율을 나타냈고 TrueX에서는 91-97%의 비율이 나타났다 (Fig. 7). Contrast ratio는 TrueX 재구성법이 Iterative 2D 방 식보다 5.4-6.7% 높게 나왔다. 그리고 선량에 따라 비교했을 때는 두 가지 재구성 방법에 따라 특별한 차이점이 나타나지 않았다.
결론 및 고찰
새로 도입된 TrueX 재구성 방법과 기존에 사용하던 Iterative 2D의 비교를 통해 TrueX의 특성을 알아보고자 했 다. Contrast ratio는 TrueX로 재구성했을 때 91-97%가 나타 났고Iterative 2D로 재구성했을 때는 85-91%가 나타났다.
TrueX로 재구성 했을 때 Iterative 2D로 재구성했을 때 보다 5.4-6.7% 높아졌다. 하지만 선량과 관련된 특별한 변화는 나 타나지 않았다. 그리고 FWHM은 TrueX로 재구성한 영상이 4-4.5 mm, Iterative 2D로 재구성했을 때 6.5-7 mm가 나타났 다. TrueX로 재구성했을 경우에는 Iterative 2D로 재구성했 을 때 보다 1.5-2.8 mm 감소되어 나타났고 TrueX와 Iterative 2D의 FWHM은 선량에 따른 변화를 나타냈다. Contrast ratio와 spatial resolution 측면에서는 TrueX의 영상이 더 우 수하게 나타났고 투여된 선량이 낮을수록 Iterative 2D로 재 구성한 영상보다 좋은 영상을 구현해 냈다. 즉 TrueX로 재구 성했을 때 환자피폭의 절감이 가능하고 Iterative 2D로 재구 성했을 때 보다 우수한 영상을 구현할 수 있었다. 하지만 uniformity, SUV (standard uptake value) 등 PET/CT의 영상 을 평가하는 기준들을 모두 비교해보기는 어려움이 있었고 단순히 phantom으로의 실험만을 해보았다는 한계점이 있었 다. 이 연구 외에도 TrueX에 대한 여러 가지 실험이 더해진 다면 임상적으로 유용하게 사용될 것이라 사료된다.
요 약
최근 진단분야에서 PET/CT는 종양학 분야뿐만 아니라 심장 신경 등 여러 가지 분야에서 널리 활용되고 있다.
PET/CT의 중요성이 높아지면서 영상의 질과 관련된 재구성 방법에 대한 연구도 활발히 진행되고 있다. 이 중 Siemens사 의 TrueX 재구성 방법을 phantom 실험을 통해 Iterative 2D 재구성 방법과 비교 평가하여 임상적 유용성을 높이고자 하 였다.
선량에 따른 영상을 비교 평가하기 위해 contrast ratio와 FWHM을 측정하였고 Biograph 40 True Point PET/CT (Siemens, Germany)를 사용하여 실험을 실시하였다.
Contrast ratio를 구하기 위해 NEMA IEC PET body phantom (Data Spectrum Corp.)을 이용하였고, FWHM을 측 정하기 위해 capillary tube를 사용하였다. 모든 영상은 10분 씩 획득하였고, 영상 재구성은 현재 사용하고 있는 TrueX와 기존에 사용하던 Itertive 2D 알고리즘을 사용하였다.
Iterative 2D는 임상에 적합한 parameter 조건을 적용하고 TrueX는 Siemens에서 권고하는 parameter를 적용하여 실험 하였다.
Capillary tube를 사용하여 FWHM을 측정한 결과, TrueX 가 Iterative 2D 방식보다 낮게 나왔다. 저선량일수록 FWHM의 차이가 점점 커졌다. NEMA IEC PET body phantom을 사용하여 contrast ratio를 구한 결과, TrueX가 Itertive 2D보다 좋은 양상을 보였다. 그러나 선량에 따른 차 이는 보이지 않았다.
본 연구에서는 영상 분석을 통해 TrueX가 Itertive 2D보다 contrast ratio와 spatial resolution이 높게 나타났다. 또한 TrueX를 통한 재구성 결과 저선량일수록 기존의 Iterative 2D보다 resolution은 좋은 양상을 보였고 contrast ratio는 큰 변화를 보이지 않았다. 즉 PET/CT에서 TrueX 재구성 기법 이 환자의 피폭도 절감하고 질적으로 우수한 영상을 구현할 수 있어 임상적 이용가치가 높다고 생각된다.
REFERENCES
1. J E Ortuno, G Kontaxakis, J L Rubio, P Guerra and A Santos Efficient methodologies for system matrix modelling in iterative image reconstruction for rotating high-resolution PET. phys Med Biol 2010;55:1833-1861
2. Adam Alessio, PhD. and Paul Kinahan, PhD. PET Image Reconstruction. Nuclear Medicine 2nd Ed 1-22
3. Gopal B. Saha Basics of PET Imaging. 2010;97-116
4. National Electrical Manufacturers Association, NEMA Standards publication NU 2-2007: performance measurements of positron emission tomographs. 2007;1-29