∙Received: March 28, 2014. Accepted: April 21,2014.
∙Corresponding author : Young Kag Bahn
Department of Nuclear Medicine, Yonsei University Health System, 50 Yonsei-ro, Seodaemun-gu, Seoul 120-752, Korea
Tel: +82-2-2228-6056, Fax: +82-2-312-0578 E-mail: [email protected]
Original Article 90
Y SIR-Spheres를 사용한 암의 간 전이치료에서 PET
영상획득에 관한 초기연구
연세의료원 세브란스병원 핵의학과1, GE Healthcare Korea Molecular Imaging Team2 반영각1⋅오신현1⋅김정열1⋅이승재1⋅박준영1⋅신희순2⋅임한상1⋅김재삼1
Assessment of Acquisition Protocols for
Post-Radioembolization Yttrium-90 PET/CT: Initial Study
Young Kag Bahn1, Shin Hyun Oh1, Jung Yul Kim1, Seung Jae Lee1, Joon Young Park1, Heui Soon Shin2, Han Sang Lim1 and Jae Sam Kim1
1Department of Nuclear Medicine, Yonsei University Health System, Seoul, Korea
2MI Team, GE Healthcare Korea, Seoul, Rep. of Korea
Purpose: We investigated the quantitative evaluation of PET/CT images for evaluation after treatment in the treatment of liver metastasis of cancer with 90YSIR-Sphere. Materials and Methods: Confirmed the correlation between the measured counts was expressed by setting a region of interest from the image and a measure of the dose calibrator to see a correlation diagram of an image in a PET of 90Y. A portion uptake coefficients between PET images were acquired for 20 minutes LIST mode in 15 patients treated for liver metastasis of cancer using 90Y SIR-Spheres high, intermediate portion, a lower portion, three measuring the coefficient of the region of interest is divided into parts, we studied the conditions for proper image acquisition. Results:
Coefficient of sites that set the region of interest of the PET image and the measured counts of
90Yappears that there is a correlation diagram statistically, (R2=0.956), correlation diagram from the PET image of 90Yis, PET coefficient the coefficients of all regions of interest were increased in proportion to the image acquisition time, partial ROI coefficients of the PET image is higher about 10 minutes on average, about 14 minutes on average, the central portion is lower part 19 minute average in, confirmed the equilibrium of the standard deviation. Conclusion: Using the isotope 90Y, it is suitable to obtain a PET image, to obtain the time of proper image, the evaluation of PET/CT images, using the 90Y SIR-Spheres and that in the treatment of liver metastases of cancer, it is useful for assessing treatment. (Korean J Nucl Med Technol 2014;18(1):89-93) Key Words : 90Y, 90Y SIR-Sphere, HCC, PET/CT
서 론
90Y SIR-Sphere을 이용한 암의 간 전이 치료 시술은 혁신 적으로 카테터를 이용하여 간 질환 부위에 직접 투여하여
90Y에서 방출하는 베타 방사선을 이용하여 암 조직을 궤사
시키는 것이다.1-3) 효과적인 치료 계획을 위하여 종양 주위 의 혈관들을 색전시키고, 99mTc-MAA 를 이용하여 색전 부 위가 누출되는 곳은 없는 지 파악한다.4,5) 99mTc-MAA감마 영상의 간과 폐의 섭취 비를 이용한다. 확인된 후 질환 부 위에 90Y SIR-Sphere 를 치료 선량에 맞게 조절하여 카테터 를 이용 혈관조영촬영실에서 주입한다. 이렇게 치료가 이 루어지는데, 치료 후 평가나 투여 부위의 확인은 과거 99.99% β-선을 방출하는 90Y의 제동선을 활용하여 감마 영 상이나 단일광자단층촬영을 이용하여 영상으로 확인하였 다. 하지만, 90Y의 34ppm의 β+선의 방출 사실이 발견되었 다. 그래서, β+선의 소멸 복사 현상을 이용한 양전자방출단
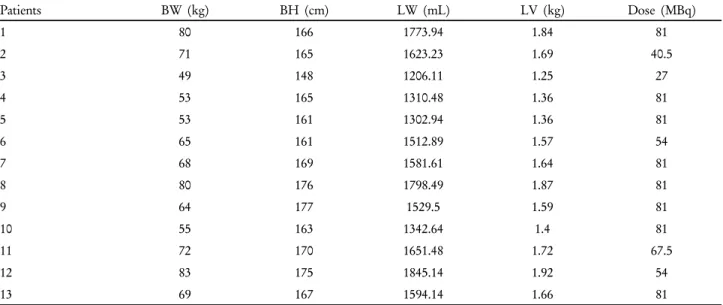
Table 1. Using 90Y SIR-Spheres in cancer patients with liver metastases treated with 15 peoples of the volume and the height and weight Liver weight and administered dose of 90Y
Patients BW (kg) BH (cm) LW (mL) LV (kg) Dose (MBq)
1 80 166 1773.94 1.84 81
2 71 165 1623.23 1.69 40.5
3 49 148 1206.11 1.25 27
4 53 165 1310.48 1.36 81
5 53 161 1302.94 1.36 81
6 65 161 1512.89 1.57 54
7 68 169 1581.61 1.64 81
8 80 176 1798.49 1.87 81
9 64 177 1529.5 1.59 81
10 55 163 1342.64 1.4 81
11 72 170 1651.48 1.72 67.5
12 83 175 1845.14 1.92 54
13 69 167 1594.14 1.66 81
층촬영을 이용하여 영상획득을 확인하게 되었다.6,7) 그래서 최근 임상에서 많이 시도되고 있는90Y SIR-Sphere 에 대해 양전자방출단층촬영 영상 획득의 연관도를 확인하고, 90Y SIR-Sphere 를 사용한 암의 간 전이 치료에서 치료 후 평가 를 위한 PET/CT 영상에 대한 적정 영상 획득 시간을 임상 적으로 초기 단계에서 연구해 보고자 하였다.
실험재료 및 방법
방사성동위원소는 SIR-Sphere®, microspheres SIR-Y001 (Sirtex Medical, Australia)를 사용하였다. 그리고 PET/CT 스캐너는 GE사의 Discovery 600s (GE Healthcare, U.S.A) 장비를 사용하였다. 90Y의 방사선량을 측정하기 위한 계수 기는 CRC-25 PET (CAPINTEC, INC.) Dose calibrator를 사용하였다.
1. 90Y과 PET/CT의 상관도
90Y의 PET에서의 영상의 상관도를 보기 위해 Dose cali- brator 의 측정치와 영상에서 관심영역을 설정하여 나타낸 총 계수와의 상관도를 확인하였다. 실제 선량 측정치와 PET/
CT 스캐너에서의 측정치가 선형을 갖고 있는지 확인하여,
90Y의 선량을 PET/CT 스캐너가 비례하여 반영하는지 확인 하였다. 90Y vial을 8번에 걸쳐 측정하고, 각각 PET/CT에서 10시간 동안 영상을 획득하였다. 1139.6 MBq 로 시작하여 각 측정 및 검사 시 마다 시행하였다. PET/CT 검사 조건은
CT 120 kVp, 60 mAs로 스캔하였고, PET 영상획득은 1배 드 10시간 동안 스캔하였다. PET 영상의 재구성은 VUE point HD (Subset: 16, Iteration: 2) 를 사용하였다.
2. 90Y SIR-Spheres PET/CT 영상 획득 시간
90Y SIR-Spheres 를 사용하여 암의 간 전이 치료를 받은 15명의 환자를 대상으로 시행 하였고, 사전에 99mTc-MAA shunt 검사를 시행하여 종양 주위의 혈관을 충분히 색전 되 었는지 확인하여 시술을 진행하였다(Table 1). 혈관 조영 검 사실에서 90Y SIR-Spheres 시술을 마치고, 18시간 경과 후 PET/CT 영상을 획득하였다. 영상 획득 조건은 CT 120 kVp, 60 mAs로 스캔 하였고, 20분간 LIST mode로 PET/CT영상을 획득하였다. 영상은 1분부터 1분씩 늘려가 며 20분 스캔까지 영상을 재구성하였다. PET 영상의 재구 성 방법은VUE point HD (Subset: 16, Iteration: 2) 를 사용 하였다. 재구성된 영상에서 간 영역에서 섭취 부위의 섭취 계수가 높은 부분, 중간 부분, 낮은 부분, 세 부분으로 나누 어 관심영역의 계수를 측정하였다. 관심 영역의 측정은 GE 사의 AW 4.6 워크 스테이션을 사용하였고, 관심 영역의 크 기는 58.2 mm 로 측정하였다. 평가 방법은 각 영역의 계수 의 변화의 표준 편차, 표준 섭취 계수의 표준 편차, 20분 영 상 의 섭취 계수를 기준으로 Relative % 의 표준 편차를 이 용하였다(Table 2). 90Y의 표준 섭취 계수를 측정 시 90Y SIR- Spheres가 간 영역에 국한되어 섭취 되기 때문에 각 환자의 간의 무게를 측정하여 간에 대한 표준섭취계수를 측정하였
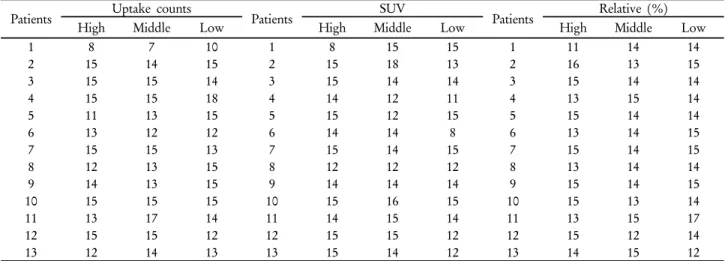
Table 2. Using 90Y SIR-Spheres in cancer patients with liver metastases treated with 15 people in PET/CT images from 1 minute to 1 mi- nute increase scan time images were obtained 20 minutes. Radiological 90Y-PET/CT uptake coefficient, SUV, Relative% of the scan time for the stabilization, respctively
Patients Uptake counts
Patients SUV
Patients Relative (%)
High Middle Low High Middle Low High Middle Low
1 8 7 10 1 8 15 15 1 11 14 14
2 15 14 15 2 15 18 13 2 16 13 15
3 15 15 14 3 15 14 14 3 15 14 14
4 15 15 18 4 14 12 11 4 13 15 14
5 11 13 15 5 15 12 15 5 15 14 14
6 13 12 12 6 14 14 8 6 13 14 15
7 15 15 13 7 15 14 15 7 15 14 15
8 12 13 15 8 12 12 12 8 13 14 14
9 14 13 15 9 14 14 14 9 15 14 15
10 15 15 15 10 15 16 15 10 15 13 14
11 13 17 14 11 14 15 14 11 13 15 17
12 15 15 12 12 15 15 12 12 15 12 14
13 12 14 13 13 15 14 12 13 14 15 12
Fig. 1. Using height and weight to obtain the weight and volume of Liver, Liver uptake coefficient calculation of SUV (Standard Uptake Value).
Fig. 2. The dose of 90 Y PET showed a correlation. The eight correlation measurements y=21.668x+4.2573, and 0.9951 is the correlation value of R2.
다(Fig. 1). 그리고 간의 무게는 한국인 표준 간 무게 측정 식을 활용하여 측정하고, 간 조직의 밀도도 반영하였다.세 개의 평가 항목에서 각 표준편차가 10% 이내로 가장 평탄 화되는 지점이 영상을 적정한 영상 획득 시간으로 평가하 였다.
결 과
1. 90Y과 PET/CT 의 상관도
90Y의 PET에서의 영상의 상관도를 보기 위해 Dose cali- brator 의 측정치와 영상에서 관심 영역을 설정하여 나타낸 총 계수와의 상관도를 확인하였다. 90Y vial을 8번에 걸쳐 측정 값과PET/CT에서의 10시간 동안 획득된 영상의 계수 를 상관도로 나타내었다. Fig. 2와 같은 그래프로 나타났고, y=21.668x + 4.2573이라는 상관식을 도출하였다. 그리고 상 관도의 R2값이 0.9951로 1과 가까워 상관도를 만족하였다 (Fig. 2).
2. 90Y SIR-Spheres PET/CT 영상 획득 시간
90Y SIR-Spheres 를 사용하여 암의 간 전이 치료를 받은 15명의 환자를 대상으로 시행 하였고 20분간 LIST mode로 PET/CT 영상을 획득하였다. 재구성된 영상에서 간 영역에 서 섭취 부위의 섭취 계수가 높은 부분, 중간 부분, 낮은 부 분, 세 부분으로 나누어 관심 영역의 계수를 측정하였다. 각 영역의 계수의 변화의 표준 편차 평가는 최소 15분 이상의 영상을 획득했을 때 계수 값의 안정화가 이루어졌고, 표준 섭취 계수의 표준 편차 평가도 최소 15분 이상 영상을 획득 했을 때 안정화가 이루어졌다. 그리고 Relative % 의 표준 편차 평가도 마찬가지로 최소 15분 이상 영상을 획득 했을 때 안정화가 이루어졌다. 섭취가 높은 영역에서의 안정화 시간이 짧게 나타났고,섭취가 낮은 영역에서는 안정화 시 간이 비교적 길게 나타났다(Table 1). 그리고 환자의 영상에 서 관심 영역 설정을 그래프로 나타내었을 때, 계수 표준
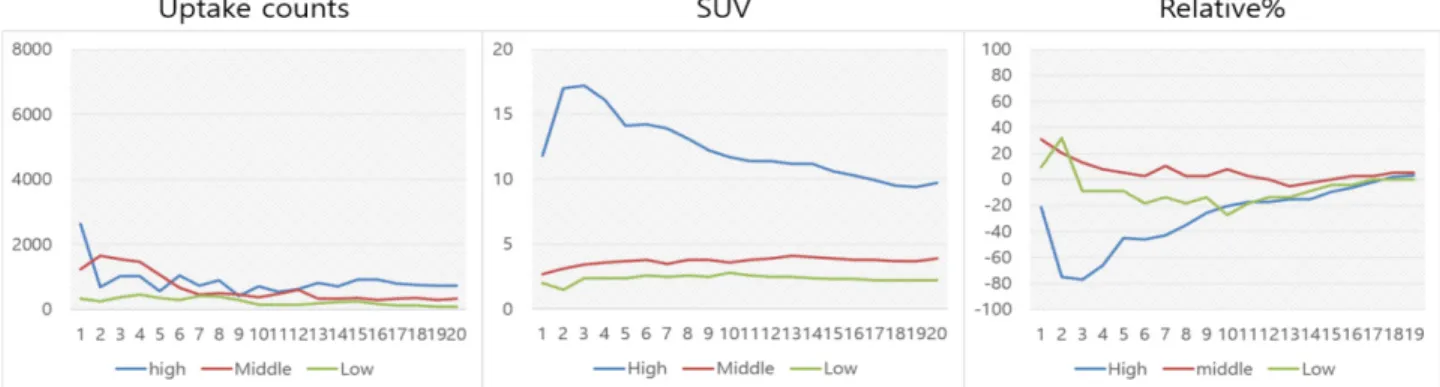
Fig. 3. Patient's PET/CT imaging increases 1 minute to 1 minute, 20 minutes to scan video images obtained by the intake of 90Y-PET/CT coefficient, SUV, Relative% of the scan time for the stabilization of the graph shown in.
Fig. 4. Two patients 90Y-PET/CT 20 min, 15 min, 10 min, 5 min acquired during the video. A, B both patients and longer acquisition time improves the quality of images that can be checked visually, less than 15 minutes, the quality of the projected image is significantly degraded.
편차, 표준 섭취 계수 표준 편차, Relative % 표준 편차 모 두 최소 15분에서 그래프 표준 편차가 10% 이내로 안정화 되는 것을 알 수 있었다(Fig. 3).
환자 A, B의 5분, 10분, 15분, 20분 PET영상에서도 육안 으로도 20분 획득 영상이 가장 영상의 질이 좋은 것을 보여 주고 있고, 15분 영상도 대체적으로 안정화 되었다(Fig. 4).
고 찰
90Y은 99.99% β-방출 방사성동위원소로 치료에 이용되 므로 그 위험성 때문에 다루기가 힘들고, 제품이 아닌 순수 한 90Y을 임상에서 찾아보기가 쉽지 않다. 그래서 본 연구 에서 팬텀 실험을 진행 할 수 없었다. 또한, 임상에서 사용 되는 PET/CT 장비로 영상화 함에 있어 18F로 표준화된 장 비에서 연구를 진행하여 선량 계수나 표준 섭취 계수의 신 뢰도에 의문이 갈 수 있다. 하지만 PET/CT장비는 유지 관 리가 정기적으로 이루어지고 있고,평가한 항목의 선량 계
수나 표준 섭취 계수 자체로 판단한 것이 아니라 표준 편차 를 이용하였기 때문에 평가 방법에 있어서는 문제가 없을 것으로 생각된다. 본 연구뿐 아니라 여러 논문에서 SIRT의 영상화뿐 아니라90Y TOF-PET/CT 영상화 연구, 90Y-SPECT/
CT와 PET/CT의 비교연구 등 여러 가지 평가가 연구 되고 있고, 치료 시 흡수 선량을 계산하여 사전에 계산된 선량이 종양에 얼마나 효과적인지 확인할 수도 있다.8-10) 추후에
90Y의 영상화에 관한 연구뿐 아니라 선량 계수, 표준 섭취 계수를 이용하여 부여 선량을 계산 한다면 치료에 큰 도움 이 될 것이다.
결 론
본 연구는 90Y이 PET에서 검사가 이루어질 수 있다는 것 을 보여 주었고, 영상화 하고 정량 분석도 할 수 있다는 것 을 보여 주었다. 90Y PET/CT 를 영상화 하는데 15분 정도 의 검사 시간이 필요로 하다는 것도 알 수 있었다. 90Y 과
A B
PET/CT 영상화에 초기 연구지만, 추가 연구로 더 심도 있 는 연구로 이어 진다면, 90Y-PET/CT를 이용하여 SIRT의 정량 분석과 정확한 평가가 이루질 것으로 사료된다.
요 약
90Y SIR-Sphere 를 사용한 암의 간 전이치료에서 치료 후 평가를 위한 PET/CT 영상에 대한 정량적 평가를 연구해보 고자 하였다. 90Y 의 PET 에서의 영상의 상관도를 보기 위 해 Dose calibrator 의 측정치와 영상에서 관심영역을 설정 하여 나타낸 측정치와의 상관도를 확인하였다. 그리고 90Y SIR-Spheres 를 사용하여 암의 간 전이치료를 받은 15명의 환자에서 20분간 LIST mode로 획득한 PET 영상에서 간의 섭취계수가 높은 부분, 중간 부분, 낮은 부분, 세 부분으로 나누어 관심영역의 계수를 측정하여 적정 영상 획득 조건 을 연구하였다. 90Y 의 PET 영상에서의 상관도는 Y-90 의 측정치와 PET영상의 관심영역을 설정한 부위의 계수는 통 계적으로 상관도가 있다고 나타났고(R2=0.956), PET 계수 는 모든 관심영역의 계수는 영상획득시간에 따라 비례하여 증가 하였다 그러나, PET 영상의 관심영역 계수가 높은 부 분은 평균 약 10분, 중간 부분은 평균 약 14분, 낮은 부분은 평균 19분에서 표준편차의 평형을 나타냈다. 90Y의 동위원 소를 이용하여 PET 영상을 획득하는데 적합하였고, PET/CT 영상 평가는 적절한 영상 시간을 획득한다면, 90Y SIR-Spheres 를 사용한 암의 간 전이치료에서 치료 후 평가 에 유용할 것이다.
REFERENCES
1. Zade AA, Rangarajan V, Purandare NC, Shah SA, Arrawal AR, Kulkarni SS, et al. 90Y microsphere thraphy: dose 90Y PET/CT imaging obviate the need for 90Y Bremsstrahlug SPECT/CT imaging? Nucl Med Commun 2013;34:1090-1096.
2. Kao YH, Steinberg JD, Tay YS, Lim GK, Yan J, Townsend DW, et al. Post-radioembolization yttrium-90 PET/CT-part 1:
diagnostic reporting. EJNMMI Res. 2013;3:56.
3. Kao YH, Steinberg JD, Tay YS, Lim GK, Yan J, Townsend DW, et al. Post-radioembolization yttrium-90 PET/CT-part 2:
dose-response and tumor predictive dosimery for resin micros- pheres. EJNMMI Res. 2013;3:57.
4. Carlier T, Eugene T, Bodet-Milin C, Garin E, Ansquer C, Rousseau C, et al. Assessment of acquisition protocols for rou- tine imaging of Y-90 using PET/CT. EJNMMI Res. 2013;3:11.
5. Zalom M, Yu R, Friedman M, Bresee C, Waxman A. FDG PET/CT as a prognostic test after 90Y radioembolization in pa- tients with metastatic hepatic disease. Clin Nucl Med 2012;37:
862-865.
6. Huang J, Cui L, Wang F, Liu Z. PET tracer based on (86)Y. Curr Radiopharm. 2011;4:122-130.
7. Bagni O, D’Arienzo M, Chiaramida P, Chiacchiararelli L, Cannas P, D’Agostini A, et al. 90Y-PET for the assessment of microsphere biodistribution after selective internal radiotheraphy.
Nucl Med Commun 2012;33:198-204.
8. Lhommel R, van Elmbt L, Goffette P, Van den Eyndo M, Jamar F, Pauwels S, et al. Feasibility of 90Y TOF PET-based dosim- etry in liver metastasis theraphy using SIR-spheres. Eur J Nucl Mol Imaging 2010;37:1654-1662.
9. Lin M, Shon IH, Wilson R, D’Amours SK, Schlaphoff G, Lin P.
Treatment response in liver metastases following 90Y SIR- spheres: an evaluation with PET. Hepatogastroenterology 2007;54:910-912.
10. Yung Hsiang Kao, Jeffrey Steinberg, Jianhua Yan, etc. Optimi- zation of Yttrium-90 processing on a clinical PET/CT system.
2011 IEEE Nuclear science symposium conference record.