Print ISSN: 2288-4637 / Online ISSN 2288-4645 doi:10.13106/jafeb.2020.vol7.no9.201
Oil Prices and Terms of Trade of Saudi Arabia:
An Empirical Analysis
Mohammad Imdadul HAQUE
1, Mohammad IMRAN
2Received: June 23, 2020 Revised: July 05, 2020 Accepted: August 10, 2020
Abstract
Terms of trade is an important indicator of the welfare gains from international trade to the exporting country. Terms of trade of oil-exporting countries are hypothesized to depend primarily on oil prices. The study assesses the relation between oil prices and the terms of trade of Saudi Arabia. The study uses the Autoregressive Distributed Lag method to determine the cointegration between the country’s terms of trade and oil prices for the period 2000-2018. The data for net barter terms of trade is taken from World Development Indicators and oil price is taken from Saudi Arabian Monetary Agency. The results show that oil prices and terms of trade are cointegrated and any disequilibrium between the two variables is corrected by 35% in a year. The study also reports a positive relationship between the two items, both in the short run and long run. Diagnostic tests indicate the model to be fit. The results suggest that, for a primarily oil-producing country like Saudi Arabia, the terms of trade depend on oil prices. The study fills the gap in the literature on the study of terms of trade for Saudi Arabia for the last few years, where there has been a high volatility in oil prices.
Keywords: Terms of Trade, Oil Prices, ARDL, Diversification, Saudi Arabia JEL Classification Code: F14, N75, O24, Q43
than one (Clarida, 1994). Russia, United Arab Emirates, and Saudi Arabia shared two-third imports of the oil-exporting countries (ECB, 2007). But after 2014 there is a significant decline in oil prices, which led to a decline in import intensity of oil-exporting countries (Hesary et al. 2013).
In its report,the World Bank (2015) finds that since 2010 the innovation in the technique of production raised the efficiency in the production and utilization of the oil worldwide. It adversely affected the price of oil. The unprecedented fall in the price of oil forced the oil-exporting economies to reconsider their economic and fiscal policies to attain a higher level of economic growth. The sharp decline in oil prices make an adverse impact on the collection of revenues and public sector spending on long term project as well as the welfare projects of the oil-exporting countries.
The factors responsible for the deterioration of the oil prices are geopolitical issues in the Middle East, sanctions against the Russian Federation, and conflicts in Sub-Saharan oil producers.
Terms of trade is an important trade-related parameter to decide the pattern of gains from trade between countries.
There are many concepts of terms of trade. This study considers net barter terms of trade as provided by World Development Indicators (WDI, 2020). It defines net barter
1. Introduction
The rise of emerging economies like Brazil, Russia, China, and India after 2000 led to a huge increase in the demand for oil (Ruta & Venables, 2012). It leads to an increase in revenue of oil-exporting countries with high current account surpluses. Though these revenues boosted the domestic economy of oil-producing countries there were issues with the absorption of these revenues into the economy as these economies are poorly diversified (Kamps
& Beck, 2009). Also, an increase in revenues led to an increase in imports. In fact, for oil-exporting countries, the elasticity of import demand with respect to income is greater
1
First Author and Corresponding Author. Associate Professor, College of Business Administration, Prince Sattam Bin Abdulaziz University, Saudi Arabia [Postal Address: Al Kharj-11942, Saudi Arabia]
Email: [email protected]
2
College of Applied Business Administration, Al Muzahmiyah Branch, King Saud University, Saudi Arabia. Email: [email protected]
© Copyright: The Author(s)
This is an Open Access article distributed under the terms of the Creative Commons Attribution Non-Commercial License (https://creativecommons.org/licenses/by-nc/4.0/) which permits unrestricted non-commercial use, distribution, and reproduction in any medium, provided the original work is properly cited.
terms of trade index as “the percentage ratio of the export unit value indexes to the import unit value indexes”. It considers 2000 as the base year. As it is an indicator of the welfare gains from international trade, favorable movements in the terms of trade lead to greater gains from trade, while unfavorable movements of terms of trade affect the gains of trade adversely. A favorable terms of trade represents an equal and proportionate increase in the export price, over the import, while the deterioration in the terms of trade represent the fall in the export price, over the imports (Debaere & Lee, 2003). Improvement in terms of trade is a significant factor for the growth of an economy (Awel, 2012).
Saudi Arabia, the country of interest for this study, is a primarily oil-centered country. It accounts for 16% of the world’s petroleum reserve and is the leading oil exporter.
The economic growth of the country depends strongly on oil revenues (Haque & Khan, 2019). The oil sector constitutes 43.21% of the total gross domestic product (GDP) in 2018.
In the same year among the total exports, oil exports are 78.67% and non-oil exports is only 21.32% (SAMA, 2018).
Oil revenues are crucial to the growth and development of the country. The terms of trade movements for Saudi Arabia are represented in Figure 1. It reached a maximum of 149.50 in 2005, but declined to 82.08 in 2016, only to recover to 115.27 in 2018. The terms of trade was lower than the base value of 2100 in the year 2000 only in 2001, 2002, 2015, and 2016 (WDI, 2020). This indicates that only in four out of the nineteen years under study, in only four years the import prices were higher than the export prices
In the year 2018, the total exports of Saudi Arabia are 1103900, while the total imports are 513993 in million Saudi Arabian Riyals. The percentage change in exports was 32.7%.The percentage of changes in imports is 1.9%.
The highest export to the region in descending order is to Asian countries (53.03%), European Union (13.42%), North America (9.64%), Gulf Cooperation Council (GCC) (9.25%) followed by others. Imports were from the following region
is descending order: Asia (31.95%), European Union (25.84%), North America (14.97%), followed by others. The commodity group with the highest import was Machinery, Mechanical Appliances, Electrical Equipment & Parts (21.62%), followed by Transport Equipment (16.46%), Products of Chemical & Allied Industries (10.06%), Base Metals & Articles of Base Metals (8.55%), and Vegetable Products (6.41%). All other import categories constituted less than 5% each SAMA, 2018).
The terms of trade of Saudi Arabia has been fluctuating along with the oil prices (Figure 1). This study identifies a gap in research on the terms of trade of oil-exporting countries particularly for Saudi Arabia over the last few years where there has been huge volatility in crude oil prices. The oil prices increase from 26.81 in 2000 to 95.86 in 2008. In 2009 it fell to 61.38. It recovered and reached 110.22 in 2012. It again fell drastically from 97.18 in 2014 to 49.85 in 2015 and further to 40.96 in 2016. By 2018 it somewhat recovered to 70.59. A similar movement is evident in terms of trade also.
This concept of terms of trade assumes added importance for Saudi Arabia as it is trying to structurally transform its economy. It launched an ambitious Vision 2030 program in 2016 to move away from oil dependence. Toward this, the study moves with the objective of studying the dependence of Saudi Arabia’s terms of trade on crude oil prices.
2. Literature Review
An increase in the oil price has a direct and positive impact on the economy of oil exporting countries where, as it puts a negative and direct impact on oil importing economies.
The consumption demand and investment demand are affected by the variation in the oil price (Ghalayini, 2011).
On the other hand, an increase in oil prices raises the cost of the production, rate of the profits and returns from the new investment, but at the same time, it raised disposable income. Since oil is major contributor to the government
20 40 60 80 100 120 140 160
2000 2002 2004 2006 2008 2010 2012 2014 2016 2018
To T OP
Figure 1: Terms of trade and oil prices
revenues of the oil-exporting countries like the Saudi Arabia, a fall in the price leads to a decline in the export revenues and the government expenditure whereas an increase in the oil price accelerates the pace of economic growth of the oil- exporting countries via export earnings and terms of trade effect (Berument et al., 2010). Therefore, it can be said that an increase in oil price has a positive and direct impact on the oil-exporting countries, while oil-importing countries have an adverse impact on their economic growth (Oriakhi
& Osaze, 2013).A positive indirect effect of the oil-exporting countries provides a scope to increase the revenues from the oil, but at the same time it also makes a room for the oil- importing countries to raise their exports to minimize their net loss (Bjornland, 2009).
In a related study, Hesary et al. (2013) found that the positive direct effect of oil price shocks on the economy of the oil-exporting countries. It means those countries who can increase the supply of the oil are in the benefit. The indirect benefits of the oil price shocks on most of the oil exporting countries are negative, economic sanctions against the Russian Federation and Iran, since 2014 is able to control exogenous shocks, maybe one of the important reasons for the low impact on the indirect benefits of the oil exporting countries. On the other hand, most of the European countries, as an importers of the oil, have registered an adverse impact of the oil prices on the GDP growth rate, while, East Asian economies are able to negotiate their imports with increasing the export to the oil-exporting countries, and they recorded a significant effect on their GDP.
Saudi Arabian and Russian economies were vulnerable after the reduction of oil prices since 2014. Despite the fall in the price of the crude oil, Saudi Arabia has an edge over Russia in the export market, because of the lower cost of production than Russia. The collapse of the Organization of the Petroleum Exporting Countries (OPEC) in 1986, the financial crisis of 2008 and again conflicts in OPEC in November 2014, created the problem for the oil-exporting countries. As a result of this oil prices drop, it makes the multiplier effects on their economy. After this event,Saudi Arabia raised the production of oil, but it fails to cover the loss of the revenues, which appeared due to the fall in the price (Bradshaw et al. 2019).
Over the last two decades, technological advancement has made extraction economical. Low oil prices facilitate supply chain linkages with oil related chemical and plastic manufacturing sector (Hojjat, 2014). Fluctuations in oil prices have both microeconomic impact and macroeconomic level. The microeconomic impacts can be felt on production costs, company earnings, dividend distribution and likewise.
The macroeconomic impacts are on exchange rate, inflation, unemployment, interest rates and overall economic growth (Echchabi & Azouzi, 2017). An increase in oil prices results in transfer of wealth to oil exporters from oil importers. Once
these oil revenues are invested in the economy it further stimulates economic growth (Parsva &Lean, 2017).
The volatility in oil prices is a big challenge for policymakers of the oil-exporting countries. The increase in the demand for oil and other commodities since 1971 forced a rise in the prices of oil.The unprecedented increase in oil revenues provides the room to increase the level of investment. But the oil-producing countries have experienced a low level of investment opportunities in the manufacturing sector. Therefore, the banks find the scope to finance import and consumer goods. The adverse effect of the oil revenues enables the inefficient use of the resources in the absence of the mature institutions, which neutralize the gain of the income from oil (Kilian, 2009).
In the analysis of the dynamics of macroeconomic variables,Rotemberg and Woodford (1996) predicted the uncertainty of the future supply of oil. The uncertainty of the future oil market and the shortage of supply affected the spot price of the oil (Alquist & Kilian, 2010). Since oil is used as an important factor of production, an increase in the oil price raises the cost of the product, which leads to creating a disturbance on the supply side of the economy. The reduction in the supply of the production of oil as an increase in the prices is refuted by Islam (2012). In another study,Santis (2003) attempted to assess the numerical quantification of the impact of demand for crude oil and supply shocks on the prices, output, profits, and welfare in Saudi Arabia. The study reveals that the simulation of the supply shocks of oil has not a great effect on the oil price. This is because short- run supply shocks are partly offset by the world and also affected the long-term marginal revenues of Saudi Arabia.
The utilization and production of unconventional oil, geopolitical risks, and an appreciation of the US dollar are important reasons for the worsening demand of crude oil at a global level, which leads to a significant policy shift of the OPEC, to stop the fall in the oil prices. The economic performance of the oil-exporting countries is adversely affected by the increase in the oil prices since it provides structural changes in their economy in the favor of oil and non-traded sectors and less importance on the agriculture and manufacturing sectors. On the other hand, the rise in oil revenues appreciated the currencies, which lead to expensive exports and cheaper imports. The low price of the imports provides an opportunity to increase the share of exports to the oil-importing countries, while it kills the domestic industry of the oil-exporting countries. In oil-exporting countries, the oil revenues control government revenues, gross investment, and other economic activities (Sayed,2018).
The increase in the oil price is a reason for worsening of
the terms of trade of oil-importing countries and improving
the terms of trade of oil-exporting countries via the transfer
of wealth have not established a strong impact on economic
growth. However, the increase in oil prices worsens the
terms of trade of the oil-importing countries, but it also affects the international demand-supply and inflation. In the macroeconomic analysis of the Saudi Arabia over the period of 1980-2000 we observed that there is a small impact of the changes in oil prices on the terms of trade in the short run.
However, the output is vulnerable to the shock of the terms of trade (Aleisa & Dibooglu, 2004). An increase in oil prices deteriorate the terms of trade of the oil-importing countries (Backus & Crucini, 2000). The low-price elasticity of demand for oil is a greater cause of the deficit in the balance of trade of oil-importing countries (Bodenstein &Guerrieri, 2011).
An increase in oil price benefits oil exporters and improves current account balances, but it may impact the imports as oil producer’s propensity to consume is smaller than the propensity to consume oil importers (Mussa, 2000). The variation in the oil prices makes favorable terms of trade for the oil-exporting countries, while it results in unfavorable terms of trade for the oil-importing countries (Mirfachi,2006). The terms of trade is heavily influenced by oil price shocks, which make the export earnings unstable (Naziri et al., 2015). Positive price shocks in oil deteriorate the terms of trade of oil-importing countries, but it also leads to a transfer of wealth to oil-exporting countries. This leads to increased growth in oil-exporting countries, which finally end up in importing more from oil-importing countries (Allegret et al., 2015). The oil exports of Saudi Arabia is positively associated with the economic growth of the country both in the long run and the short run, while import was having a negative relationship with the economic both in the short run and long run (Sultan & Haque, 2018)
Oil price shocks lead to high macroeconomic volatility in the GCC region (Arezki & Nabil, 2012). The growth of the oil sector also contributed to an increase in the exports as well as the imports of Saudi Arabia by the many folds (Alhowaish, 2014). Also, the exports and imports of Saudi Arabia are found to be cointegrated (Haque, 2015).
Therefore, it can be said that the economy of the country depends on the performance of the oil sector. The prices of crude oil are fluctuating since the 1970s. The oil price shocks put an indirect effect on the GDP of the Saudi Arabia (Foudeh, 2017). In another study, Yousif and Alsultan (2018) found a negative correlation between oil prices and the GDP of Saudi Arabia. The reason for this relation is explained as the high oil price decreases the demand for the oil, which adversely affects the revenue of the government and the real growth rate of the GDP. Thus, heavy dependence on oil creates volatility in the economy.
3. Research Methods and Materials
The study uses the data for the period 2000 to 2018 for comprehending the relationship between terms of trade and oil prices. The data for net barter terms of trade is taken form
World Development Indicators (WDI). The data for oil prices is taken from Saudi Arabian Monetary Agency (SAMA).
The oil prices are of Arabian Light variety. The data is first checked for stationarity using the Augmented Dickey-Fuller (ADF) test. Here, the null hypothesis is that the data is not stationary. Next, as the sample is small, the study proposes to use Autoregressive Distributive Lag (ARDL) method to look for a cointegrating relationship between the two variables.
An added advantage of using this model is that it can be used irrespective of the condition that the variables are stationary at the level or first difference or one variable is stationary at the level and the other is stationary at first difference. Also, using ARDL for small samples is recommended by Pesaran and Shin (1999) and Narayan and Smyth (2012).The ARDL model is estimated by the given below equation:
0 1 1 2 1
1 0
ln ln
l n
n l
ln
t t
p
i t i
i q
j t j
j t
t
ToT OP
To ToT
T OP
β β β
ϕ
ϕ ε
− −
= −
= −
= + +
+
∆
+ ∆
+
∑
∑ (1)
Here, ToT stands for terms of trade and OP stands for oil prices. β
iare the long run multipliers and ε
tis the white noise error term. This equation is estimated and is tested for the presence of long run relationship using F-test for joint significance using the following hypothesis:
H
0: β
1= β
2= 0; H
0: β
1≠ β
2≠ 0 (2) Once cointegration is established the long run estimation is done through:
0 1 0
ln ToT
t= β + ∑ip=β
iln ToT
t i− + ∑qj= β
jln OP
t j− + ε
t (3) where β
s are the long run estimates.
β
jln OP
t j−+ ε
t(3) where β
sare the long run estimates.
And the short run is specified as:
0 1
0 1
ln ln
ln
p
t i i t i
q
j t j
j
t t
ToT ToT
OP ECM
β ϕ
ϕ
θ ε
= −
= −
−
∆ = + ∆
+ ∆
+ +
∑
∑
(4) where φ
sare the short run estimates and θ is the coefficient of the error correction term.
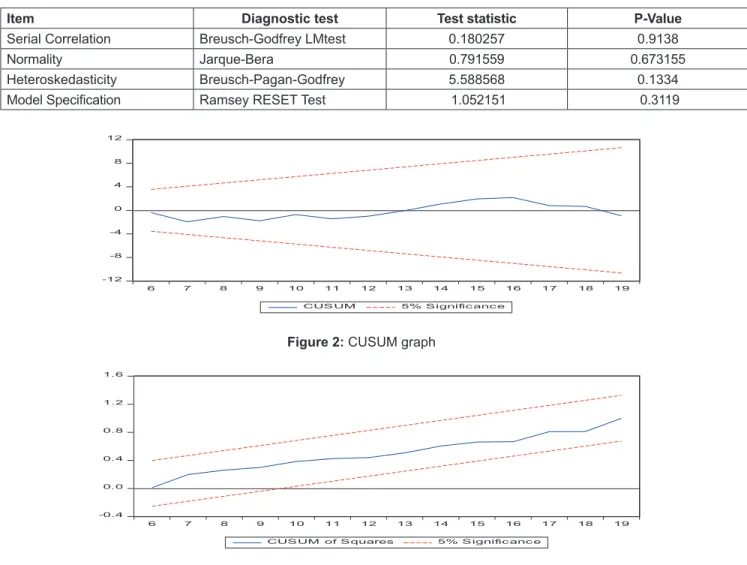
Finally, residual diagnostic tests are performed. The serial correlation test is done with the null hypothesis that there is no serial correlation. The heteroscedasticity test is done with the null hypothesis that is no heteroscedasticity.
The normality test is done with the null hypothesis that
that the residuals are normally distributed. The CUSUM
graphs are drawn to check if the model is stable. And finally Ramsey test is done with the null hypothesis that there is no misspecification in the model.
4. Results and Discussion
A preliminary visit to the data reveals that the net barter terms of trade has a mean of 11.836 with the base value of 100 in the year 2000. The terms of trade fluctuated from a maximum value of 149.50 to 82.05. Similarly, the oil prices also fluctuated between 110.22 and 29.84 with a mean value of 62.45 US dollars per barrel. While the terms of trade were negatively skewed, oil prices are positively skewed. The deviation in the prices of oil prices is greater than that in terms of trade (Table 1).
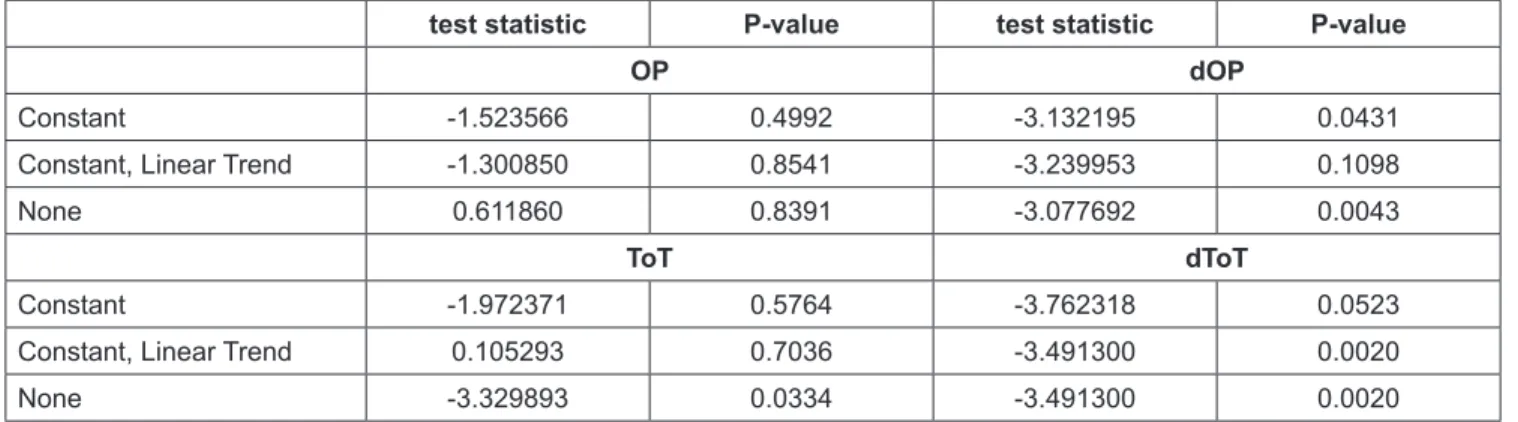
The study progresses with the identification of the stationary characteristics of the time series data. The results of Augmented Dickey Fuller test indicate that oil price is non-stationary at level, but is stationary at first difference (constant; and none). Terms of trade is stationary at level (None) (Table 2). As the data is stationary at level and at first difference, this study proceeds with the ARDL method for further analysis.
The results of ARDL estimation is provided in Table 3. The results of ARDL estimation indicates that there is exists a cointegrating relationship between terms of trade and oil prices as the F-statistic of the Bounds test (5.43) is higher than the upper bound value (4.16) at 5% level of significance.
Table 1: Descriptive statistics
Variable Mean Median Maximum Minimum Std. Dev. Skewness Kurtosis
ToT 118.8316 119.0026 149.5085 82.08547 23.15536 -0.040031 1.539918
OP 62.45105 61.10000 110.2200 23.06000 29.84758 0.276906 1.799417
Table 2: ADF test results
test statistic P-value test statistic P-value
OP dOP
Constant -1.523566 0.4992 -3.132195 0.0431
Constant, Linear Trend -1.300850 0.8541 -3.239953 0.1098
None 0.611860 0.8391 -3.077692 0.0043
ToT dToT
Constant -1.972371 0.5764 -3.762318 0.0523
Constant, Linear Trend 0.105293 0.7036 -3.491300 0.0020
None -3.329893 0.0334 -3.491300 0.0020
Table 3: ARDL estimates and Bound test results
Variable Coefficient Std. Error t-Statistic Prob.
LTOT(-1) 0.64623 0.102374 6.312436 0.000
LOP 0.582802 0.050423 11.55824 0.000
LOP(-1) -0.50225 0.056484 -8.89191 0.000
C 1.338292 0.380175 3.520199 0.0034
R-squared: 0.940258; F-statistics: 73.44645; Prob(F-statistics):0.000000
Model selection:-Maximum lags: 4 (Automatic selection); Akaike info criterion; ARDL(1, 1) Bounds test
Value Significance Lower bound 95% Upper bound 95%
F-statistic 5.434173 5% 3.62 4.16
The results estimate that there is a significant long-run relationship between the two variables as the associated p-vale for the t-statistic is l0.01, which is less than the 0.05.
A one percent increase in oil prices leads to 0.22 percent increase in terms of trade. The results also indicate a short run association as the value is less than 0.05. A one-percent
increase in oil prices increase the terms of trade by 0.58. The short run coefficient is bigger than the long-run coefficient.
The speed of adjustment indicated by the error correction terms is -0.35. As it is significant, this implies that any disequilibrium between the two variables will be corrected by 35% in a year (Table 4).
Table 4: ARDL estimation results
Long run relationships
Variable Coefficient Std. Error t-Statistic Prob.
OILP1 0.227697 0.07705 2.955237 0.0104
C 3.782943 0.30845 12.26436 0.000
Short run relationship
D(OILP1) 0.582802 0.04324 13.47784 0.000
CointEq(-1)* -0.35377 0.08196 -4.31642 0.0007
Table 5: Diagnostic tests
Item Diagnostic test Test statistic P-Value
Serial Correlation Breusch-Godfrey LMtest 0.180257 0.9138
Normality Jarque-Bera 0.791559 0.673155
Heteroskedasticity Breusch-Pagan-Godfrey 5.588568 0.1334
Model Specification Ramsey RESET Test 1.052151 0.3119
-0.4 0.0 0.4 0.8 1.2 1.6
6 7 8 9 10 11 12 13 14 15 16 17 18 19
CUSUM of Squares 5% Signific anc e
Figure 3: CUSUM square graph
-12 -8 -4 0 4 8 12
6 7 8 9 10 11 12 13 14 15 16 17 18 19
CUSUM 5% Signific anc e