ORIGINAL ARTICLE
Relationship between Winter Water Temperature in the Eastern Part of the Yellow Sea and Siberian High Pressure and Arctic Oscillation
Hae Kun Jung, Chung Il Lee
1)*Marine Bioscience and Techonology, Graduate School, Gangneung-Wonju National University , Gangwon 210-702, Korea
1)Department of Marine Bioscience, Gangneung-Wonju National University, Ganwon 210-702, Korea
Abstract
Water temperature in the eastern part of the Yellow Sea (EYS) during winter (JFM) and summer (JJA) from 1964 to 2009 and Siberian High Pressure Index (SHI) and Arctic Oscillation index (AOI) during winter (JFM) from 1950 to 2011 were used to analyze long-term variation in oceanic and atmospheric conditions and relationship between winter and summer bottom water temperature. Winter water temperature at 0, 30 and 50 m had fluctuated highly till the late of 1980s, but after this it was relatively stable. The long-term trends in winter water temperature at both depths were separated with cold regime and warm regime on the basis of the late 1980s. Winter water temperature at 0m and 50m during warm regime increased about 0.9°C and 1.1°C respectively compared to that during cold regime. Fluctuation pattern in winter water temperature matched well with SHI and AOI The SHI had negative correlation with water temperature at 0 m (r=-0.51) and 50 m (r=-0.58). On the other hand, the AO had positive correlation with Winter water temperature at 0 m (r=0.34) and 50 m (r=0.45). Cyclic fluctuation pattern of winter water temperature had a relation with SHI and AO, in particular two to six-year periodicity were dominant from the early of the 1970s to the early of the 1980s. Before the late of 1980s, change pattern in winter water temperature at 0 and 50 m was similar with that in the bottom water temperature during summer, but after this, relationship between two variables was low.
Key words : Arctic Oscillation, Siberian High Pressure, Eastern part of the Yellow Sea, Surface mixed layer
1. Introduction
1)The eastern part of the Yellow Sea (EYS) which is shallow water and main fishing ground in the Yellow Sea is semi-closed sea surrounded by Korean peninsula and China, and it responds sensitively to atmospheric-oceanic variability such as sea surface cooling/heating and sea wind (Lee et al., 2007). As a result, water column is vertically homogeneous in winter and this winter cooling and heating effects may influence on the distribution of bottom layer in
summer (Go et al., 2006; Jeong et al., 2003; Kang and Kim, 1987; Lee et al., 2007). Sea surface temperature in the Yellow Sea is the highest in August and the lowest in February, and this fluctuation matches well with the change in air temperature and wind speed (Go et al., 2009; Lee et al., 2007).
Oceanic conditions in winter with cold and dry air mass originated from Siberia is considered as main factor causing change in fisheries conditions (Kim et al., 2009). According to Kim et al. (2009), Siberian
Received 9 July, 2012; Revised 26 October, 2012;
Accepted 24 December, 2012
*Corresponding author : Chung Il Lee, Department of Marine Bioscience, Gangneung-Wonju National University, Ganwon 210-702, Korea
Phone: +82-33-640-2855 E-mail: [email protected]
ⓒ The Korean Environmental Sciences Society. All rights reserved.
This is an Open-Access article distributed under the terms of the Creative Commons Attribution Non-Commercial License (http://
creativecommons.org/licenses/by-nc/3.0) which permits unrestricted non-commercial use, distribution, and reproduction in any medium, provided the original work is properly cited.
High Pressure has positive correlation with the catch of pacific cod, cold water species in the Yellow Sea.
This extremely cold temperature and very little moisture air mass that forms primarily in winter over Siberia covers the entire East Asian continent (Gong and Ho, 2002; Kim et al., 2005) and it is also highly correlated with winter monsoon (Gong et al., 2001;
Jhun and Lee, 2004). In particular, Siberian High Pressure and Arctic Oscillation are highly correlated with each other and they play a decisive role a variations of winter climate in the Eurasia continent including Korean peninsular (Gong and Ho, 2002;
Nagato and Tanaka, 2012). When Arctic Oscillation Index (AOI) is negative (positive), cold air mass expands towards Siberia and it results in the stronger (weaker) Siberian High Pressure than normal (Gong and Ho, 2002; Nagato and Tanaka, 2012). In sequence, the stronger Siberian High Pressure may cause decrease in air temperature and precipitation over the East Asian continent due to movement of cold and dry air mass, and finally it influence on the strength of winter monsoon over the East Asian (Jhun and Lee, 2004).
Expanding of the cold and dry air mass passing over the Yellow Sea cause heavy snowfall along the western coast of Korea (Go et al., 2009). In addition, a cold wave during winter frequently hits the whole area of Korea, and Arctic Oscillation influences on the occurrence of this cold wave (Shin et al., 2006).
Therefore, it means that Siberian High Pressure correlated with Arctic Oscillation interacts with sea surface in the Yellow Sea and result in change of oceanic conditions.
The aim of this study is to illustrate relationship between winter water temperature and Siberian High Pressure and Arctic Oscillation, and to understand influence of winter water temperature on the bottom water temperature in summer.
2. Materials and Methods
2.1. Water temperature
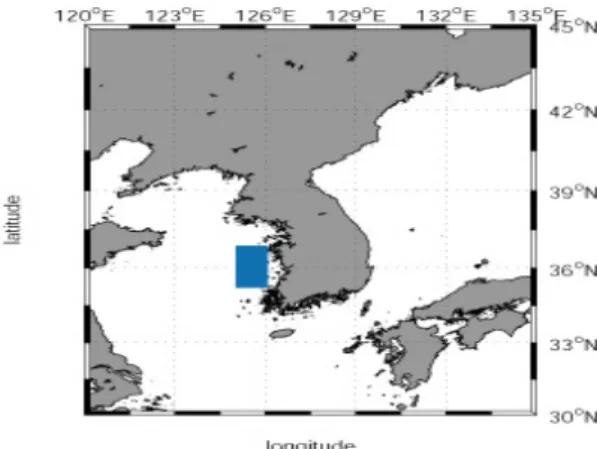
To illustrate relationship between atmospheric and oceanic condition, this study area selected over the 35-37˚N and 125-126˚E because this area mainly reflect not only the oceanographic field observation area carried out regularly by National Fisheries Research and Development Institute but also main fishing ground of commercial species is formed.
Winter (JFM) and summer (JJA) water temperatures at 0, 30 and 50 m for the period of 1964 to 2009 were averaged over the study area. The water temperature was released from World Ocean Database 2009 (http://www.nodc.noaa.gov/OC5/WOD09/
pr_wod09.html) (Fig. 1).
Fig. 1. Map showing the study area. Shaded rectangular indicate the study area.
2.2. Siberian High Pressure Index
The Siberian High Pressure Index (SHI) which it
indicate the strength of sea level pressure over the
Siberia (Gong and Ho, 2002) was averaged during
winter (JFM) for the period of 1950 to 2011. The SHI
was calculated by regional mean sea level pressure
anomaly over the 70°E-120°E, 40°N-60°N, where the
sea level pressure is generally greater than 1028hPa
(Fig. 2). The sea level pressure data obtained from
the monthly mean reanalysis dataset of the National
Centers for Environmental Prediction-National Center for Atmospheric Research (NCEP-NCAR). A positive index indicates that the sea level pressure was higher than the reference value, while a negative index indicates that the sea level pressure was lower than the reference value.
Fig. 2. Wintertime (JFM) sea level pressure climatology. This red rectangular area generally covers the central regions of the anticyclone, where the pressure is generally greater than 1028hPa.
2.3. Arctic Oscillation Index
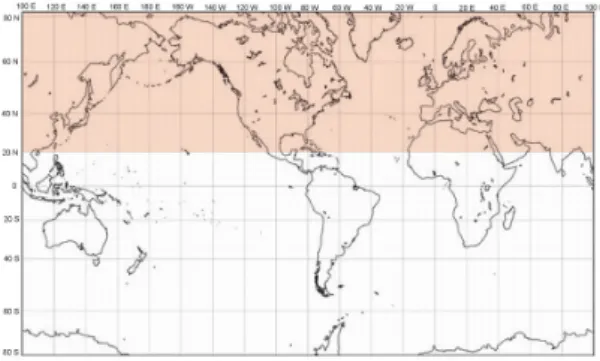
Winter (JFM) Arctic Oscillation Index (AOI) is defined by leading principal component of the monthly mean sea level pressure anomaly field over the domain poleward of 20°N (Thompson and Wallace, 1998; available at http://www.cpc.ncep.noaa.
gov/products/precip/CWlink/daily_ao_index/ao.shtml.) (Fig. 3). The positive value of AOI represents lower pressure than normal at the Arctic region. AOI is an index of the dominant pattern of non-seasonal sea level pressure variations north of 20°N, and it is characterized by pressure anomalies of one sign in the Arctic with the opposite anomalies centered about 37°N-45°N (Thompson and Wallace, 1998). According to Gong et al. (2001), Gong and Ho (2002) and Nagato and Tanaka(2012), the Arctic Oscillation is linked to the mid-latitude. When the AOI is positive, surface air temperature in the mid-latitude such as Siberian and Canada is warmer than normal and over the north polar region such as Greenland is cooling.
Fig. 3. Map showing area for Arctic Oscillation Index.
2.4. Wavelet analysis
To illustrate fluctuations pattern between atmospheric and oceanic conditions, winter water temperature in the study area and SHI and AOI were calculated using wavelet spectrum analysis. This method is useful to analyze both stationary and nonstationary time series data. It has been widely used to analyze the variation traits of different factors. we applied the Morlet wavelet to identify the periodicity between atmospheric conditions such as SHI and AOI and winter water temperature in study area (Hu and Wang 2009; Lee et al., 2010).
2.5. Statistical analysis
Water temperature anomaly at 0, 30 and 50 m in winter was calculated, and it was compared with SHI, AOI and water temperature in summer. Cross correlation coefficient between winter water temperature at 0, 30 and 50 m and SHI and AOI were calculated to understand relationship between each factor.
3. Results and Discussion
A similar climatological trend in time series change of winter water temperature at 0, 30, 50 m was shown (Fig. 4). It means that water column is almost vertically homogeneous and this phenomena is caused by vertical mixing due to the effect of tide, wind and sea surface cooling (Lee et al., 2007).
Interesting thing in this long-term variation is that
climatological trend is separated into two regimes, that is, cold regime before the late 1980s and warm regime after the regime shift. Mean water temperature at 0, 30 and 50 m in winter during warm regime increased about 0.9°C, 1.1°C and 1.1°C respectively compared to that during cold regime.
Fig. 4. Time-series change in winter water temperature anomaly at 0m (a) 30 m (b) 50 m (c) in the EYS.
Change in long-term trend before and after the late 1980s was matched well with the regime shift which water temperature changed from cold phase to warm phase in 1987/1988. According to Minobe (2000), this change was marked through various climate factors, and particularly it was occurred repeatedly in water temperature around Korean waters. In particular regime shift in 1987/88 was shown clearly (Fig. 4). In previous research (Kang et al., 2000; Kim et al., 2005; Lim et al., 2012; Tian et al., 2003; Tian et al., 2008, Zhang et al., 2004), regime shift in the late 1980s around Korean waters was focused mainly on the East Sea and East China Sea, however there was a few research on the ecosystem and marine environment in the Yellow Sea (Kang, 2008; Kim et
al., 2005, Kim et al., 2009)). In this study, regime shift in winter water temperature corresponded well with the abrupt change in Siberian High Pressure and Arctic Oscillation in winter (Figs. 5 and 6).
Fig. 5. Time series change in winter Siberian High Pressure Index.
Fig. 6. Time series change in winter Arctic Oscillation Index.
Fig. 7. Time series change in winter wind speed at Incheon meteorological observatory (a) and difference sea level pressure between central region of Siberian High Pressure and research area in the EYS (b).
Siberian High Pressure is considered as one of main factors affecting the oceanic conditions around Korean waters. When SHI was positive (negative), winter water temperature was relatively lower (higher) than normal condition (Figs. 4 and 5). These results are well matched with the result of Min and Kim (2006), and they explained that increasing costal sea surface temperature in Korea after 1970s was affected by Siberian High Pressure. The expanding of the Siberian High Pressure and increasing of deference of sea level pressure between central region of Siberian High Pressure and the EYS result in increase of wind speed in Korea (Fig. 7). Cold and dry air mass passing over the Yellow Sea stimulate evaporation from sea surface, and wind stress on the boundary between sea wind and sea surface makes surface water temperature be decreased more and more. Finally surface mixed layer could be deepened, and water column nearly homogeneous due to vertical mixing.
In general, AOI is separated with cool phase (negative) and warm phase (positive). When the AO switches from cold (negative) phase to warm (positive) phase, strong westerlies keeps cold Arctic air mass to around the North pole and as a result Siberian High Pressure could be decrease, and finally decrease of Siberian High Pressure causes relatively a warm winter in the EYS. On the other hand, when the AO is cold phase, cold Arctic air expands southwards due to weak westerlies (Thompson and Wallace, 1998; Panagiotopoulos et al, 2005; Nagato and Tanaka, 2012) and it causes strong Siberian High pressure (Figs. 5 and 6) and a cold winter over the Korean peninsular. For example, Jhun and Lee (2004) demonstrated that weak Siberian high caused weak winter monsoon over Korea peninsular and it was matched well the result of this study.
The correlation coefficient between SHI and winter water temperature at 0 m (r=-0.51), 30 m(r=-0.59) and 50 m (r=-0.58) was negative correlation, and AOI and winter water temperature at 0 m (r=0.34), 30
m(r=0.40) and 50 m (r=0.45) was positive correlation (Table 1). These atmospheric variations such as Arctic Oscillation and Siberian High Pressure affect water temperature in the EYS (Table 1). Moreover, water column in the EYS is well mixed vertically from surface to bottom. Therefore, these atmospheric variations affect almost vertically homogeneous in water column in the EYS (Fig. 4, Table 1).
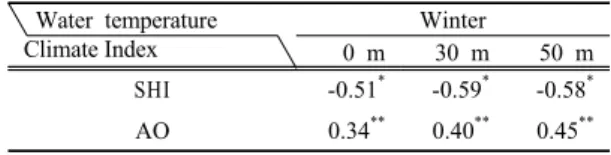
Table 1. Correlation coefficients between SHI, AOI and water temperature in winter
Water temperature Climate Index
Winter
0 m 30 m 50 m
SHI -0.51* -0.59* -0.58*
AO 0.34** 0.40** 0.45**
*: p-value<0.001, **: p-value<0.05, ***: p-value<0.1, N:p-value>0.1
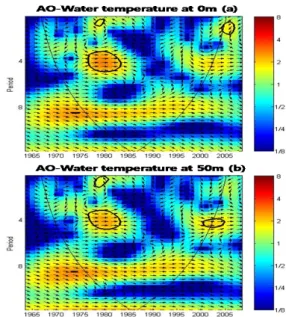
The cross spectrum between atmospheric variability such as SHI and AOI and the water temperature at 0 m and 50 m in the EYS suggested that they may be closely connected to each other. Water temperature at 0 m and 50 m and the SHI and AOI in winter have common periodicities (Figs. 8 and 9). In Fig. 8 and 9, red (blue) -color series indicate higher (lower) density, and fluctuation patterns are different before and after around the late 1980s. It means that dominant periodicity which control fluctuation of each factor is different with time. Short periodicity (2-6 years) was dominant between the early of the 1970s and the early of the 1980s.
The EYS is shallow water, and water column is well
mixed vertically by tide forcing, sea surface cooling
and so on. Therefore, water column from surface to
bottom could be quickly response to the change of
atmospheric condition such as Siberian High Pressure
and Arctic Oscillation (Figs. 8 and 9, Table 1). As
mentioned above, the expanding of Siberian High
Pressure towards the Yellow Sea pushes cold and dry
air mass which it has few moisture content over the
Yellow Sea, and it takes a large amount of moisture by
Fig. 8. The wavelet cross-spectrum between the SHI and winter water temperature at 0 m (a) and at 50 m (b) in the ESY. The vectors indicate the phase difference between the SHI and water temperature (with in-phase pointing right, anti-phase pointing left, an arrow pointing vertically means the second time series lags the first by 90°, that is, the phase angle is 270°). The 5% significance level against red noise is shown as a tick contour and the thin black line indicates the cone of the influence.
Fig. 9. The wavelet cross-spectrum between the AOI and winter water temperature at 0m (a) and at 50m (b) in the EYS. The vectors indicate the phase difference between the AOI and water temperature (with in-phase pointing right, anti-phase pointing left, an arrow pointing vertically means the second time series lags the first by 90°, that is, the phase angle is 270°). The 5% significance level against red noise is shown as a tick contour and the thin black line indicates the cone of the influence.
the process of evaporation from the sea surface (Go et al., 2009). After all, increase of density due to surface cooling makes more easily the water column be mixed vertically in winter time. In next spring through summer, the air-sea heat budget at surface is dominated by the incoming solar radiation. Therefore, surface water temperature was increased, but bottom water separated from the surface warm water by stratification.
This bottom cold water is called as the Yellow Sea Bottom Cold Water (YSBCW). Resultingly, long term atmospheric variability during winter season such as Siberian High Pressure and Arctic Oscillation could be affect the formation, distribution and continuance of YSBCW in the next summer time (Cho and Cho, 1988; Zhang et al., 2008).
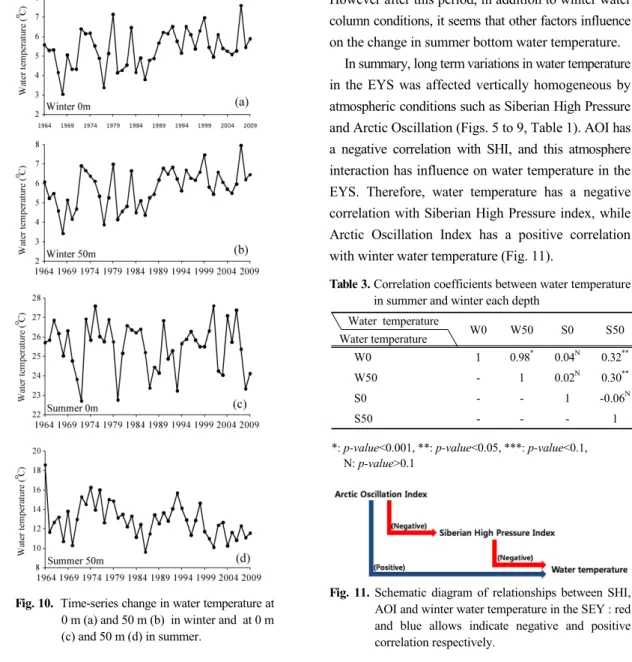
Time-series change in water temperature at 50 m in summer was not matched well with that at 0 and 50 m in winter (Fig. 10). The correlation coefficient between summer bottom water temperature and winter water temperature at 0 (r=0.09) and 50 m (r=0.00) has low correlation (Table 3). However, the relationship between winter water temperature at 0 and 50 m and summer bottom water temperature was different before and after the late of 1980s (Table 4).
Winter water temperature was relatively correlated with summer bottom water temperature before the late 1980s, but after this, the relationship was low.
Before the late of 1980s, winter water temperature is
considered as important factor influencing on the
change of bottom water temperature in summer.
Water temperature Water temperature
Before 1989 After 1989
WO W50 S0 S50 W0 W50 S0 S50
W0 1 0.97* 0.19N 0.61** 1 0.97* -0.16N 0.30N
W50 - 1 0.18N 0.65* - 1 -0.22N 0.28N
S0 - - 1 0.13N - - 1 -0.42***
S50 - - - 1 - - - 1
*: p-value<0.001, **: p-value<0.05, ***: p-value<0.1, N: p-value>0.1
Table 4. Correlation coefficient between winter water temperature and summer water temperature at each depth before and after 1989
Fig. 10. Time-series change in water temperature at 0 m (a) and 50 m (b) in winter and at 0 m (c) and 50 m (d) in summer.
However after this period, in addition to winter water column conditions, it seems that other factors influence on the change in summer bottom water temperature.
In summary, long term variations in water temperature in the EYS was affected vertically homogeneous by atmospheric conditions such as Siberian High Pressure and Arctic Oscillation (Figs. 5 to 9, Table 1). AOI has a negative correlation with SHI, and this atmosphere interaction has influence on water temperature in the EYS. Therefore, water temperature has a negative correlation with Siberian High Pressure index, while Arctic Oscillation Index has a positive correlation with winter water temperature (Fig. 11).
Table 3. Correlation coefficients between water temperature in summer and winter each depth
Water temperature
Water temperature W0 W50 S0 S50
W0 1 0.98* 0.04N 0.32**
W50 - 1 0.02N 0.30**
S0 - - 1 -0.06N
S50 - - - 1
*: p-value<0.001, **: p-value<0.05, ***: p-value<0.1, N: p-value>0.1
Fig. 11. Schematic diagram of relationships between SHI, AOI and winter water temperature in the SEY : red and blue allows indicate negative and positive correlation respectively.