한수지 50(4), 413-420, 2017
413
Copyright © 2017 The Korean Society of Fisheries and Aquatic Science pISSN:0374-8111, eISSN:2287-8815 Korean J Fish Aquat Sci 50(4),413-420,2017
Original Article
서 론
쏙
(Upogebia major) (de Haan, 1841)
은동북아시아등지의 갯벌에서서식하는갑각류이다(Kinoshita, 2002; Liu and Liu,
2012).
한국서남해의조간대에서주로발견되는쏙은대규모로이루어지는종특유의생물교반
(bioturbation)
활동(Rowden and Jones, 1993)
을통하여갯벌퇴적물을교반하거나저서생 물의군집에영향을주는갯벌생태학연구에중요한종의하나 이다(Wynberg and Branch, 1994).
쏙의이상발생이갯벌생태 계에미치는영향(Hong, 2013)
을비롯한다양한관심에도불구 하고,
자세한분류학적위치,
외부형태및국내의지리적분포,
서식처의구조,
생리및생태외에생태계공학측면에서의쏙의 기능과생리적특성등에대하여제한된정보만이알려져있다.
쏙의갑작스런서식밀도증가는생물교반활동에따른퇴적
상변화로인해기존생물들의서식지를침범하여생태계교란 을유발하며
,
주변의갯벌생태계에큰영향을미치는것으로알 려져있다(Hong, 2013).
국내서해안일부갯벌에서는쏙의이 상증식으로인하여바지락의서식처가피해를받아생산량이1/10
수준으로급감했던사례가보고된바있으며쏙개체의조절을위한연구필요성이제기되었다
(Park et al., 2013).
국내외 퇴치관련연구사례로는쏙의신경접합부에있는acetylcholin-
esterase
의활동을저해시켜과잉활동시근육및호흡마비로죽음에이르게하는
Carbaryl (1-naphthyl methylcarbamate)
이라는살충제를간조시에갯벌에뿌려쏙에의한굴양식장 피해를줄이려는시도를들수있다(Estes, 1986).
미국에서의 이러한시도가쏙군집감소에는효과적이었다고보고되기는 하였지만(Buchanan et al., 1985; Armstrong et al., 1989),
다 른저서성무척추동물에도영향을미치는단점을보임에따라쏙(Upogebia major)의 광반응 분석시스템 구축과 발광다이오드 (Light-Emitting Diode) 파장별 행동분석
장준철 1,2 ·정종균 2 ·허윤성 2 ·송재희 3 ·김종명 1 *
1부경대학교 수산생물학과, 2부경대학교 LED-해양 융합기술 연구센터, 3국립수산과학원 갯벌연구센터
Behavioral Monitoring System for Mud Shrimp Upogebia major
and the Photoresponse to Illumination with Different Wavelength LEDs
Jun-Chul Jang
1,2
, Jong-Kyun Chung2
, Youn-Seong Hur2
, Jae-Hee Song3
and Jong-Myoung Kim1
*1 Department of Fisheries Biology, Pukyong National University, Busan 48515, Korea
2 LED-Marine Convergence Technology R&D center, Pukyong National University, Busan 48547, Korea
3 Tidal Flat Research Center, National Institute of Fisheries Science, Gunsan 54014, Korea
The increase in the number of mud shrimps Upogebia major is a concern because of their negative effects on shellfish aquaculture, including Manila clam Venerupis philippinatum along the west coast of Korea. This study developed a behavioral analysis system for aquatic animals using a set of monochromatic light-emitting diode (LED) modules covering the visible light range at similar intervals. Movements of mud shrimp were monitored using a tracking sys- tem under illumination with infra-red light and an LED of 660 nm wavelength without provoking stimulation. The minimum light intensity needed to induce a photoresponse by the mud shrimp was 10 μmole/m 2 /s under the condi- tions tested. Of the six kinds of LED illuminations tested, the most sensitive response was obtained with illumination with the 505 nm LED, followed in order by LEDs with peak wavelengths of 525 nm≒465 nm > 405 nm≒590 nm >
660 nm. These findings should help to identify LED sources that efficiently induce movement of the mud shrimp and also for monitoring movement without stimulating.
Key words: Mud shrimp Upogebia major , LED (Light Emitting Diodes), Photo-response
This is an Open Access article distributed under the terms of the Creative Commons Attribution Non-Commercial Licens (http://creativecommons.org/licenses/by-nc/3.0/) which permits unrestricted non-commercial use, distribution, and reproduction in any medium, provided the original work is properly cited.
https://doi.org/10.5657/KFAS.2017.0413 Korean J Fish Aquat Sci 50(4) 413-420, August 2017 Received 29 June 2017; Revised 18 July 2017; Accepted 31 July 2017
*Corresponding author: Tel: +82. 51. 629. 5919 Fax: +82. 51.629.5908
E-mail address: [email protected]
장준철
ㆍ
정종균ㆍ
허윤성ㆍ
송재희ㆍ
김종명414
비특이적살충제의사용이금지되었다
(Lindsay, 1961).
이러한 방법들의단점을만회하고자쏙의천적을활용하거나전기충 격등을사용하는방안이나(Dumbauld et al., 2008)
양식방법 의변형을통한피해저감방안등다양한대책들이제시되었 다(DeFrancesco and Murray, 2010).
장비를이용한쏙서식갯 벌의경운방법의경우서식처를교란하여쏙을굴밖으로노출 시켜갈매기등에의한포식등으로어느정도쏙서식량을줄 일수는있으나매년경운을실시해야하는애로사항이있다.
또 한,
쏙의서식밀도와지반의경도에따라경운자체가어려운 갯벌들이존재할뿐만아니라,
퇴적환경의물리적교란은퇴적 물의구조를변형시켜갯벌에서식하는동물과수생식물에심 각한손상을주며표층생물에도어느정도영향을미치는것으 로보고된바(Herkül et al., 2011)
있어현장적용의어려움이 예상된다.
따라서환경에무해한방식의생물의조절방법개발 을통한근본적인원인해결책모색을위해서는쏙의생리적감 각을이용한유인이나제어등생리적특성에대한더많은정 보가필요할것이다.
LED (Light Emitting Diodes)
는친환경적인조명기구로써,
에너지효율이높고,
수명이긴장점을가지고있어실내외의 다양한분야에서기존조명을대체해가고있다.
복합파장을 나타내는자연태양광원이나기존의인공광원과는달리LED
는특정파장영역만조사할수있는차별적인특성을가지고있 다(Migaud et al., 2007; Shin and Kim, 2009).
최근에는LED
를어류기반수산업에이용하는융합연구가진행되어,
관상어 및양식어종에대한파장별스트레스,
호르몬등의생리학적 분석(Shin et al., 2011)
연구외에,
주로집어등포획어종의광 반응관련연구를중심으로행동학적실험이진행되었다(Jang et al., 2016).
전복등의패류에서도LED
조명을이용한융합 연구도진행된바있으나(Gao et al., 2016),
갑각류관련융합 연구사례는미흡한실정이다.
본연구에서는서해안지역의조 간대패류양식장환경에영향을미치는쏙의친환경적인행동제어와생리반응에대한기초자료를제공하기위하여광자극
에행동분석시스템을구축하고
LED
파장별행동특성을분석하여광조사시유도되는유인
/
제어행동변화및파장별영향 을확인하였다.
재료 및 방법
실험 생물
본 실험에사용된쏙은충남보령시주교면송학리갯벌에 서
137
마리를직접 획득하였으며,
평균크기는 두흉갑장이28.4±5.1 mm,
전장이95.3±10.7 mm
이었다.
운반된쏙은부 경대학교LED-
해양융합기술연구센터내0.5 ton
규모의순환 여과조에냉각장치를이용하여18℃
에서3
일간순치후실험을 진행하였다.
파장별광반응은수조당20
마리,
행동분석은5
마 리의쏙으로실험을수행하였다.
LED 조명 설계 및 광학 측정
본실험을위해제작한조명은가시광선영역에서
6
가지단일 파장영역을선정하였다.
광반응실험용조명기구는LUXPIA (Suwon, Korea)
사에서구입한LRU1056 (Red, 660 nm), LAU 1056 (Amber, 590 nm), LGH1056 (Green, 525 nm), LCH1056 (Cyan, 505 nm), LBH1056 (Blue, 465 nm), LVH1056 (Violet, 405 nm) LED package
를사용하여제작하였다. LED
모듈은10
직렬12
병렬로 설계하였으며,
효과적인 열 방출을 위하여Metal PCB
를사용하였다.
완성된LED
모듈의크기는420(L)
×320(W) ×50(H) mm
이며,
덮개는10 mm
두께의강화유리를 사용하여제작하였으며,
수중에만빛이조사될수있도록수위 에맞춰가림판을설치하였다.
실험에사용된조명은제어기를부착하여동일한광량이조사 되도록조절하여실험을진행하였다
.
동일한광량조건을확보 하기위하여적분구(Withlight Co., Korea)
를사용하여광학측Dark
Adaptation area
(A) (A)
0.3m 0.33m
0.07m
0.57m
Camera
Violet (405 nm) Blue (465 nm) Cyan (505 nm) Green (525 nm) Amber (590 nm) Red (660 nm)
1μmole /m
2/s
10 μmole /m
2/s
50 μmole /m
2/s
Behavior analysis, Dark (1min) → Light (1min)
(465 nm) Blue
(505 nm) Cyan
Green (525 nm)
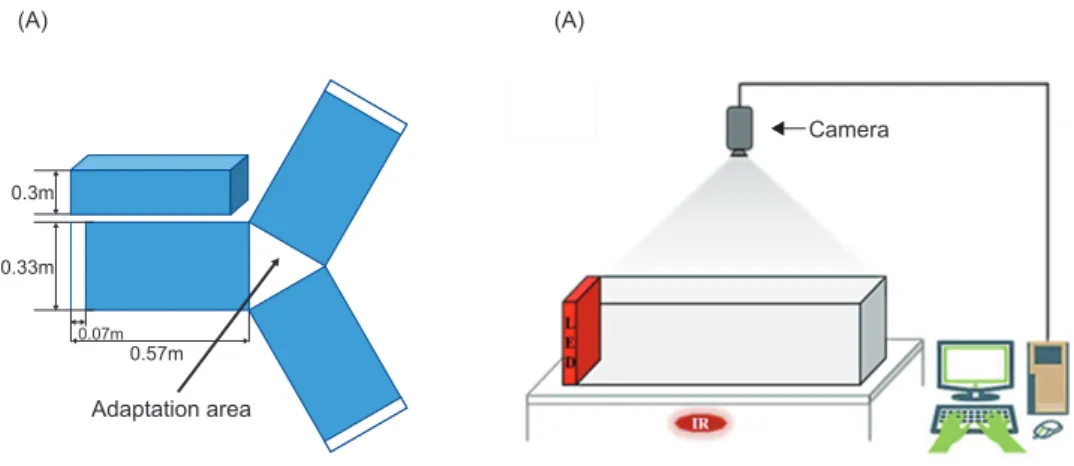
Fig. 1. (A) Structure diagram of the Y-type cage aquarium constructed for photo-response analysis, and (B) schematic diagram of the experimental set up for behavior analysis.
갯벌 양식장 쏙의 광반응 분석
415
정을실시하였으며
,
최고및최저로조정한조명의단계별광량 은라디오미터를사용하여측정하였다.
수중투과율에따른광 량분석은실험용수조에서파장별광원으로부터거리간격을 두고라디오미터를통하여측정하였다.
파장별 광반응
파장별광반응분석시스템은서로의빛이간섭하지않는조 건의
Y
자형태의수조로제작하였다. Y
자모형의접점지역에 쏙20
마리를두고1
시간이상암순응시킨후10
초동안LED
점등시,
실험수조양끝으로이동행동을보이는개체를계수 하여분석하였다.
쏙이인지하는최소광량을확인하기위하여3
가지의광량(1, 10, 50 μmole/m
2/s)
과6
가지파장(405, 465, 505, 525, 590, 660 nm)
조건으로광반응실험을진행하였다. 행동분석
LED
광원이쏙의초기행동에미치는분석실험은6
가지파장의
LED
와반응하는최소광량인10 μmole/m
2/s
로15
번반 복실험하였다.
실험에사용된쏙은5
마리이며바닥면과LED
빛을조사하는부분을제외하고는흰색시트지를붙여,
분석하 고자하는생물과의명암대조를이용하여추적하였다.
실험수 조를원형받침대가운데에두고,
바닥에쏙이인지하지못하는 적외선램프(R95 IR Red, Philips lighting, Netherlands)
를아래에사용하여물체를탐지할수있도록하였으며
, LED
광원은수조의좌측면에배치하여수중으로만투과될수있도록진행 하였다
.
동물행동분석은Ethovision XT10 (Noldus, Wagenin- gen, Netherlands)
을사용하여실험을진행하였으며, 1
시간이 상충분히암순응시킨상태에서의움직임과LED
조사후1
분간의움직임을
CCD
카메라를사용하여촬영하고소프트웨어를사용하여속도변화차이를분석하였다
.
행동분석녹화시,
개 체의겹침현상으로인한불완전추적의경우에는행동분석데 이터에서제외하였다.
광원이쏙의움직임에미치는효과를자 세히분석하기위하여유사한결과를보이는3
가지파장을선정 하여동일한방법으로3
회씩5
세트의반복실험을실시하였다.
CCD
카메라를이용하여조명점등전후의1
분간의행동을촬영하였으며
,
동물행동분석장치를이용하여움직임추적과히 트맵분석을진행하였다.
통계처리
실험의 결과의 통계 처리는
SPSS
프로그램(version 23.0;
SPSS Inc., USA)
을사용하였으며,
평균값을일원분산분석한 후, Tukey
의사후검정을통해P<0.05
수준에서항목간의유의 적인차이를검정하였다.
결론 및 고찰
광반응 모니터링 분석 시스템 구축
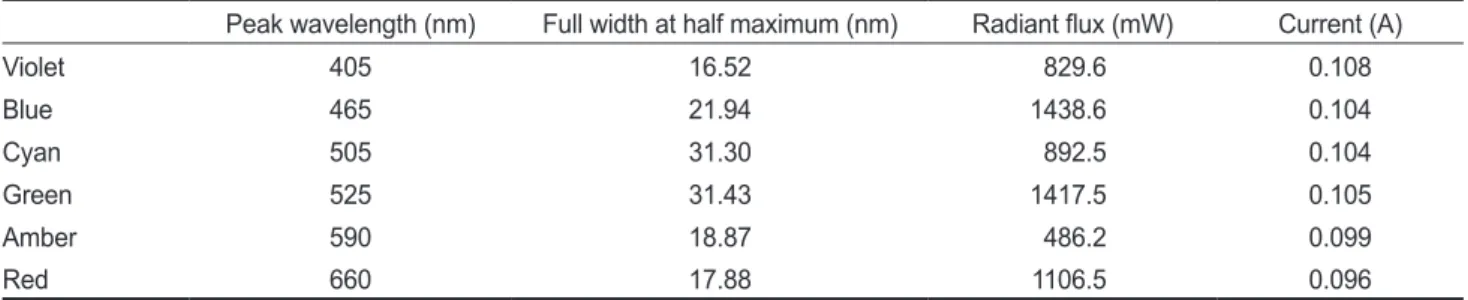
적분구를사용하여측정한조명의광학적특성은
Table 1
과Fig. 2
에나타내었다.
사용된LED
조명의최대파장및반치폭 은각각Red (660/17.88 nm), Amber (590/18.87 nm), Green (525/31.43 nm), Cyan (505/31.30 nm), Blue (465/21.94 nm), Violet (405/16.52 nm)
로나타났다.
빛은파장별로수심에따른투과력이다르므로수조내위치 에따른광량을분석하기위하여
,
실험수조의한쪽끝에LED
조명을두고수중거리별로투과되는광량을측정하였다.
수중 에서10
반복측정한광량을바탕으로작성한감소곡선을(Fig.
3)
보면, Y-
형수조의한쪽끝에서조사한파장별광원은생물 이위치한0.5 m
지점에서는광량이각각Violet (6.97%), Blue (9.39%), Cyan (9.02%), Green (8.56%), Amber (5.92%), Red
Table 1. Specification of LED modules constructed for monitoring the photo-response
Peak wavelength (nm) Full width at half maximum (nm) Radiant flux (mW) Current (A)
Violet 405 16.52 829.6 0.108
Blue 465 21.94 1438.6 0.104
Cyan 505 31.30 892.5 0.104
Green 525 31.43 1417.5 0.105
Amber 590 18.87 486.2 0.099
Red 660 17.88 1106.5 0.096
LED illumination
1 μmole 10 μmole 50 μmole
Relative sensitivity (%)
0 10 20 30 40 50
b
a a
LED illumination
Violet Blue Cyan Green Amber Red Dark
Relative sensitivity (%)
0 10 30 40
50 bc bc c bc
ab a
abc
150 200
ab bc
c bc
a ab Distance (m)
Penetration ratio (%)
0.0 100
80 60 40 20 0
Violet Blue Cyan Green Amber Red
0.2 0.4 0.6 0.8 1.0
Wavelength (nm)
Light intensity [mW]
60 50 40 30 20 10 0
400 450 500 550 600 650 700
Violet
Amber Red Green
Cyan Blue
Fig. 2. Spectral power distributions of LED sources measured by using an integrating sphere.
장준철
ㆍ
정종균ㆍ
허윤성ㆍ
송재희ㆍ
김종명416
(4.64%)
였으며, 1 m
떨어진지점에서의광량은각각Violet (5.59%), Blue (7.28%), Cyan (6.30%), Green (5.92%), Amber (5.47%), Red (4.23%)
으로나타났다.
이결과는빛의진행방향 에대하여수직방향의조도가거리의제곱에반비례한다는이 전의연구결과(Choi, 2006; Choi et al., 2010)
와유사하게광 원으로부터멀어질수록광량이급격하게낮아짐을 보여준다.
본실험수조에서광원이위치한것과반대방향끝수중환경의광량은대부분파장에서원광량에비해
90%
이상감소하였으며
, 660 nm
의LED
조명에서가장큰손실이있음을알수있었 다.
또한청-
녹계열파장의투과율이적색광보다높게나타났는 데,
이는수중미립자밀도로인한장파장의흡수로판단된다.
광반응분석수조는조명의광량및쏙의움직임등을고려하 여
,
서로의빛이간섭하지않는조건의Y
자형태수조로제작하 였다.
이를위하여0.57(L)×0.33(W)× 0.3(H) m
의사각형수조
3
개를연결하여Y
자형태로만들었으며,
각수조끝에는내 부에조명을넣을수있도록각약0.07 m
의간격을두어제작하 였다.
행동분석수조는0.5(L)×0.3(W)×0.3(H) m
크기의사 각수조에서진행되었으며Fig. 4
에나타내었다.
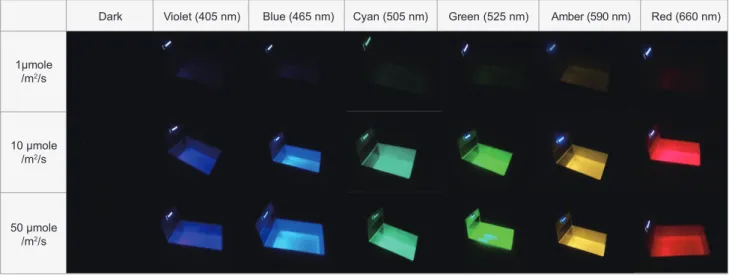
광량/파장별 광반응
파장에따른광반응은수온
18℃
의암실수조에서순치한쏙 에6
가지파장의LED
광원별자극을준다음10
초간의이동행 동을분석하였으며,
대조구로빛이없는암실조건(Dark)
을사 용하였다.
쏙의움직임을유도하는데필요한최소광량을알아 보기위하여LED
광원별로1 μmole/m
2/s
에서l0 μmole/m
2/s,
그리고50 μmole/m
2/s
로광량을증가시키면서쏙의움직임의 차이를분석하였다(Fig. 5).
광량별실험결과를종합해보면6
파장전체에서광량1 μmole/m
2/s
에서는암조건에서의움직임 과별다른차이가발견되지않았으나,
광량이l0 μmole/m
2/s
로 증가하는경우에는광반응이34%
에서40.9%
로증가하였으며, 50 μmole/m
2/s
로증가할경우에는41.4%
로10 μmole/m
2/s
과 통계학적으로유사한경향을나타내었다.
앞선결과를바탕으 로l0 μmole/m
2/s
이상의광량이광반응을유도할수있는광량 으로나타났으며,
파장별광반응실험은l0 μmole/m
2/s
광량을 기준으로실험을진행하였다.
파장별광반응분석결과를보면
405 nm-525 nm
가시광선영역 에서는Violet (43.0 %), Blue (43.0%), Cyan (43.5%), Green (43.0%)
파장이43%
이상의광반응을나타내는것으로나타났으 나,
그이외의파장에서는Amber (40.5%)
그리고Red (37.0%)
와Dark (36.5%)
로 유의적인 차이를 나타내었다.
통계분석 시, Dark
상태를기준으로Violet (P=0.017), Blue (P=0.034), Cyan (P=0.017), Green (P=0.034) Amber (P=0.449), Red (P=1.000)
로나타났다.
이결과는amber
와red
와같은장파장LED illumination
1 μmole 10 μmole 50 μmole
Relative sensitivity (%)
0 10 20 30 40 50
b
a a
LED illumination
Violet Blue Cyan Green Amber Red Dark
Relative sensitivity (%)
0 10 30 40
50 bc bc c bc
ab a
abc
LED illumination
Violet Blue Cyan Green Amber Red Dark
Relative sensitivity (%)
0 100 150 200
ab bc
c bc
a a
ab Distance (m)
Penetration ratio (%)
0.0 100
80 60 40 20 0
Violet Blue Cyan Green Amber Red
0.2 0.4 0.6 0.8 1.0
Wavelength (nm)
Light intensity [mW]
60 50 40 30 20 10 0
400 450 500 550 600 650 700
Violet
Amber Red Green
Cyan Blue
Fig. 3. Underwater penetration characteristics of LEDs measured from the surface of the experimental tank.
Dark
Adaptation area
(A) (A)
0.3m 0.33m
0.07m
0.57m
Camera
Violet (405 nm) Blue (465 nm) Cyan (505 nm) Green (525 nm) Amber (590 nm) Red (660 nm)
1μmole /m
2/s
10 μmole /m
2/s
50 μmole /m
2/s
Behavior analysis, Dark (1min) → Light (1min)
(465 nm) Blue
(505 nm) Cyan
Green (525 nm)
Fig. 4. Experimental tanks illuminated with LEDs of different wavelengths (dark, no light; violet 405nm; blue 465 nm; cyan 505 nm;
green 525 nm; amber 590 nm and red 660 nm) and light intensities of 1, 10, and 50 µmole/m2/s.
갯벌 양식장 쏙의 광반응 분석
417
계열
(< 590 nm)
에서는빛에따른반응이낮았음을확인할수 있었으며, 650 nm
의Red
광원은암실에서와마찬가지로빛의 자극을유도하지않아IR
대신에관찰용조명등으로이용하기 에적합한것으로판단된다(Fig. 6).
행동분석
파장별광반응유도효과를기반으로세부행동분석을위하여
,
파장별자극후쏙의1
분간움직임을CCD
카메라를사용하여 녹화하여분석하였다.
앞선실험과마찬가지로총6
가지파장 을사용하였으며, 1
시간이상암순응시킨후,
암순응상태와조명점등시의이동속도차이를분석하여
Fig. 7
에나타내었다.
총
3
회씩5
세트의반복실험한결과암순응에서평균속도는1.117±0.15 cm/s
이며, 1
시간이상암순응후LED
조명을점등 한상태에서의평균속도는각각1.379±0.87 cm/s (405 nm), 1.656±0.89 cm/s (465 nm), 2.183±1.76 cm/s (505 nm), 1.743±1.32 cm/s (525 nm), 1.615±1.15 cm/s (590 nm), 0.904±0.84 cm/s (660 nm)
로나타났다.
파장별LED
점 등후속도변화율분석은암순응상태의평균속도를100%
기준으로 설정하고 매 실험마다 속도 증가율의 평균을종 합하여계산하였다
.
이속도증가율의 평균은140.0±30.4%
(405 nm), 172.2±31.4% (465 nm), 193.0±32.0% (505 nm), 175.2±25.9% (525 nm), 143.0±28.4% (590 nm), 102.6±
22.6% (660 nm)
로나타났으며이결과를토대로분석한파장 별움직임은505 nm>525 nm≒465 nm>590 nm≒405 nm>>
660 nm≒Dark
순서로나타났다.
통계분석결과는Dark
상태 기준으로Violet (P=0.098), Blue (P=0.008), Cyan (P=0.000), Green (P=0.000), Amber (P=0.061), Red (P=1.000)
로나타났 으며이는청-
녹계열(465-525 nm)
에서의유의적인차이를확 인할수있었다.
이러한결과를바탕으로파장별광반응효과를자세히분석하기위하여
,
가장민감한반응을나타낸청-
녹계 열의3
가지파장(465, 505, 525 nm)
을대상으로동일한방법 으로추가실험을진행하였으며광원에따른쏙의움직임을히 트맵과트래킹을이용하여분석하였다(Fig. 8).
본연구결과 평균이동거리를보면암순응상태에서는79.80±11.06 cm
이 며,
조명점등시105.44±53.58 cm (465 nm), 149.75±63.79 cm (505 nm), 123.32±61.60 cm (525 nm)
로각각나타났다.
암순응시평균이동거리를100%
기준으로설정하여환산할 경우, 148.3±38.5% (465 nm), 169.7±25.9% (505 nm), 160.2±17.6% (525 nm)
로나타났다.
파장별이동거리 증가 율 평균은505 nm>525 nm≒465 nm >> Dark
로나타났으 며,
암순응상태기준통계분석결과는Blue (P=0.013), Cyan
Fig. 5. Photosensitivity analysis of mud shrimp Upogebia majormeasured upon three (1, 10, and 50 μmole/m2/s) intensities of LED illumination. a-b Means with superscripts bars are significantly dif- ferent (P < 0.05).
LED illumination
1 μmole 10 μmole 50 μmole
Relative sensitivity (%)
0 10 20 30 40 50
b
a a
LED illumination
Violet Blue Cyan Green Amber Red Dark
Relative sensitivity (%)
0 10 30 40
50 bc bc c bc
ab a
abc
LED illumination
Violet Blue Cyan Green Amber Red Dark
Relative sensitivity (%)
0 100 150 200
ab bc
c bc
a a
ab Distance (m)
Penetration ratio (%)
0.0 100
80 60 40 20 0
Violet Blue Cyan Green Amber Red
0.2 0.4 0.6 0.8 1.0
Wavelength (nm)
Light intensity [mW]
60 50 40 30 20 10 0
400 450 500 550 600 650 700
Violet
Amber Red Green
Cyan Blue
Fig. 6. Photoresponse analysis of mud shrimp Upogebia major with different LED wavelengths. a-c Means with superscripts bars are significantly different (P<0.05).
LED illumination
1 μmole 10 μmole 50 μmole
Relative sensitivity (%)
0 10 20 30 40 50
b
a a
LED illumination
Violet Blue Cyan Green Amber Red Dark
Relative sensitivity (%)
0 10 30 40
50 bc bc c bc
ab a
abc
LED illumination
Violet Blue Cyan Green Amber Red Dark
Relative sensitivity (%)
0 100 150 200
ab bc
c bc
a a
ab Distance (m)
Penetration ratio (%)
0.0 100
80 60 40 20 0
Violet Blue Cyan Green Amber Red
0.2 0.4 0.6 0.8 1.0
Wavelength (nm)
Light intensity [mW]
60 50 40 30 20 10 0
400 450 500 550 600 650 700
Violet
Amber Red Green
Cyan Blue
Fig. 7. Relative sensitivity (%) of mud shrimp Upogebia major reflected in the change of speeds upon illumination of LEDs as compared to that of the movement in the dark (100%). a-c Means with superscripts bars are significantly different (P<0.05).
LED illumination
1 μmole 10 μmole 50 μmole
Relative sensitivity (%)
0 10 20 30 40 50
b
a a
LED illumination
Violet Blue Cyan Green Amber Red Dark
Relative sensitivity (%)
0 10 30 40
50 bc bc c bc
ab a
abc
LED illumination
Violet Blue Cyan Green Amber Red Dark
Relative sensitivity (%)
0 100 150 200
ab bc
c bc
a a
ab Distance (m)
Penetration ratio (%)
0.0 100
80 60 40 20 0
Violet Blue Cyan Green Amber Red
0.2 0.4 0.6 0.8 1.0
Wavelength (nm)
Light intensity [mW]
60 50 40 30 20 10 0
400 450 500 550 600 650 700
Violet
Amber Red Green
Cyan
Blue
장준철
ㆍ
정종균ㆍ
허윤성ㆍ
송재희ㆍ
김종명418
(P=0.001), Green (P=0.002)
로나타났다.
히트맵분석에서는1
분간빛에노출된쏙이머무르는지역을나타내었으며조명이 점등된후에는점등전보다쏙이수조내부에서지속적인움직 임이있었음을확인할수있었다.
본연구에서는갯벌양식장의침탈생물의하나인쏙을대상
으로
LED
파장에따른행동분석시스템을구축하고LED
파장별자극에따른움직임의차이를확인하였다
. LED
파장별광반응결과는특정한영역
(405-590 nm)
의가시광선을인지하는것으로판단되며
, 660 nm
이상의장파장영역은인식하지못하는것으로판단된다
.
가시광선영역에서도특히청-
녹계열의 파장영역에서더큰반응을나타내었으며,
청-
록계열의3
가지 파장중에서도505 nm
에서평균속도가169.7%
증가하는것으 Fig. 8. Behavior analysis (heat-map, tracking) of mud shrimp Upogebia major upon illumination of Blue (465 nm), Cyan (505 nm), and Green (525 nm) LEDs. In contrast to the movement observed in the dark, the right side showed the tracking of the movement observed upon illumination of LEDS of different wavelengths as indicated.Dark
Adaptation area
(A) (A)
0.3m
0.33m
0.07m
0.57m
Camera
Violet (405 nm) Blue (465 nm) Cyan (505 nm) Green (525 nm) Amber (590 nm) Red (660 nm)
1μmole /m
2/s
10 μmole /m
2/s
50 μmole /m
2/s
Behavior analysis, Dark (1min) → Light (1min)
(465 nm) Blue
(505 nm) Cyan
Green
(525 nm)
갯벌 양식장 쏙의 광반응 분석
419
로나타났으며
, 465 nm
와525nm
는각각148.3%, 160.2%
의 결과를나타내었다.
이와마찬가지로히트맵분석결과도LED
점등시505 nm
에서가장활발한행동변화를나타내며,
쏙의 광반응시이동거리변화에서169.7%
로505 nm
에서가장높 게나타났다.
어류의광반응연구로는대표적인집어등포획어종인고등어
,
오징어의파장별광반응실험에서도마찬가지로해당생물의 시각수용체최대흡광파장영역인500 nm
영역근처에서가장 큰반응성을나타내었다.
또한, LED
를이용한갈치의행동분 석에서는청색광에대한반응이가장뛰어난것으로나타났다(Kim et al., 2016).
그동안진행되어온시각관련연구의경우 에는대부분어류에해당하는연구가대부분이었으며,
갑각류 의경우는현미분광측정법(microspectrophotometry)
과전기생 리학적(electrophysiology)
방법을통해연구가진행되었다.
보 고된연구내용으로는Mantis shrimps (Crustacea; Stomatop- oda; Gonodactylidae)
의광세포특성에대한연구가있으며,
현 재까지알려진구각목에서의망막주변시각색소의최대흡광 분포가평균504.4±12 nm
로나타났으며(Cronin et al., 1994a;
Cronin et al., 1994b), Orconectes virilis, Callinectes sapidus, Panulirus argus
의시각민감도분석결과,
각각565 nm, 507
nm, 510 nm
에서간상세포의최대흡광도를나타내는것을알수 있었다
(Goldsmith and Fernandez, 1968; Cummins and Goldsmith, 1981; Cummins et al., 1984).
이러한갑각류의시 각분석및간상세포의최대흡광도결과로볼때,
본실험에서의500 nm
근방에서반응을최대로유도하는결과와유사하게나타났으며이는수중투과정도와쏙간상세포의최대흡광파장 영역과의연관성이있을것으로판단된다
.
따라서,
이에따른쏙 의시각분석에관련된추가적인연구가필요하다고판단된다.
결론적으로쏙은평균적으로
505 nm
영역에서다른파장보 다더민감한반응을나타내는것을알수있었으며,
이는쏙의 시각과관련된시각세포와광반응과의상관관계분석이필요 할것으로판단된다.
쏙이인식하지못하는Red LED
는쏙의행 동을유발하지는않으므로쏙의야간행동을관찰하는데적절 한광환경을제시하는것으로판단된다.
따라서추가적인쏙의 시각분석을통하여광반응을유도하는최적의파장조건을확 립하면,
쏙의친환경적인구제에중요한연구자료가될것이다사 사
본연구는부경대학교자율창의학술연구비
(2016)
년에의해 수행되었습니다.
References
Armstrong DA, Dumbauld B and Doty D. 1989. Oyster culture and crab habitat: conflicts over use of the insecticide Sevin in coastal estuaries. Northwest Environ J 5, 185-187.
Buchanan DV, Bottom DL and Armstrong DA. 1985. The con- troversial use of the insecticide Sevin in Pacific Northwest estuaries: its effects on dungeness crab, Pacific oyster, and other species. In: Proceedings of the symposium on Dunge- ness Crab biology and management. Alaska Sea Grant Re- port. Anonymous, 401-417.
Choi SK, Kim SJ, Park DW, Kil GS, Choi CY and Song SB.
2010. Design and fabrication of an energy saving LED-fish- ing lamp. J Korean Soc Mar Eng 34, 515-521. https://doi.
org/10.5916/jkosme. 2010.34.4.515.
Choi SJ. 2006. Radiation and underwater transmission charac- teristics of a high-luminance Light-emitting Diode as the light source for fishing lamp. J Kor Fish Soc 39, 480-486.
https://doi.org/10.5657/kfas.2006.39.6.480.
Cronin TW and Marshall NJ. 1989. A retina with at least ten spectral types of photoreceptors in a mantis shrimp. Nature 339, 137-140. https://doi.org/10.1038/339137a0.
Cronin TW, Marshall NJ, Quinn CA and King CA. 1994a. Ul- traviolet photoreception in mantis shrimp. Vision Res 34, 1443-1452. https://doi.org/10.1016/0042-6989(94)90145-7.
Cronin TW, Marshall NJ and Caldwell RL. 1994b. The retinas of mantis shrimps from low-light environments (Crustacea;
Stomatopoda; Gonodactylidae). J Comp Physiol A 174, 607- 619. https://doi.org/10.1007/bf00217382.
Cummins D, Chen D and Goldsmith TH.1984. Spectral sensi- tivity of the spiny lobster Panulirus argus. Biol Bull 166, 269-276. https://doi.org/10.2307/1541448.
Cummins D and Goldsmith TH. 1981. Cellular identification of the violet receptor in the crayfish eye. J Comp Physiol 142, 199-202. https://doi.org/10.1007/bf00605738.
DeFrancesco J and Murray K. 2010. Pest Management Strategic Plan for Bivalves in Oregon and Washington. In: Summary of a workshop. Oregon State University, Washington D.C., U.S.A., 3-88.
Dumbauld BR, Holden DL and Langness OP. 2008. Do stur- geon limit burrowing shrimp populations in Pacific North- west Estuaries? Env Biol Fish 83, 283-296. https://doi.
org/10.1007/s10641-008-9333-y.
Estes PS. 1986. Cardiovascular and respiratory responses of the ghost shrimp, Callianassa californiensis Dana, to the pesti- cide carbaryl and its hydrolytic product 1-naphthol. Thesis, Oregon State University, Washington D.C., U.S.A.
Gao X, Zhang M, Li X, Song C and Liu Y. 2016. Effects of light quality and intensity on the growth, survival and metamor- phosis of Haliotis discus hannai Ino larvae. Aquaculture Res 48, 3369-82. https://doi.org/10.1111/are.13164.
Goldsmith TH and Fernandez HR. 1968. Comparative studies of crustacean spectral sensitivity. J Comp Physiol 60, 156- 175. https://doi.org/10.1007/bf00878449.
Herkül K, Kotta J and Paernoja M. 2011. Effect of physical dis- turbance on the soft sediment benthic macrophyte and inver- tebrate community in the northern Baltic Sea. Boreal Env
장준철
ㆍ
정종균ㆍ
허윤성ㆍ
송재희ㆍ
김종명420
Res 16, 209-219.
Hong JS. 2013. Biology of the mud shrimp Upogebia major (de Haan, 1841), with particular reference to pest manage- ment for shrimp control in manila clam bed in the west coast of Korea. Ocean Polar Res 35, 323-349. https://doi.
org/10.4217/opr.2013.35.4.323.
Jang JC, Choi MJ, Yang YS, Lee HB, Yu YM and Kim JM.
2016. Dim-light photoreceptor of chub mackerel Scomber japonicus and the photoresponse upon illumination with LEDs of different wavelengths. Fish Physiol Biochem 42, 1015-1025. https://doi.org/10.1007/s10695-015-0193-z.
Kim MK, An YL, Park SH, Oh TC, Kang HC and Park YS.
2016. Behavioral reaction of hairtail (Trichinus lepturus) to different colors of LED light. J Korean Soc Fish Technol 52, 183-190. https://doi.org/10.3796/ksft.2016.52.3.183.
Kinoshita K. 2002. Burrow structure of the mud shrimp Upogebia major (Decapoda: Thalassinidea: Upogebiidae). J Crust Biol 22, 474-480. https://doi.org/10.1163/20021975-99990255.
Lindsay C. 1961. Pesticide tests in the marine environment in the State of Washington. In: Proc Nat Shellfisheries Assoc 52, 87-97.
Liu W and Liu R. 2012. A new species of the genus Austinogebia Ngoc-Ho, 2001 (Crustacea, Decapoda, Gebiidea, Upogebi- idae) from northern China. Zootaxa 3243, 59-64. https://doi.
org/10.1163/15685403-00003444.
Migaud H, Cowan M, Taylor J and Ferguson HW. 2007. The effect of spectral composition and light intensity on mela- tonin, stress and retinal damage in post-smolt Atlantic salmon, Salmo salar. Aquaculture 270, 390-404. https://doi.
org/10.1016/j.aquaculture.2007.04.064.
Park KW, Song JH, Choi YS and An KH. 2013. Changes in den- sity and culture conditions of the Manila Clam Ruditapes philippinarum on the West coast of Korea. Korean J Malacol 29, 207-216. https://doi.org/10.9710/kjm.2013.29.3.207.
Rowden AA and Jones MB. 1993. Critical evaluation of sediment turnover estimates for Callianassidae (Decapoda: Thalas- sinidea). J Exp Mar Biol Ecol 173, 265-272. https://doi.
org/10.1016/0022-0981(93)90057-u.
Shin HS, Lee J and Choi CY. 2011. Effects of LED light spec- tra on oxidative stress and the protective role of melatonin in relation to the daily rhythm of the yellowtail clownfish,
Amphiprion clarkii. Comp Biochem Physiol A: Mol Integrat
Physiol 160, 221-228. https://doi.org/10.1016/j.cbpa.2011.06.002.
Shin M and Kim J. 2009. Introduction to LED packaging tech- nology. Books-hill, Seoul, Korea.
Wynberg RP and Branch GM. 1994. Disturbance associated with bait-collection for sandprawns (Callianassa kraussi) and mudprawns (Upogebia africana): long-term effects on the biota of intertidal sandflats. J Mar Res 52, 523-558.
https://doi.org/10.1357/0022240943077019.