- 2101 -
Characteristics of Photovoltaic I-V According to the Module Temperature
Ying Lee1, Yong-Sung Choi1, You-Sai Zhang2, Jong-Sun Hwang3, and Kyung-Sup Lee1 Department of Electrical Engineering, Dongshin University1
Institution of Electronic and Information, Jiangsu University of Science and Technology2 Jeonnam Provincial college3
Abstract - Solar energy is an extreme intermittent and inconstant energy source. This paper presents the analysis of photovoltaic I-V characteristics according to the module temperature. It shows that the result of the relationship between DC current and the module temperature of solar cell will be effects by the increasing irradiation.
1. Introduction
Developing the renewable solar energy source is an important measure to increase the energy supply capacity. However, because solar energy is an extreme intermittent and inconstant energy source, the electric power generated by the PV panel varies with the solar radiation and temperature. In order to improve the photovoltaic system efficiency and utilize the solar energy more fully, it is necessary to study the of photovoltaic I-V characteristics according to module temperature[1~2].
2. Experiment
The experimental solar array consists of 8EA modules which are made in single crystal silicon. The efficiency of the module is 16[%].
The specifications of the experimental device are as follows. The device rated power is 800[W], the maximum power PMPP is 100+
Wp±5[%], the voltage at MPP (maximum power point) is 34.5[V], the current at MPP is 2.90[A], the open-circuit voltage is 42.5[V], the short-circuit current Isc is 3.20[A]. The measured data of this paper include DC current[A], module temperature.
3. Result and Discussion
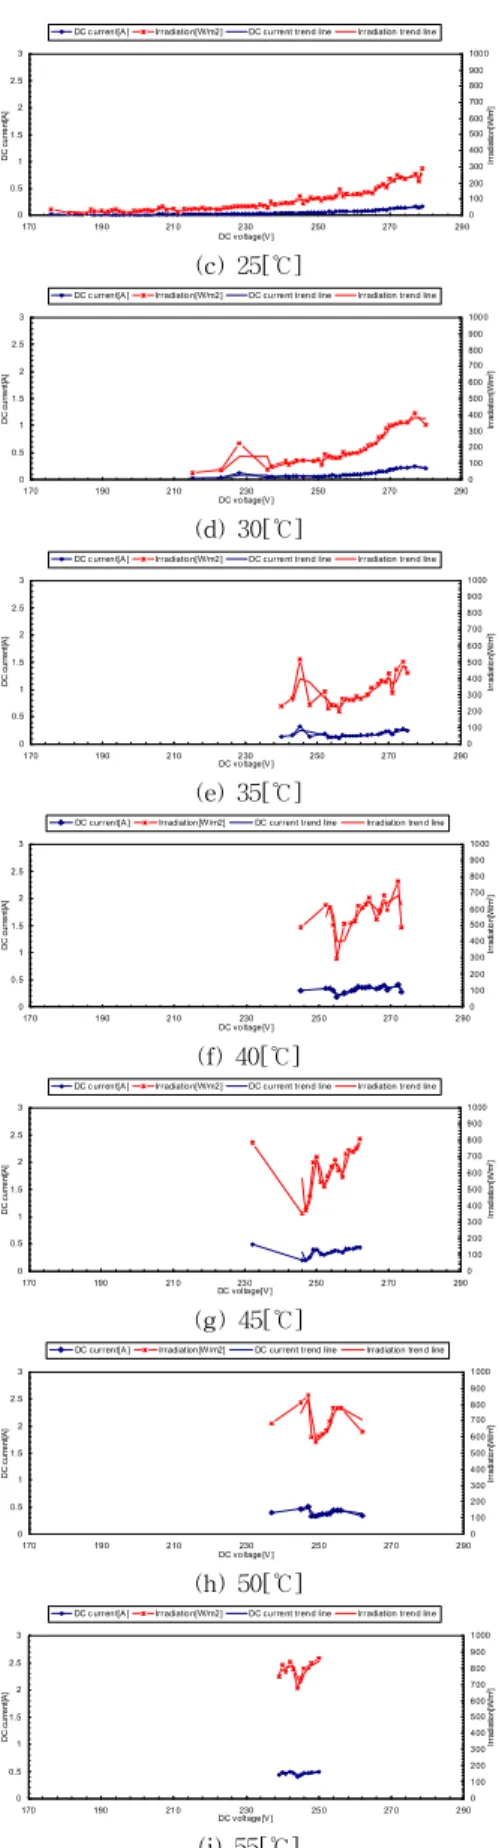
Fig. 1 presents the I-V characteristics according to the module temperature which is from 15[℃] to 55[℃]. Fig. 1 (a) shows the I-V characteristics according to the module temperature of 15[℃]. In this case, along with the increase of DC voltage from 193[V] to 313[V], the value of irradiation increases from 11[W/m2] to 757[W/m2] and the value of DC current increases from 0.012[A] to 2.026[A].
Fig. 1 (b) shows the I-V characteristics according to the module temperature of 15[℃]. In this case, along with the increase of DC voltage from 192[V] to 302[V], the value of irradiation increases from 25[W/m2] to 811[W/m2] and the value of DC current increases from 0.07[A] to 2.144[A].
Fig. 1 (c) shows the I-V characteristics according to the module temperature of 20[℃]. In this case, along with the increase of DC voltage from 188[V] to 300[V], the value of irradiation increases from 16[W/m2] to 513[W/m2] and the value of DC current increases from 0.038[A] to 1.386[A].
Fig. 1 (d) shows the I-V characteristics according to the module temperature of 25[℃]. In this case, along with the increase of DC voltage from 209[V] to 287[V], the value of irradiation increases from 30[W/m2] to 557[W/m2] and the value of DC current increases from 0.094[A] to 1.512[A].
Fig. 1 (e) shows the I-V characteristics according to the module temperature of 30[℃]. In this case, along with the increase of DC voltage from 260[V] to 286[V], the value of
irradiation increases from 181[W/m2] to 640[W/m2] and the value of DC current increases from 0.408[A] to 1.796[A].
Fig. 1 (f) shows the I-V characteristics according to the module temperature of 35[℃]. In this case, along with the increase of DC voltage from 254[V] to 278[V], the value of irradiation increases from 636[W/m2] to 881[W/m2] and the value of DC current increases from 1.868[A] to 2.482[A].
Fig. 1 (g) shows the I-V characteristics according to the module temperature of 40[℃]. In this case, along with the increase of DC voltage from 249[V] to 281[V], the value of irradiation increases from 554[W/m2] to 862[W/m2] and the value of DC current increases from 1.516[A] to 2.256[A].
Fig. 1 (h) shows the I-V characteristics according to the module temperature of 45[℃]. In this case, along with the increase of DC voltage from 246[V] to 261[V], the value of irradiation increases from 610[W/m2] to 935[W/m2] and the value of DC current increases from 1.78[A] to 2.698[A].
Fig. 1 (i) shows the I-V characteristics according to the module temperature of 50[℃]. In this case, along with the increase of DC voltage from 230[V] to 256[V], the value of irradiation increases from 724[W/m2] to 899[W/m2] and the value of DC current increases from 2.13[A] to 2.55[A].
From fig. 1, it seems that when the module temperature increases, the DC current increases. But actually, because when the irradiation increases, the DC current increases, the result of the relationship between DC current and the module temperature of solar cell will be effects by the increasing irradiation.
0 0.5 1 1.5 2 2.5 3
170 190 210 230 250 270 290
DC v oltage[V]
DC current[A]
0 100 200 300 400 500 600 700 800 900 1000
Irradiation[W/m2]
DC current[A ] Irradiation[W/m2] DC current trend line Irradiation trend line
(a) 15[℃]
0 0.5 1 1.5 2 2.5 3
170 190 210 230 250 270 290
DC voltage[V ]
DC current[A]
0 100 200 300 400 500 600 700 800 900 1000
Irradiation[W/m2]
DC current[A ] Irradiation[W/m2] DC current trend line Irradiation trend line
(b) 20[℃]
2009년도 대한전기학회 하계학술대회 논문집 2009. 7. 14 - 17
- 2102 -
0 0.5 1 1.5 2 2.5 3
170 190 210 230 250 270 290
DC voltage[V ]
DC current[A]
0 100 200 300 400 500 600 700 800 900 1000
Irradiation[W/m2]
DC c urrent[A ] Irradiation[W/m2] DC current trend line Irradiation trend line
(c) 25[℃]
0 0.5 1 1.5 2 2.5 3
170 190 210 230 250 270 290
DC voltage[V ]
DC current[A]
0 100 200 300 400 500 600 700 800 900 1000
Irradiation[W/m2]
DC c urrent[A ] Irradiation[W/m2] DC current trend line Irradiation trend line
(d) 30[℃]
0 0.5 1 1.5 2 2.5 3
170 190 210 230 250 270 290
DC voltage[V ]
DC current[A]
0 100 200 300 400 500 600 700 800 900 1000
Irradiation[W/m2]
DC c urrent[A ] Irradiation[W/m2] DC current trend line Irradiation trend line
(e) 35[℃]
0 0.5 1 1.5 2 2.5 3
170 190 210 230 250 270 290
DC voltage[V ]
DC current[A]
0 100 200 300 400 500 600 700 800 900 1000
Irradiation[W/m2]
DC current[A ] Irradiation[W/m2] DC current trend line Irradiation trend line
(f) 40[℃]
0 0.5 1 1.5 2 2.5 3
170 190 210 230 250 270 290
DC voltage[V ]
DC current[A]
0 100 200 300 400 500 600 700 800 900 1000
Irradiation[W/m2]
DC c urrent[A ] Irradiation[W/m2] DC current trend line Irradiation trend line
(g) 45[℃]
0 0.5 1 1.5 2 2.5 3
170 190 210 230 250 270 290
DC voltage[V ]
DC current[A]
0 100 200 300 400 500 600 700 800 900 1000
Irradiation[W/m2]
DC current[A ] Irradiation[W/m2] DC current trend line Irradiation trend line
(h) 50[℃]
0 0.5 1 1.5 2 2.5 3
170 190 210 230 250 270 290
DC voltage[V ]
DC current[A]
0 100 200 300 400 500 600 700 800 900 1000
Irradiation[W/m2]
DC c urrent[A ] Irradiation[W/m2] DC current trend line Irradiation trend line
(i) 55[℃]
Fig. 1 I-V characteristics according to module temperature
4. Conclusion
The objective of this paper is to analyze the photovoltaic I-V characteristics according to module temperature which is from 15[℃]
to 55[℃]. What’s more, from the results, we can know the factors effect the output of photovoltaic system and furthermore utilize the solar energy more fully.
[References]
[1] Hanju Cha, Sanghoey Lee, Jae-Eon Kim, “Design and implementation of 3kW Photovoltaic Power Conditioning System using a Current based Maximum Power Point Tracking,” Trans.
KIEE. Vol.57, No.10, OCT, pp.1796-1801 (2008).
[2] Jung-Hun So, Byung-Gyu Yu, Hye-Mi Hwang, Gwon-Jong Yu, Ju-Yeop Choi, “Performance Simulation Results for Photovoltaic Module Modeling,” Trans. KIEE. Vol.57, No.11, NOV, pp.1988-1993 (2008).