2020. 8. 제 59권, 제 3호, 217-235. August. 2020, Vol. 59, No. 3, 217-235.
217
한국 초등학생들의 성차:
TIMSS 2011 2015 수학 학업성취도 평가를 통한 분석
1)
황성환(서울가주초등학교, 교사)․여승현(University of Alabama, 조교수)
교신저자
Gender differences in Korean elementary students: An analysis of TIMSS 2011 and 2015 fourth grade mathematics assessment
Hwang, Sunghwan(Seoul Gaju Elementary School, [email protected]) Yeo, Sheunghyun(University of Alabama, [email protected])
Corresponding Author
초록
본 연구는 TIMSS 2011와 2015 수학 성취도 평가를 바탕으로 초등학교 4학년 남녀 간의 성차가 드러나는 문항들을 내용과 인지영역에 따라 분석하였다. 연구결과, 성차가 유의미하게 차이나는 20% 문항들에서 내용 영역별 성차를 보 면 남학생은 수와 측정영역에서 여학생은 도형영역에서 상대적으로 우위에 있는 것으로 나타났다. 또한 인지 영역별 성차를 보면, 남학생이 지식, 적용, 추론 영역에서 여학생보다 상대적인 우위에 있는 것으로 드러났다.
Abstract
This study examined Korean fourth-grade students’ performance by gender on the Trends in International Mathematics and Science Study(TIMSS) 2011 and 2015 mathematics assessment. We first identified items which had significantly higher mean scores by gender to decide which gender did better on a certain domain(domain-level analysis). Then, we examined the content of items(item-level analysis) to understand which items lead to gender differences in mathematics achievement. Our findings showed that about 80% of the items on both assessments did not show statistically significant differences between males and females. However, there were meaningful gender differences in the other 20% items. On both assessments, females had more items with significantly higher mean scores than males on the Shapes domain, and males had more those items on the Numbers and Measurement domains and all cognitive domains(Knowing, Applying, and Reasoning). In particular, females outperformed males on items related to identifying two- and three-dimensional shapes and drawing lines and angles and identifying them. Conversely, males had higher performance than females on items related to the pre-algebraic thinking, fractions and decimals, estimation of number differences, unit of length, and measuring time, height, and volume. The effect sizes for each item ranged from .12 to .33 and the mean effect size of all items across both assessments was .20, which indicated significant gender differences but small.
* 주요어: 성차, 수학 성취도, TIMSS, 수학 평가
* Key words: gender differences, mathematics performance, TIMSS, mathematics assessments
* 영문 사사: We would like to thank the International Association for the Evaluation of Educational Achievement(IEA) for giving us access to the TIMSS data (approval number IEA-19-036).
* Address: Department of Curriculum and Instruction, University of Alabama, Tuscaloosa, Alabama, USA
* ZDM Classification: C3, C4
* 2000 Mathematics Subject Classification: 97C40
* Received: June 3, 2020 Revised: June 29, 2020 Accepted: July 31, 2020
I. Introduction
Gender differences in mathematics achievement have received great attention from educators. Because students’ mathematics achievement influences their college major and career choices, determining domains and items leading to gender differences at the early stages is critical(Ganley & Vasilyeva, 2011; Lubienski
& Ganley, 2017). Studies examining Korea National Assessment of Educational Achievement(NAEA) and National Diagnostic Assessment of Basic Competency(NDABC) have documented that gender differences in mathematics achievements have been eliminated in Korean students at the elementary level and sometimes, females have higher mathematics performance than males(Jo, 2016; Ko, Do, & Song, 2008; Lee, 2019; Suh & Lee, 2012).
However, the results of the Trends in International Mathematics and Science Study(TIMSS) mathematics assessment are different from those of the national mathematics assessment. According to TIMSS 2011 and 2015 reports, the overall mean mathematics achievement of fourth-grade Korean males was significantly and continuously higher than females’(Mullis, Martin, Foy, & Hooper, 2016). These discrepancies in national and international assessments stemmed from different purposes of assessments and item characteristics(Ganley & Vasilyeva, 2011; Liu &
Wilson, 2009; Lubienski & Ganley, 2017). The purpose of national assessments is to examine students’
mathematical knowledge taught in the classroom and presented in the curriculum. On the other hand, the purpose of TIMSS, as an international assessment, is to analyze students’ knowledge, skills, and competency from a broader perspective by comparing student achievement to various countries(Grønmo, Lindquist, Arora, & Mullis, 2015). Hence, TIMSS is relatively less dependent on a certain curriculum, and it includes more novel and challenging items than national
assessments(Ganley & Vasilyeva, 2011; Grønmo et al., 2015). Given that TIMSS scores are widely used as a global benchmark and the instrument has been validated by international researchers(Grønmo et al., 2015; Mullis et al., 2016), examining gender differences with TIMSS data might provide new insights into gender differences among Korean students in terms of mathematics performance.
In Korea, some research has been conducted at the secondary level to investigate gender differences with TIMSS data(e.g., Lee & Park, 2015). However, few studies have used TIMSS data to examine gender differences in elementary students’ mathematics performance. Therefore, the purpose of this study is to examine the gender differences in Korean fourth graders on the TIMSS 2011 and 2015 mathematics assessment. Two research questions guided this study.
First, which domains and items have a gender gap?
Second, what are the strengths of males and females on the TIMSS mathematics assessment?
Examining the gender gap in the TIMSS mathematics assessment can contribute to the field of mathematics education as it relates to pedagogy and research on gender differences. First, understanding the gender gap can provide teachers with a more accurate understanding of each gender’s strengths and weaknesses in mathematics problem-solving. Teachers could then devise additional activities to equalize mathematics performance before a gender gap becomes more apparent. Second, researchers could gain new insight into the gender gap in mathematics achievement.
II. Literature Review
1. Gender Differences in Mathematics
Although gender differences in mathematics
achievement have narrowed in recent decades, women
are still underrepresented in science, technology,
engineering, and mathematics(STEM) fields(Cimpian, Lubienski, Timmer, Makowski, & Miller, 2016; Jo, 2016; Ministry of Science, ICT, & Future[MSIF], 2016). According to the Korean Education Statistics Service report(Korean Educational Development Institute[KEDI], 2018), the college entrance rate of female students has steadily increased, from 26.8% in 1985 to 43.2% in 2018. However, the number of female students selecting STEM-related majors is still lower than that of males. For example, among students majoring in engineering, females were 19.1%(KEDI, 2018). Moreover, women hold only 14.6% of STEM-related jobs(MSIF, 2016). These gender imbalances can reduce the workforce contributing to STEM fields, which negatively influences national economic growth and development.
Researchers have argued that gender differences in early mathematics performance affect one’s choice of college major and career later in life(Eccles & Wang, 2016; Ko et al., 2008; Lubienski & Ganley, 2017;
MSIF, 2016). A student’s early mathematics performance serves as a basis for acquiring new mathematical knowledge and influences later cognitive and affective development in mathematics(Lim & Jun, 2017; Zhu & Chiu, 2019). Hence, when female students realize that their mathematics performance is lower than their male counterparts at a young age, they are likely to devalue learning mathematics and spend more time studying other subjects(Cho & Hwang, 2019;
Ganley & Lubienski, 2016). Consequently, females tend to pursue non-STEM career paths.
Researchers have reported mixed findings regarding when the gender gap first appears. For example, U.S.
researchers have found that the gender gap in mathematics achievement emerges in kindergarten(Cimpian et al., 2016; Jordan, Kaplan, Olah, & Locuniak, 2006).
In examining the U.S. Early Childhood Longitudinal Study(ECLS) data for 1999(N = 21,399) and 2011(N = 18,170), which surveyed students from kindergarten to
the eighth grade, Cimpian et al.(2016) found that the gender gap in mathematics achievement became significant by early age and increased over time. More specifically, the 1999 and 2011 ECLS data showed that gender differences in mathematics achievement emerge in kindergarten and first grade, respectively, and that these differences were sustained over time. However, others did not find gender differences in mathematics achievement in elementary students(Hyde, Lindberg, Linn, Ellis, & Williams, 2008; Ponitz, Rimm-Kaufman, Brock, & Nathanson, 2009). Hyde et al.(2008) examined the U.S. National Assessment of Educational Progress data and found nonsignificant gender differences in mathematics at the elementary level.
Despite these mixed findings, researchers have mostly argued that gender differences in mathematics achievement widen according to the grade, becoming more evident during high school(Cimpian et al., 2016;
Else-Quest, Hyde, & Linn, 2010; Lubienski & Ganley, 2017).
In Korea, few scholars have examined gender differences in mathematics among kindergarteners and have reported no gender gap in mathematics achievement(Hwang & Cho, 2012; Park & Hong, 2019).
Park and Hong(2019) examined the 2014 Korea
Institute of Child Care and Education’s Panel Study
covering 1,002 preschoolers and found a nonsignificant
association between gender and mathematics
achievement. Similarly, researchers examining NAEA
data reported that elementary students no longer show
significant gender differences in overall mathematics
achievement and, rather, the initiation of such
differences begins in high school(Ko et al., 2008; Lee,
2009). However, authors examining gender differences
with TIMSS mathematics assessment data reported
significant gender differences in Korean fourth graders
and nonsignificant gender differences in eighth
graders(Mullis et al., 2016). In sum, gender differences
in mathematics achievement could vary based on the
types of assessment.
For uncovering the reasons behind gender differences in mathematics, researchers have focused on social factors such as parent and teacher expectations(Else-Quest et al., 2010; Hyde, 2014; Lim
& Han, 2016). According to the expectancy–value theory, for example, socializer beliefs and behaviors affect students’ expectancy of success and values in mathematics. For example, if parents believe that engineering would not be a good career for girls, their daughters tend to associate negative value in studying mathematics and reduce time spent studying mathematics, which results in both low expectancy of success in mathematics and low mathematics achievement(Eccles & Wang, 2016). Furthermore, Lim and Han(2016) examined 2012 Programme for International Student Assessment(PISA) data and found that variables related to students’ educational context such as the socioeconomic status of the school and parents, the teacher–student relationship, and extracurricular activities affected the gender gap in mathematics achievement.
Focusing on individual psychological factors, other researchers have argued that higher levels of anxiety and lower levels of self-efficacy in mathematics for girls than boys contributed to their low mathematics achievement(Ganley & Lubienski, 2016; Lee & Hwang, 2019). Other researchers have explained that differential performance by gender was influenced by teachers’ instructional practices, curriculum materials, and the school system(Boaler, 1997; Kim & Law, 2012;
Lubienski & Ganley, 2017). Regarding the effects of instructional practices, Boaler(1997) reported that when teachers encouraged students to devise their own ideas, collaborate with peers, and solve and discuss challenging tasks with their peers, the gender gap in mathematics performance was reduced. Moreover, the use of technology(Ursini & Sánchez, 2008) and digital textbooks(Ryu, 2008) in mathematics classrooms
favored boys.
Focusing on the influence of curricular materials, researchers have found that when activities and curriculum content are more familiar to a certain gender(male- or female-oriented materials), that group of students showed better performances(Weldeana, 2015). Regarding the influence of the school system, Kim and Law(2012) examined the 2006 PISA data and concluded that single-sex schooling disadvantaged girls’ mathematics achievement.
2. Gender Differences in National Mathematics Assessments
Studies examining gender differences in the content domain have commonly reported that males have better performance in Measurement than females, whereas females outperform males on Shapes(Jo, 2016;
Kim, 2007; Ko et al., 2008; Suh & Lee, 2012). Ko et al.(2008) examined the 2004-2006 NAEA mathematics assessment data at the item-level. They first examined mean differences by gender on individual items and analyzed the content of items with high mean differences. They found that, generally, elementary female students have higher achievement than males in number and operations, shapes, probability and statistics, and variables and expressions. Meanwhile, males have higher performance than females in measurement and patterns and functions. Similarly, Jo(2016) examined 2010–2012 NAEA data and reported that gender differences in numbers and operations, problem-solving, and probability and statistics were not consistent across the 3 years; in some years, females outperformed males on those domains, and in other years, they did not.
However, Jo found that males and females showed consistently better performance with measurement and shapes, respectively.
Regarding the cognitive domains, studies have
found that males outperform females on high cognitive
demand items, and females perform better than males on low cognitive demand items(Jo, 2016; Kim, 2007;
Kwon & Park, 1995; Suh & Lee, 2012). Suh and Lee(2012) developed a mathematics assessment based on the NAEA mathematics assessment and gave it to 261 sixth graders(134 boys and 127 girls; note that, in Korea, the elementary school consists of grades 1 to 6). The authors found that although there were no significant differences in overall mathematics achievement, the mean of individual items varied according to cognitive demand. When an item required serial computation and complex substitution skills, males tended to have higher performance than females.
Similarly, in a study examining the NDABC, Kim(2007) found gender differences according to the cognitive domain of items. In the basic computation items, more males failed to pass the NDABC than females, whereas more females failed to pass the assessment of higher cognitive demand items(i.e., reasoning and problem-solving). More recently, Jo(2016) reported similar findings in a study examining NAEA 2010–2012 data.
3. Gender Differences in TIMSS Mathematics Assessment
The results of TIMSS mathematics assessments indicated that on average, Korean elementary males significantly outperformed females on TIMSS 2011 and 2015(Mullis et al., 2016), which are different from those of the national mathematics assessment (e.g., Ko et al., 2008). Table 1 shows descriptive statistics of Korean elementary students by gender on the two TIMSS assessments. The overall mean of the TIMSS mathematics assessment was 500 with a standard deviation of 100 based on item response theory scaling(Mullis et al., 2016). The mean differences between females and males were 7 points on the TIMSS 2011(average scores of 601 for females, 608 for males) and 8 points in 2015(604 for females, 612
for males).
Regarding the content domain, there was a similar gender gap in both assessments [Table 2]. Males had significantly higher achievement with the Numbers domain than females; males’ score was 10 points higher on the TIMSS 2011(600 for females, 610 for males) and 9 points higher on the TIMSS 2015(605 for females, 614 for males). Meanwhile, there was no significant difference in Geometric shapes and Measures and Data display. Note that TIMSS did not provide separate mean scores for Shapes and Measurement; instead, it only presented mean scores for the geometric shapes and measures as a single domain.
Female Male
TIMSS
N M
(SD
)N M
(SD
)2011 2,086 601 (65.9) 2,248 608(70.4) 2015 2,258 604 (64.9) 2,411 612(69.4)
*p < .05.
[Table 1] Overall TIMSS mathematics performance by gender
Furthermore, the gender differences in the cognitive domain had similar results on the TIMSS 2011 and 2015 assessments [Table 3]. On the TIMSS 2015, males showed significantly higher performance on Knowing(624 for females, 630 for males), Applying(592 for females, 599 for males), and Reasoning(612 for females, 624 for males). Considering all domains, there was no single domain in which females had significantly higher mean scores than males.
4. Current Study
To summarize, in national assessments, Korean
elementary males show better performance on
Measurement and high cognitive demand items,
whereas females show better performance on Shapes
and low cognitive demand items(Jo, 2016; Ko et al.,
2008; Kwon & Park, 1995; Lee, 2009; Suh & Lee,
2012). However, as mentioned earlier, we know little
Number Geometric shapes and Measures Data display
TIMSS Female
M
(SD
) MaleM
(SD
) FemaleM
(SD
) MaleM
(SD
) FemaleM
(SD
) MaleM
(SD
)2011 600(71.1) 610(74.6) 606(65.8) 608(70.5) 607(65.4) 599(69.1)
2015 605(73.1) 614(77.3) 608(61.6) 612(67.1) 606(67.1) 608(72.3)
p < .05.
[Table 2] Mathematics performance in content domains by gender
Knowing Applying Reasoning
TIMSS Female
M
(SD
) MaleM
(SD
) FemaleM
(SD
) MaleM
(SD
) FemaleM
(SD
) MaleM
(SD
)2011 613(66.4) 616(70.7) 597(62.6) 602(66.9) 597(81.7) 608(85.0)
2015 624(77.2) 630(81.3) 592(61.6) 599(65.4) 612(80.4) 624(86.0)
p < .05.
[Table 3] Mathematics performance in cognitive domains by gender
about the gender differences of Korean elementary students in international assessment. Therefore, in this study, we examined gender differences in the mathematics performance of fourth-grade students using the TIMSS 2011 and 2015 mathematics assessments. Our investigation enhances the understanding of gender differences in more challenging assessments.
Ⅲ. Methods 1. Participants
We analyzed TIMSS 2011 and 2015 mathematics assessment data taken from the International Association for the Evaluation of Educational Achievement(IEA). Our study examined Korean fourth graders’ responses to mathematics items for both assessments. The TIMSS researchers selected participants using a two-stage cluster sampling design. They selected each school from a nationally represented sample at the first stage and then one or more classes from each school at the second stage(Mullis, Martin, Foy, & Arora, 2012; Mullis et al., 2016). The number of Korean students in each year was 4,334 in 2011(2,086 females and 2,248 males) and
4,669 in 2015(2,258 females and 2,411 males).
2. Instrument
The TIMSS mathematics assessment included several similarly designed booklets. Students were asked to use a booklet containing 23 to 29 items and each item was distributed to a similar number of students(about 600, half male and half female). The
TIMSS 2011 and 2015 fourth-grade mathematics assessment included a total of 180 and 179 items, respectively. Each item was classified across two domains: the content and cognitive domains(Grønmo et al., 2015; Mullis, Martin, Ruddock, O’Sullivan, &
Preuschoff, 2009). The content domain includes Number, Geometric Shapes and Measures, and Data display. The Number domain includes whole number, fractions and decimals, number sentences with whole numbers, pre-algebraic thinking, and patterns and relationships. The geometric shapes and measures domain contains points, lines, and angles and two- and three-dimensional shapes. The data and display domain includes reading and interpreting data and organizing and representing data.
Meanwhile, we reassigned the items in the
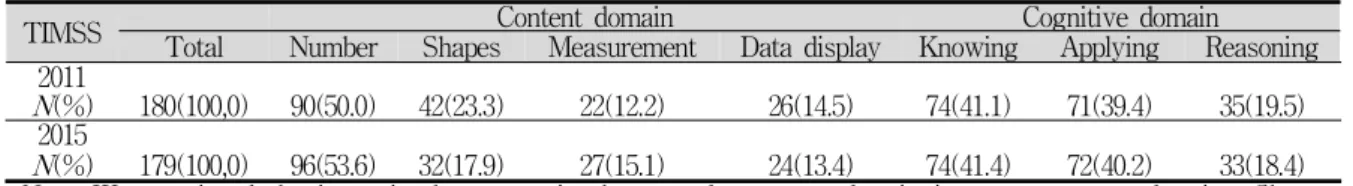
TIMSS Content domain Cognitive domain
Total Number Shapes Measurement Data display Knowing Applying Reasoning N(%) 2011 180(100,0) 90(50.0) 42(23.3) 22(12.2) 26(14.5) 74(41.1) 71(39.4) 35(19.5) N(%) 2015 179(100,0) 96(53.6) 32(17.9) 27(15.1) 24(13.4) 74(41.4) 72(40.2) 33(18.4)
Note. We reassigned the items in the geometric shapes and measures domain into two separate domains: Shape, Measurement.[Table 4] Item distribution across content and cognitive domains
[Fig. 1] Data analysis process
geometric shapes and measures domain into two separate domains: Shape, Measurement. As previous studies reported gender differences with Shapes and Measurement(Jo, 2016; Kim, 2007; Ko et al., 2008), it was reasonable to examine them separately. We independently coded all items of geometric shapes and measures in two assessments, then met to discuss any differences and established consensus. Hence, we were in full agreement on the categorization of domains. Table 4 shows the number of items of the two assessments in each domain.
The cognitive domain consists of Knowing, Applying, and Reasoning. The Knowing domain asks basic mathematics knowledge, including facts, concepts, and procedures. The Applying domain evaluates students’ ability to apply mathematical knowledge to solve problems. The Reasoning domain contains items analyzing unfamiliar situations and complex contexts and solving multistep problems. The items in the Knowing domain were regarded as low cognitive demanding items, and the Reasoning and Applying domains were generally regarded as high cognitive demand items(Mullis et al., 2009). As shown
in Table 4, the Number domain was half for the items and the Knowing and Applying domains had similar numbers of items.
3. Data Analysis
We analyzed the TIMSS data through three steps.
Figure 1 shows our data analysis process. First, we
recoded students’ responses following the TIMSS item
scoring method(Mullis & Martin, 2013). For the
multiple choice(MC) and constructed response(CR)
items, which contain one correct answer, we
dichotomously scored items; fully correct responses
were coded as 1, and others were coded as 0. For the
double-point CR items, we recoded student’s incorrect,
partial credit, full credit responses as 0, 1, and 2,
respectively. There were nine double-point CR items
in 2011 and 2015 TIMSS, respectively. Note that,
TIMSS researchers also used 0 and 1 score levels for
MR and CR items and 0, 1, and 2 score levels for
double-point CR items(Mullis & Martin, 2013). Then,
we calculated the mean and standard deviation of each
item by gender and then implemented t-test to find
significant mean differences by gender.
Second, we identified items which had significantly higher mean scores by gender to decide which gender did better on a certain domain(domain-level analysis).
Furthermore, we calculated the effect size of all mean differences indicated by Cohen’s d(Cohen, 1988) by dividing the mean difference between males and females by the pooled standard deviation of the two groups in order to examine the magnitude of gender differences. Generally, the d values of .20, .50, and .80 were regarded as small, medium, and large effect sizes, respectively. When the effect sizes are smaller than .10(d <.10), it was regarded as negligible or close to a zero-effect size(Else-Quest et al., 2010). In order words, the effect sizes the same or above .10 indicate a significant magnitude difference between boys and girls. Third, we examined the content of items with significant mean differences and effect sizes (item-level analysis). This process helped us understand which items lead to gender differences in mathematics achievement and the different strengths of males and females.
Ⅳ. Results
1. Domain-Level Analysis
1) Gender Favoring Items by Content Domains We first examined gender favoring items by content domains. Because we divided geometric shapes and measure items into Shapes and Measurement separately, the content domain included four sub-domains(Number, Shapes, Measure, and Data display). Table 5 shows the distribution of TIMSS 2011 and 2015 items which are categorized by non-gender favoring, male favoring, and female favoring items. The non-gender favoring items refer to items which did not have a significant mean difference between males and females. On the other hand, the male and female favoring items refer to items which had a significant mean difference
compared to another gender.
TIMSS Number Shapes Measurement Data display 2011
Non-gender
favoring(144 items) 67(74.4) 37(88.1) 17(77.3) 23(88.5) Male favoring
(27 items) 20(22.3) 1(2.4) 5(22.7) 1(3.8) Female favoring
(9 items) 3(3.3) 4(9.5) 0(0.0) 2(7.7) Total
(180 items) 90(100) 42(100) 22(100) 26(100) 2015
Non-gender
favoring(144 items) 79(82.3) 23(71.9) 23(85.2) 19(79.2) Male favoring
(25 items) 13(13.5) 4(12.5) 4(14.8) 4(16.7) Female favoring
(10 items) 4(4.2) 5(15.6) 0(0.0) 1(4.1) Total
(179 items) 96(100) 32(100) 27(100) 24(100) [Table 5] Distribution of favoring items by content domains
Of the 180 items in TIMSS 2011, the mean differences in the 144 items(80%) were not statistically significant. In particular, the majority of items on the Data display(88.5%) and Shape(88.1%) domains showed non-gender favoring characteristics. There was relatively less gender favoring items on the Number(74.4%) and Measurement(77.3%) domains.
Specifically, males had more items with higher mean scores on the Number domain(22.3% for males, 3.3%
for females) and on the Measurement domain(22.7%
for males, 0% for females). However, females had more items with higher mean scores on the Shapes domain(2.4% for males, 9.5% for females) and on the Data display domain(3.8% for males, 7.7% for females).
Content domain analysis of the TIMSS 2015 data
showed similar patterns. There was no significant
mean difference in the 144 items out of 179 items(80%). Of the 179 items, males had significantly higher mean scores than females on 25 items, and females had significantly higher mean scores than males on 10 items. However, the pattern of distribution of non-gender favoring items was changed. The Measurement domain(85.2%) and the Number domain(82.3%) had more non-gender favoring items compared to 2011. On the Data display domain, the numbers of male favoring items were flipped. In TIMSS 2011, the male favoring items(3.8%) was less than female favoring items(7.7%). However, in TIMSS 2015, the male favoring items(16.7%) had been increased whereas the female favoring ones(4.1%) had been decreased. It is also interesting that the gap between male and female favoring items on the Number domain was getting smaller than 2011(17 items in 2011 and 9 items in 2015). However, there was no female favoring item in the Measurement domain consistently for both TIMSS 2011 and 2015.
2) Gender Favoring Items by Cognitive Domains Table 6 shows the distribution of gender favoring items depending on the cognitive domains (Knowing, Applying, and Reasoning). Overall, the number of male favoring items was greater than female favoring ones(27 items for males, 9 items for females). In TIMSS 2011, the Reasoning domain(57.2%) had more gender favoring items than the other two domains(85.1% for Knowing and 85.9% for Applying).
Specifically, there was a huge gap between male and female favoring items on Applying(12.7% for males, 1.4% for females) and Reasoning(34.3% for males, 8.5% for females) domains. However, the gap on Knowing domain was small(8.1% for males and 6.8%
for females).
In TIMSS 2015, the non-gender favoring items has the same pattern as TIMSS 2011. Regarding gender favoring items, males still had more items with
significantly higher mean scores than females across the three domains: Knowing(13.5% for males, 5.4% for females), Applying (9.7% for males, 5.6% for females), and Reasoning (24.2% for males, 6.1% for females).
Interesting changes compared to TIMSS 2011 was the growing gap in the Knowing Domain. The male favoring items increased(8.1% to 13.5%), whereas the female favoring slightly decreased (6.8% to 5.4%). On the other hand, the difference between gender favoring items on the other two domains was decreasing.
TIMSS Knowing Applying Reasoning 2011
Non-gender
favoring(144 items) 63(85.1) 61(85.9) 20(57.2) Male favoring
(27 items) 6(8.1) 9(12.7) 12(34.3) Female favoring
(9 items) 5(6.8) 1(1.4) 3(8.5)
Total
(180 items) 74(100.0) 71(100.0) 35(100.0) 2015
Non-gender
favoring(144 items) 60(81.1) 61(84.7) 23(69.7) Male favoring
(25 items) 10(13.5) 7(9.7) 8(24.2) Female favoring
(10 items) 4(5.4) 4(5.6) 2(6.1)
Total
(179 items) 74(100.0) 82(100.0) 33(100.0) [Table 6] Distribution of favoring items by cognitive domains
In sum, about 80% of the items did not show statistically significant differences between males and females both in TIMSS 2011 and TIMSS 2015.
Regarding the other 20% items, however, there was
more male favoring items in which males performed
better than females in the Number and Measurement
domains, and all cognitive domains(Knowing, Applying,
and Reasoning), whereas females performed better
than males in the Shapes domain across both
assessments.
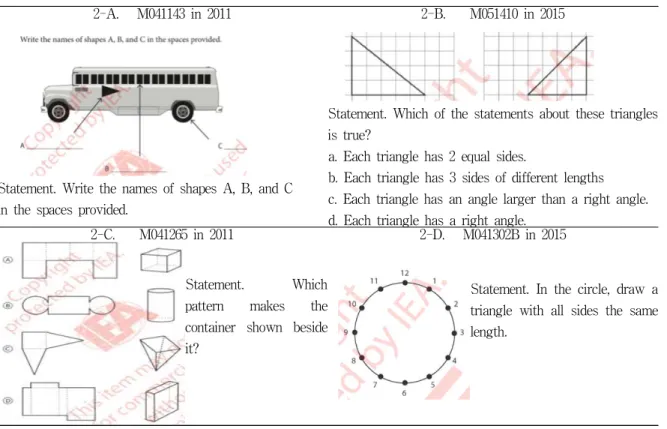
2-A. M041143 in 2011 2-B. M051410 in 2015
Statement. Write the names of shapes A, B, and C in the spaces provided.
Statement. Which of the statements about these triangles is true?
a. Each triangle has 2 equal sides.
b. Each triangle has 3 sides of different lengths c. Each triangle has an angle larger than a right angle.
d. Each triangle has a right angle.
2-C. M041265 in 2011 2-D. M041302B in 2015
Statement. Which pattern makes the container shown beside it?
Statement. In the circle, draw a triangle with all sides the same length.
[Fig. 2] Sample female-favoring items
2. Item-Level Analysis
We analyzed different strengths of females and males in mathematics performance and we also looked at the characteristics of female- and male-favoring items, which had significant mean differences and effect sizes. The effect sizes for each item ranged from .12 to .33. The mean effect size of all items with significant mean differences was .20. As discussed in the above, effect sizes between .10 and .20 indicate small but significant(non-negligible) mean differences between boys and girls(Else-Quest et al., 2010).
Tables 6 and 7 show sample items favoring females and males, respectively. Appendices from A to D show all items favoring each gender for both assessments. Tables 7 and 8 show sample items favoring females and males, respectively. Appendices from A to D show all items favoring each gender for
both assessments.
1) Strengths of Females’ Mathematics Performance First, females outperformed males on items identifying two- and three-dimensional shapes(items M041143 and M041265 in 2011 and M051410 in 2015).
Figure 2 shows the sample items. For example, item M041143 in 2011(Shapes and Knowing; see Figure 2-A; d = .22) asked students to identify two-dimensional shapes in the picture using appropriate language(triangle, rectangular or quadrilateral, and circle). Similarly, item M051410 in 2015(Shapes and Knowing; see Figure 2-B; d = .16) asked students to select the correct statement about two triangles; they were both right triangles, but one of them was an isosceles triangle.
That is, students compared two two-dimensional
shapes that were different in sizes and lengths but had the same number of sides and angles.
Furthermore, item M041265 in 2011(Shapes and Reasoning; see Figure 2-C; d = .19) asked students to identify three-dimensional shapes using nets made of rectangles, triangles, and circles. To solve this problem, students had to understand the relationship between polygons in coordinate planes and vertices in three-dimensional shapes.
Second, females were good at drawing lines and angles and identifying them(items M041135 and M041160B in 2011 and items M041302B, M061024, M061081B, M061236 in 2015). For example, item M041302B in 2015(Shapes and Applying; see Figure 2-D; d = .19) asked students to draw a triangle with all sides the same length(equilateral triangle).
Moreover, females had better performance than males on item M041135(Shapes and Knowing) in 2011, which asked students to draw a pair of parallel lines.
2) Strengths of Males’ Mathematics Performance First, males were good at pre-algebraic thinking in which generalizing operations and operating unknown quantities. The five items showing males’ higher performance than females’(items M031346A, M031346B, M031346C, M031379, and M031380 in 2011) asked students to use variables with mathematic expressions.
Students could write expressions and equations following the statements and use the equations to solve problems. Moreover, students were expected to understand the relationships between variables by using two equations. For example, item M031346A(Numbers and Applying; see Figure 3; d = .17) showed pictures and asked, “Becky had 5 animal cards to trade for cartoon cards. How many cartoon cards would she get?” Students could construct a table describing quantities that were in equivalent ratios with equations, such as 1 animal card = 2 cartoon cards and 5 animal cards = 10 cartoon cards.
Similarly, item M031380(Numbers and Reasoning; d = .23) asked, “Brad had 8 cartoon cards to trade for sports cards. How many sports cards would he get?”
To solve this problem, students might use proportional reasoning and maintain the quality of both sides of an equation, such as 1 animal card = 2 cartoon cards; 2 animal cards = 3 sports cards, so 4 cartoon cards = 3 sports card then, 8 cartoon cards = 6 sports cards.
Similarly, item M031185(Numbers and Reasoning; d = .17) in 2011 asked students to find out the distance between two towns using algebraic thinking. The item provided basic scale information about the relationship between 1 cm on a map and real distances(1 cm represents 4 km). Then, it asked students to find the real distance between towns, which was represented as 8 cm on a map.
Second, males outperformed females on the
measurement domain. They had higher mean scores
than females in items related to measurement
units(items M051061A and M051061Z in 2011 and
M051061A, M051061B, and M051061Z in 2015) and
time measurement(items M051055 in 2011 and
M051045 and M051055 in 2015), height(items M041048
and M041191 in 2011), and volume(item M051129 in
2011). For example, item M051061Z in
2015(Measurement and Knowing; d = .24) asked
students to fill in the blank using mm, cm, m, and
km. Students were expected to understand the relative
sizes of measurement units within a single system of
measurement from a smaller unit to a larger unit. The
three questions were “The baby is 490 ( ) long,” “The
car is 4 ( ) long,” and “The walk through the forest
was 3 ( ) long.” Moreover, item M051055 in
2015(Numbers and Applying) asked students to
measure the time intervals between 11:06 p.m. and
7:52 a.m.: “A train leaves A city at 7:52 a.m. and
arrives at B city at 11:06 p.m. How long does it
take?” Students need to know the relationship between
minutes and hours and need to know how to subtract
Year Item Domain Description Mean
d Item Male Fem- ale Differ- type
ences
2011 M041135 S Knowing A pair of parallel lines 0.95 0.99 0.04
0.23 MC 2011 M041143 S Knowing Identify shapes in the picture 0.65 0.75 0.09
0.22 CR 2011 M041265 S Reasoning Net with its 3-D figure 0.71 0.79 0.08
0.19 MC 2015 M041302
B S Reasoning What points did you connect? 0.73 0.80 0.07
0.19 CR 2015 M051410 S Knowing Statements about the triangles 0.80 0.87 0.07
0.16 MC
Note. S refers to the Shapes domain. Each item was solved by about 600 students(both males and females about 300).d
indicates Cohen’sd
. MC and CR refer to a multiple choice and constructed response item, respectively. All female favoring items are presented in Appendices A and B. p
< .05; p < .01.
[
Table 7] Sample Female Favoring Items on the TIMSSYear Item Domain Description Mean
d Item
Male Fem- ale Differ- type ences
2011 M031185 N Reasoning Distance between towns 0.88 0.82 0.06
0.17 MC 2011 M031346A N Applying Trading cards cartoon cards 0.80 0.73 0.07
0.17 CR 2011 M031380 N Reasoning Trading cartoon cards 0.42 0.31 0.11
0.23 CR 2011 M051052 N Knowing Number closest in size to
5,341 0.85 0.78 0.07
0.18 MC
2015 M041046 N Knowing Which is the largest fraction 0.74 0.67 0.07
0.15 MC
2015 M041087 N Knowing Add 0.36 + 0.77 0.95 0.91 0.04
0.15 CR
2015 M051017 N Knowing Estimate for 52,093–4,136 0.86 0.76 0.10
0.26 MC 2015 M051055 N Applying Trip from Newtown to
Oldtown 0.47 0.33 0.14
0.29 CR
2015 M051061Z M Knowing Units of length(derived) 0.51 0.39 0.12
0.24 CR
Notes. N and M refer to Number and Measurement domains, respectively.d
indicates Cohen’sd
. MC and CR refer to a multiple choice and constructed response item, respectively. All males favoring items are presented in Appendices C and D. p
< .05; p
< .01.[Table 8] Sample Male Favoring Items on the TIMSS
Statement. The town fair had a booth where people could trade cards.
1 animal card is worth 2 cartoon cards.
2 animal cards are worth 3 sports cards.
[Fig. 3] Sample Male Favoring Item (M031346A in TIMSS 2011)
hours and minutes to solve this problem.
Third, males outperformed females in fraction- and decimal-related items; males had higher mean scores than females on five items in 2011(M041046, M051030, M051070, M051098, and M051103) and five items in 2015(M041046, M041087, M051030, M051098, and M061039). Item M041046 in 2015(Numbers and Knowing; d = .15) asked students to compare the sizes of unit factions, including 1/2, 1/3, 1/4, and 1/5.
For this problem, students were required to understand that the size of the denominator is the number of the factional part of the whole size. Students might notice the relative size of unit fractions focusing on the same numerators but the different denominators without using subtractions. For example, 1/2 of a square indicated 1 part of a square divided into 2 equal parts, and 1/3 indicated 1 part of a square divided into 3 equal parts; hence, 1/2 was larger than 1/3. Moreover, item M041087 in 2015(Numbers and Knowing; d = .15) asked students to add two decimal numbers(0.36+0.77).
Although the mean scores of this item were higher than .90 for both males( .95) and females( .91), the difference was significant.
Fourth, males were good at estimating number differences. Two items in 2011(M041289 and M051052) and two items in 2015(M051017 and M051052) asked students to find the closest number in size to a given number. For example, item M051017 in 2015(Numbers and Knowing; d = .26) required students to estimate the difference between 52,093 and 4,136, and the options presented were 10,000, 20,000, 40,000, and 50,000. This item did not require students to subtract accurately; instead, it required students to subtract 4,136 from 52,093 and then to make reasonable estimates to find the closet number using mental computation. Similarly, item M051052 in 2011(Numbers and Knowing; d = .18) asked students to find the closest number in size to 5,341 by estimating differences.
Ⅴ. Conclusion
Although previous researchers have examined the gender gap using Korean national assessment data, none have examined the gender gap in mathematics achievement of Korean elementary students at the item-level using TIMSS data. Therefore, this study examined the gender differences in Korean fourth graders on the TIMSS 2011 and 2015 mathematics assessment. The findings showed that about 80% of the items did not show statistically significant differences between males and females. However, there were significant gender differences in the other 20%
items.
1. Gender Differences by the Content and Cognitive Domain
Regarding the domain-level analysis, we found meaningful differences by gender. On both assessments, females had more items with significantly higher mean scores than males on the Shapes domain, and males had more those items on the Numbers and Measurement domains and all cognitive domains(Knowing, Applying, and Reasoning).
Our item-level analysis revealed that females outperformed males on identifying two- and three-dimensional shapes and drawing lines and angles and identifying them. Conversely, males had higher performance than females on items related to the Number domain(pre-algebraic thinking, fractions, and decimals, and estimation of number differences) and the Measurement domain(unit of length and measuring time, height, and volume).
The effect sizes for each item ranged from .12 to
.33 and the mean effect size of all items across both
assessments was .20, which was significant gender
differences but small. However, this finding is
contradicted with the results of a recent study by
Ghasemi, Burley, and Safadel(2019). The study
examined gender differences in fourth graders’
mathematics performance 48 countries using TIMSS 2015 data and found that the mean weighted effect size of all students was .017, which indicated near zero gender differences(Else-Quest et al., 2010).
Although the effect size of the TIMSS items between Korean males and females was not large, Korean fourth graders showed relatively evident gender differences in mathematics achievement compared to the international average.
There might be various factors influencing difference performance by gender, such as cognitive ability, self-efficacy beliefs, low parental expectations, home backgrounds, and occupational interests(Cimpian et al., 2016; Eccles & Wang, 2016; Hyde, 2014; Lim &
Han, 2016; Lubienski & Ganley, 2017). Further studies are needed to understand varied student performance in the content and cognitive domain.
2. Discussion
Considering the gender differences in the TIMSS mathematics assessment, teachers should concern about equitable teaching practices to ensure that both gender students access high-quality mathematical instructions to promote their learning potential.
Regarding the content domain, teachers can differentiate tasks related to gender performance. For example, teachers can provide a task involved in the use of equations and variables in order to enhance students’ pre-algebraic thinking or proportional reasoning. In addition, teachers can encourage students to engage in reasoning activities with multiple strategies. For example, teachers might present unconventional items and ask females to solve them using their own reasoning to enhance their problem solving abilities in novel items. Lastly, teachers should be aware of each gender’s strengths and weaknesses in mathematics problem-solving.
Although our findings add to the current literature
on gender differences in mathematics performance, our study had several limitations. First, our study only used a single grade level of TIMSS data to look at fourth-grade international mathematics assessments. It is possible that our findings might have been different if we had analyzed other international data with students from different grades. Second, similar to previous studies examining gender differences in mathematics achievement(e.g., Liu & Wilson, 2009), this study did not consider other factors affecting gender differences. While others may yield gender gap(e.g., social-cultural factors), we only focused on the association between gender gap and item types.
Therefore, readers should interpret our study with caution.
References
Boaler, J. (1997). Reclaiming school mathematics: The girls fight back.
Gender and Education, 9
(3), 285–306.Cho, E. H., & Hwang, S. H. (2019). Exploring changes in multi-ethnic students’ mathematics achievement motivation: A longitudinal study using expectancy-value theory.
The Mathematical Education, 58
(1), 101-120.Cimpian, J. R., Lubienski, S. T., Timmer, J. D., Makowski, M. B., & Miller, E. K. (2016). Have gender gaps in math closed? Achievement, teacher perceptions, and learning behaviors across two ECLS-K cohorts.
AERA Open, 2
(4). 1-19.Cohen, J. (1988).
Statistical power analysis for the behavioral sciences
. Hillsdale, NJ: Lawrence Erlbaum Associates.Eccles, J. S., & Wang, M. (2016). What motivates females and males to pursue careers in mathematics and science?
International Journal of Behavioral Development, 40(
2), 100-106.Else-Quest, N. M., Hyde, J. S., & Linn, M. C. (2010).
Cross-national patterns of gender differences in mathematics:
A meta-analysis.
Psychological Bulletin, 136
(1), 103-127.Ganley, C. M., & Lubienski, S. T. (2016). Mathematics confidence, interest and performance: Gender patterns and reciprocal relations.
Learning and Individual
Differences, 47
, 182-193.Ganley, C. M., & Vasilyeva, M. (2011). Sex differences in the relation between math performance, spatial skills, and attitudes.
Journal of Applied Developmental Psychology, 32
(4), 235-242.Ghasemi, E., Burley, H., & Safadel, P. (2019). Gender differences in general achievement in mathematics: An international study.
New Waves-Educational Research and Development Journal, 22
(1), 27-54.Grønmo, L., Lindquist, M., Arora, A., & Mullis, I. (2015).
TIMSS 2015 mathematics framework.
Retrieved Jun. 3, 2020, from:https://timss.bc.edu/timss2015/downloads/T15_FW_Chap 1.pdf
Hwang, H. I., & Cho, E. L. (2012). A study on teaching-learning methods according to personal variables in the dynamic assessment of young children’s mathematical learning abilities.
Korean Journal of Child Studies, 33
(2), 203-222.Hyde, J. S. (2014). Gender similarities and differences.
Annual review of psychology, 65,
373-398.Hyde, J. S., Lindberg, S. M., Linn, M. C., Ellis, A. B., &
Williams, C. C. (2008). Gender similarities characterize math performance.
Science, 321
(5888), 494-495.Jo, Y. D. (2016). Analysis on gender differences of scholastic characteristics at each achievement level in content domains.
Journal of Korea Society Educational Studies in Mathematics—School Mathematics, 18
(1), 15-42.Jordan, N. C., Kaplan, D., Olah, L., & Locuniak, M. N.
(2006). Number sense growth in kindergarten: A longitudinal investigation of children at risk for mathematics difficulties.
Child Development, 77,
153-175.Kim, D. H., & Law, H. (2012). Gender gap in maths test scores in South Korea and Hong Kong: Role of family background and single-sex schooling.
International Journal of Educational Development, 32
(1), 92-103.Kim, S. H. (2007). Analysis of basic competency for basic mathematics and background by gender.
The Mathematics Education, 46
(1), 33-52.Ko, J. H., Do, J. H., & Song, M. Y. (2008). An analysis of the gender difference in national assessment of educational achievement of mathematics.
Journal of Educational Research in Mathematics, 18
(2), 179-200.Korean Educational Development Institute (2018).
Korean education statistics service report
Retrieved Jun. 27, 2020 from:https://kess.kedi.re.kr/eng/publ/publFile/pdfjs?survSeq=2 018&menuSeq=3645&publSeq=44&menuCd=79976&itemC ode=02&menuId=3_2_1&language=undefined
Kwon, O. N., & Park, K. M. (1995). Gender differences in mathematics achievement.
Korean Association of Women’s Studies, 11
, 202-232.Lee, B. J. (2009). The trend of gender differences in variability in national assessment of educational achievement on mathematics.
Journal of Educational Research in Mathematics,
19(2), 273-288.Lee, K. H., & Hwang, S. W. (2019). A study on the correlation between mathematics anxiety and mathematics achievement in high school students.
The Mathematical Education, 58
(3), 337-346.Lee, K. S., & Park, I. Y. (2015). Characteristics on gender difference of Korean students in TIMSS mathematics assessment.
The Journal of Curriculum and Evaluation, 18
(1), 155-183.Lee, S. J. (2019). An analysis of gender differences in primary, middle school and college students’ academic achievements in mathematics.
Journal of Educational Innovation Research, 29
(2), 1-16.Lim, H. J., & Jun, H. R. (2017). A dynamic panel analysis of the factors influencing math achievement.
Korean Journal of Sociology of Education, 27
(1), 55-86.Lim, H. M., & Han, J. A. (2016). Analysis of educational context variable effects on gender differences observed in PISA 2012 mathematics in Korea, Singapore, and Finland.
The Journal of Educational Research in Mathematics, 26
(2) 189-204.Liu, O. L., & Wilson, M. (2009). Gender differences in large-scale math assessments: PISA trend 2000 and 2003.
Applied Measurement in Education, 22
(2), 164-184.Lubienski, S. T., & Ganley, C. M. (2017). Research on gender and mathematics. In J. Cai (Ed.),
Compendium for research in mathematics education
(pp. 649-666).National Council of Teachers of Mathematics.
Ministry of Science, ICT, and Future (2016).
Report on the status of women in science, engineering &
technology
. MSIF.Mullis, I. V., Martin, M. O., Foy, P., & Arora, A. (2012).
TIMSS 2011 international results in mathematics.
TIMSS & PIRLS International Study Center.
Mullis, I. V. S., & Martin, M. O. (2013). T
IMSS 2015 assessment frameworks
. TIMSS & PIRLS International Study Center.Mullis, I. V. S., Martin, M. O., Foy, P., & Hooper, M.
(2016).
TIMSS 2015 international results in mathematics
. TIMSS & PIRLS International Study Center.Mullis, I. V. S., Martin, M. O., Ruddock, G. J., O’Sullivan, C. Y., & Preuschoff, C. (2009).
TIMSS 2011 assessment frameworks
. TIMSS & PIRLS International Study Center.Park, J. M., & Hong, S. O. (2019). Influential variables for the school readiness of preschoolers: Learning capabilities, family interaction types and maternal parenting behaviors.
Korea Journal of Child Care and Education, 115
, 83-108.Ponitz, C. C., Rimm-Kaufman, S. E., Brock, L. L., &
Nathanson, L. (2009). Early adjustment, gender differences, and classroom organizational climate in first grade.
The Elementary School Journal, 110
(2), 142-162.Ryu, J. H. (2008). The impact of classroom environment and gender gap of digital textbook for mathematics of elementary school on achievement and media perception.
Journal of Educational Technology, 24
(3), 53-83.Suh, B. E., & Lee, K. S. (2012). The analysis of cause of gender gap in items of 6th grade National Assessment of Educational Achievement.
Education of Primary School Mathematics, 15
(1), 13-29.Ursini, S., & Sánchez, G. (2008). Gender, technology and attitude towards mathematics: a comparative longitudinal study with Mexican students.
ZDM, 40
(4), 559-577.Weldeana, H. N. (2015). Gender positions and high school students’ attainment in local geometry.
International Journal of Science and Mathematics Education, 13
(6), 1331-1354.Zhu, J., & Chiu, M. M. (2019). Early home numeracy activities and later mathematics achievement: early numeracy, interest, and self-efficacy as mediators.