1)
†
To whom correspondence should be addressed.
Department of Civil and Environmental Engineering, Kongju National University
E-mail: [email protected]
Analysis of water quality improvement efficiency using constructed wetland in a coastal reservoir
Jungsun Hong・Marla C. Maniquiz-Redillas・Jong-Hwa Ham
*・Lee-Hyung Kim
†Department of Civil & Environmental Engineering, Kongju National University
*
Rural Research Institute, Korea Rural Community Corporation
연안 담수호 수질오염 방지를 위한 인공습지의 수질정화효율 분석
홍정선・말라・함종화*
・김이형
† 공주대학교 건설환경공학과한국농어촌공사 농어촌연구원*
(Received : 28 July 2016, Revised: 19 August 2016, Accepted: 19 August 2016)
Abstract
Diverse and comprehensive countermeasures were established to prevent water pollution in coastal areas such as constructed wetlands(CW).This study was conducted to assess the water quality improvement through CW constructed along the shoreline of Hwaseong coastal reservoir. The CW is located in Hwaseong-si, Gyeonggi-do and consisted of a forebay and a wetland. The CW was monitored twice during rainy days and 10 times during dry days.
The monitoring results indicated that in and out flowrates were highly correlated with COD and TN loads. COD, TN and TP concentrations in the forebay was lower during dry days than rainy days. However, concentration and mass removal efficiencies of COD, TN and TP were greater during rainy days. In addition, the volume flowing into the CW was less compared to the outflow during rainy days indicating that the CW efficiently reduced the runoff volume. The overall pollutant removal efficiency of the CW were at least 50% for TSS, 20 to 35% for TP, and 26 to 94% for TN.
The data gathered may be used to improve the pollutant removal efficiency of the system in the future.
Key words : Constructed wetland, nonpoint source pollution, diffuse pollution, pollutant removal efficiency
요 약
담수호 수질오염방지를 위해 유역종합대책과 호내 대책으로 수질오염방지 종합대책 수립 및 인공습지를 적용하였다.
본 연구는 화성호 수질 개선 및 자연생태계 보호를 위한 호소 수변지역 인공습지 조성에 따른 수질정화 효율과 인공습 지 효율 제고를 위한 설계 고려사항을 도출하기 위하여 수행하였다. 연구대상 시설은 경기도 화성시에 위치한 인공습 지 시스템으로forebay와 wetland로 구성되어 있다. 모니터링은 강우시 2회, 건기시 10회 수행하였으며, 분석 결과 인 공습지 유입 및 유출의 유속은 COD와 TN의 부하량과 높은 상관성을 가지는 것으로 분석되었다. 인공습지의 forebay 지점에서 건기시에는 COD, TN 및 TP의 농도가 감소하는 것으로 조사되었으며, 비 강우시에 비해 강우시에 저감효율 이 상대적으로 높은 것으로 나타났다. 또한, 강우시에 인공습지에 유입되는 양에 비해 유출되는 양이 상당히 작은 것으 로 강우유출수 저감 효과에 뛰어난 것으로 분석되었다. 건기시 및 강우시의 인공습지의 전반적인 효율의 경우 TSS는 50% 이상, TP는 20~35%으로 조사되었으며, TN은 26~94%로써 다른 오염물질에 비하여 높은 저감효율을 나타냈다.
이러한 모니터링 자료는 향후 담수호 수질정화효율 증대를 위한 인공습지 설계 시 중요한 자료를 제공할 것으로 판단 된다.
핵심용어 : 인공습지, 비점오염원, 오염물질 확산, 수질정화효율
Analysis of water quality improvement efficiency using constructed wetland in a coastal reservoir 293
1. Introduction
The Hwa-ong district reclaimed land development program was designed to replace impervious land brought about by urbanization with water resources and relaxation for citizens. Hwa-ong reclaimed land development program the paved way to establishing the Hwaseong coastal reservoir (Ham and Lee, 2014). However, there is difficulty in ensuring water quantity required to appropriately maintain the reservoir due to the short distance from coast to the catchment boundary of the Hwaseong reservoir. In addition, increase in impervious surface due to development, domestic sewage, industrial and livestock wastewater flow caused deterioration in the reservoir’s water quality.
The concentrations of pollutants in rivers that flow into the Hwaseong reservoir were as follows: 7.4 to 12.9mg/L for BOD, 5.0 to 10.2mg/L for TN, 0.2 to 0.6mg/L for TP were classified a grade Ⅳ or lower based on the standard of the national river water environment quality(reference).
Therefore, for stable water quality improvement of Hwaseong reservoir, diverse measures to reduce pollutants that flow into the reservoirs are necessary.
In order to minimize the water quality and quantity deterioration of Hwaseong reservoir, organizations established basin measures to improve water quality such as sewage treatment plants, sewer village, and manure storage tanks for livestock wastewater treatment. A treatment plant was installed for public and low impact development (LID) facilities (Jang et al., 2012). Moreover, the LID facility that was developed in order to establish a water quality management plan in the Hwaseong reservoir was a constructed wetland with forebay. Recent researches have shown that constructed wetlands (CWs) were capable of reducing nonpoint source (NPS) pollutants including agricultural discharges and stormwater runoff from various landuses. Thereby it can diminish the eutrophication of the adjacent aquatic system and contamination of groundwater used for potable water supply (Comin et al., 1997; Kovacic et al., 2000; Scholz & Lee, 2005). This could be achieved through various processes including filtration, sedimentation, biological and microbiological adsorption and assimilation (Hammer, 1992; Vymazal et al.,1998). CWs are ecologically engineered systems designed to utilize the natural processes involving wetland vegetation, soils, and the associated microbial assemblages to assist in treating wastewaters (Vymazal, 2005). There are several types of CW systems such as free water surface flow (FWS), horizontal subsurface flow (HSSF), vertical subsurface flow (VF), and hybrid systems. Most CWs consist of forebays and wetlands. The
forebays play the role of temporarily storing non-point pollutant sources discharged from external basins and initial rainfall runoff during rainfall days to remove particulate matters thereby reducing pollutant loads in the CWs and the Hwaseong reservoir. Wetlands have pollutant reduction mechanisms mediated by the activity of aquatic plants and microorganisms. Aquatic plants play the role of taking up pollutants from their roots through photosynthesis to remove the pollutants from the water. Soil microorganisms have biological degradation mechanism to remove pollutants from the water through respiration. In addition, plant stems and roots act as spaces for attachment of microorganisms to enable the formation of biofilms, contributing to the removal of pollutants.
Generally, FWS CWs are constructed to remove pollutants discharged from diverse kinds of wastewater including rainfall runoff. According to the results of operation of FWS CWs installed as a follow-up process after treatment of livestock wastewater containing high concentration pollutants including nitrogen, TN and TP reduction efficiency levels were relatively low amounting to 23~45% (Lee et al., 2013).
The pollutant reduction efficiency levels in the FWS wetlands formed to treat agricultural water effluent containing low mean pollutant concentration were 26% for TSS, 28% for BOD, and 39% for TP (Kang et al., 2010). Factors that affect pollutant reduction efficiency in the constructed wetlands are diverse such as hydraulic residence time, vegetation covering degree, water temperature, and the concentration of influent water.
The Hwaseong reservoir constructed wetlands that are the target facility of the present study is in the form of FWS and the influent water is low concentration river water.
The wetlands are characterized by very long hydraulic residence time and vegetation rooting has been in progress until now in the region since the construction of the wetland.
Therefore, the present study was conducted to derive measures to improve the ability of the wetland to prevent water quality degradation through analysis of changes in pollutant reduction efficiency during dry days and during rainfall days in the process of stabilization of the wetlands immediately after the formation as well as influencing factors.
2. Materials and method
2.1 Constructed wetland description
The CW in Hwaseong-si, Gyeonggi-do was installed to prevent Hwaseong reservoir from being polluted by
nonpoint pollution sources generated by nearby farmlands and agricultural complexes thereby improving the water quality. The CW consists of a forebay and a wetland.
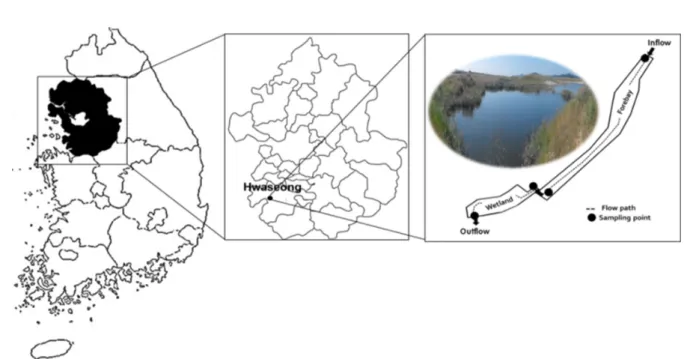
Figure 1. shows the site location and schematic diagram of the CW. The vegetation in the CW was designed so that local plants would naturally germinate and take root (Ham and Lee, 2014). The CW which consists of forebay and wetland with an area of 45 ha and 14 ha, respectively received runoff from a catchment area of 3,345 ha. The mean water depth of the forebay was 3.3m whereas wetland had 0.6m (Table 1).
2.2 Monitoring and data handling
From June 2014 to 2015, the CW was monitored 10 times during dry days and two times during rainfall days. Flow rates and water quality at the inlets and outlets of forebays and wetlands were measured.
Physico-chemical water parameters, such as dissolved oxygen (DO), pH, electrical conductivity (EC), turbidity and temperature were measured in the field using portable meters. Samples were analyzed for water quality parameters including total suspended solids (TSS), chemical oxygen demand (COD), total organic carbon(TOC), TN, ammonium (NH4−N), nitrate (NO3−N), TP, phosphate (PO4−P) and
chlorine(Chl-a). Analyses were performed in accordance with standard methods for the examination of water and wastewater(Greenberg et al, 1998).
Pollutant loads were calculated utilizing the measured flow rates and water quality related substances’ concentration data and the correlations between pollutant loads and flow rates were determined using SYSTAT 12.
The Pearson correlation coefficient (r) was used to determine the dependence between flow and pollutant loading rate wherein the significant correlations were accepted at 95% confidence level, signifying that the probability (p) value was less than 0.05.
3. Results and Discussion
3.1 Hydrologic and hydraulic characteristics Table 2 shows the results of monitoring during dry days and during rainfall days. The in flow rate of 1,126±742 m3/hr in the forebay and wetland during dry days were reduced to
1,035±876. This finding signified that the CW reduced the flow during dry days by about 8%.
The amount of water that flowed into the wetland during rainfall days was shown to be at least three times greater compared to dry seasons. Lastly, the flow reduction during
Fig. 1. Monitoring and site locations of the constructed wetland
Table 1. Constructed wetland specifications CA
(ha)
a)AIR (m
3/day)
b)Area (ha) Water level (m) HRT (day)
Forebay Wetland Forebay Wetland Forebay Wetland
3,345 53,996 45 15 3.3 0.6 16.6 5
a) Catchment Area
b) Average Inflow Rate
Analysis of water quality improvement efficiency using constructed wetland in a coastal reservoir 295
rainy season considering low flow was 48%. On the otherhand, an increase in the outflow rate was observed in the CW during rainy days with high flow amounting to 14%. This finding was attributed to the flow generated in the catchment of wetland during rainy season which was not measured in the wetland inflow.
Table 3 shows the correlations between pollutant loads and flow rates. All water quality parameters except for turbidity showed high correlation to in flow rate(r > 0.5).
COD and TN were identified to have highest to flow rate(r>0.9). These findings signified that the flow rate has often been used to represent the energy input from the storm event (Driber and Troutman, 1989; Walden, 1999; Choi et al., 2013). The correlations between the loads of different kinds of pollutants were analyzed and the results showed high correlations between TSS, and COD and TP(r>0.8).
This means that the particulate matter plays an important role in the process of transportation of organic matter and nutrients (Yi Yuan et al., 2001; Geronimo et al., 2014).
3.2 Water quality in the forebay
The results of analysis of water quality in the forebay during rainfall days and during dry dayswere exhibited in
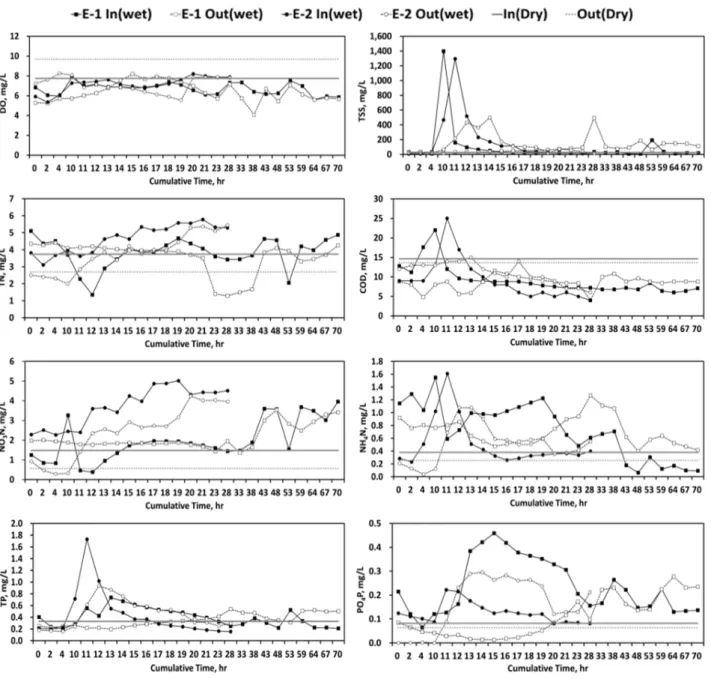
Figure 2. During dry days, the forebay played the role of increasing the sedimentation of pollutants. Organic matter (COD) and nutrients such as TN and TP decreased. However the observed increase in TSS and DO were attributed to the algae generation due to the long hydraulic residence time. In the forebay, TN decreased due to the decrease in NH4-N and NO3-N. NH4-N decreases and NO3-N increases through nitrification. In addition, TN was found to have decreased due to the growth of microorganisms such as algae. Although COD decreased the inflow part of the forebay, the overall reduction was observed to be relatively low because of the primary production algae.
During rainfall days, the forebay was found to have minimal reduction of TSS, COD, and TP. The DO concentrations of influent water and effluent water were not significantly different. DO was observed to increase due to rain fall. TSS increased to approximately 1400mg/L in the forebay influent water then eventually decreased to approximately 500mg/L at the outlet 5 to 40hr later. COD also decreased during rainfall days and affected by the TSS reduction. Minimal reduction of Phosphorus (P) was attributed to the inflow P particulate form which were greater than the inflow P in dissolved forms.
Table 2. Summary of the hydrologic and hydraulic data from dry and rainfall day monitored events Sampling period Forebay in and
out flow
Wetland inflow
Wetland
outflow ADD
aTotal
Rainfall
Total rainfall duration
Average rainfall intensity
units m
3/hr m
3/hr m
3/hr day mm hr mm/hr
Dry day 1,126±742
b1,126±742 1,035±876 - - - -
Rainfall day
Low flow
(E-1) - 3,669,110 1,896,526 4.4 129.0 76.3 1.7
High flow
(E-2) - 4,800,674 5,515,636 1.8 112.5 17.2 6.6
Ave. - 4,234,892
±800,137
3,706,081
±2,559,097 3.1±1.8 120.8±11.7 46.7±41.8 4.1±3.4
a
Antecedent dry days.
b
Mean ± standard deviation
Table 3. Pearson correlations of flow rate and pollutant loading during in rainfall season
flow DO EC pH Turb. TSS COD TOC TN TP Chl-a
flow 1
DO 0.794 1
EC 0.743 0.969 1
pH 0.796 0.994 0.969 1
Turb. 0.309 0.326 0.154 0.327 1
TSS 0.653 0.491 0.348 0.501 0.765 1
COD 0.931 0.748 0.683 0.745 0.413 0.805 1
TOC 0.796 0.625 0.622 0.638 0.156 0.333 0.635 1
TN 0.922 0.775 0.694 0.787 0.296 0.536 0.785 0.826 1
TP 0.768 0.581 0.442 0.596 0.649 0.952 0.881 0.471 0.7 1
Chl-a 0.598 0.846 0.908 0.834 0.088 0.297 0.626 0.441 0.46 0.34 1
3.2 Water quality changes in the wetland The hydro-pollutographs during rainfall days in the wetlands were shown in Figure 3. Although the peak flow rate of influent water was very high, the peak flow rate at the outlet through which the influent water flowed out after residence time for 4~6 hours was shown to be quite lower. This decrease in peak flow rates affected the physical pollutant treatment mechanism thereby affecting the pollutant treatment efficiency of the system. The peak concentration of TSS showed a tendency to decrease from 500 mg/L to approximately 100 to 200mg/L. This finding was due to increased hydraulic residence time. At least 70%
of nitrogen in influent water was observed to be in NO3-N and NH4-N forms, which decreased in the wetland due
to nitrification. NO3-N concentration increased the wetland.
However, the effluent concentration was less than the influent concentration due to uptake by plants. TN concentration increased while TP concentration decreased in the wetland.
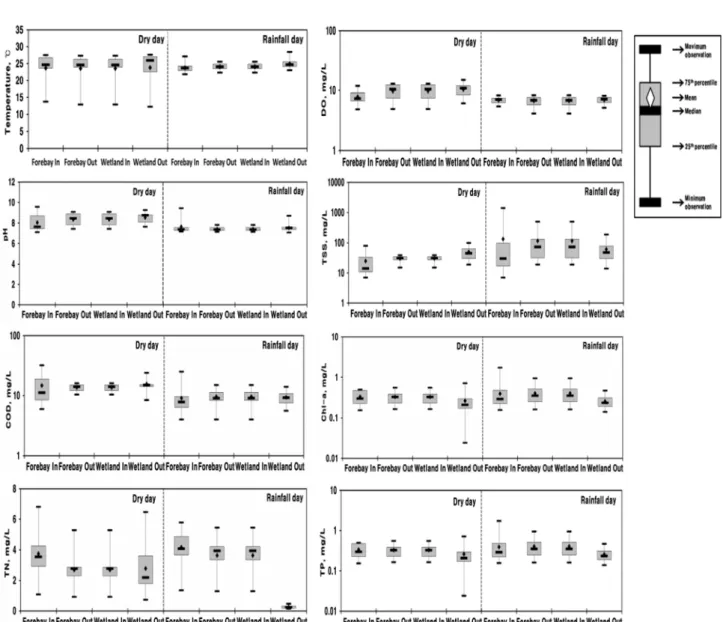
3.3 Water purification efficiency of the CW Figure 4 demonstrated the comparison in the concentration of TSS, COD, TN and TP during dry and rainfall days entering and exiting the forebay and wetland, respectively.
Results showed that the pollutant concentration during dry days was present at very low concentration which assumed to be the background concentration that the wetland receives during rainy season. However, the rainfall events caused
Fig. 2. Comparison of pollutant concentration at the forebay during dry and wet days.
Analysis of water quality improvement efficiency using constructed wetland in a coastal reservoir 297
the increase in the concentration of the pollutants specifically particulates and nutrients necessitating the importance of the constructed wetland to manage the diffuse pollution from the agricultural land and industrial complex.
It was found out that the concentration of TSS during rainfall days was highly elevated in the forebay from an average of 10 mg/L during dry days to 140 mg/L; but was reduced by more than 50% after passing through the
(a)
(b)
Fig. 3. Hydro-pollutographs in the wetland during (a) low flow (07/23/2014) and (b) high flow (08/21/2014) storm events.
wetland. The concentration of nutrients (TN and TP) entering the forebay was also increased by 35 to 40% during rainfall days. Albeit small amount, the nutrients were still reduced in the wetland during dry and wet days.
Because pollutant reduction efficiency in the wetland during rainfall days is generally affected by HRT, the calculation of HRT is important. Due to the diversity of
rainfall, HRT should be derived through long-term monitoring. Figure 5 proposed method of determining the retention time using EC which fluctuates the most severely during rainfall compared to dry days. When calculated through this method, HRT was shown to be 11hr during low flow rainfall and 24.5hr during high flow rainfall. Given this tendency, if rainfall exceeding 40mm occurs in the
Fig. 4. Pollutant concentration in the CW during dry and rainfall day.
Fig. 5. Calculation of HRT due to a change of EC in the inflow and outflow of the wetland.
Analysis of water quality improvement efficiency using constructed wetland in a coastal reservoir 299
constructed wetlands, the residence time should be at least 10hr.
4. Conclusion
The monitoring on the pollutant removal efficiency of a CW provided valuable insight into the applicability of this type of system to control diffuse pollution in a reclaimed area. The following conclusions were drawn:
∙Correlations between pollutant loads and flow rates showed that COD and TN were highly correlated with flow rates. High flow rates were shown to act as substance migration energy to move large quantities of pollutants.
∙During dry days, the forebay play the role of settling out pollutants thereby reducing pollutant loads in the wetland to facilitate maintenance later. During dry days, in the forebay, organic matter (COD) and nutrients such as TN and TP showed a tendency to decrease, while TSS and DO showed a tendency to increase. Due to the long hydraulic residence time, it was indicated that appropriate residence time should be maintained for good settling efficiency. During rainfall days, the forebay showed high reduction effects for pollutants (COD, TP) associated with TSS but showed low reduction efficiency for nitrogen.
∙During rainy days, the wetland had rainfall runoff reduction effects. Furthermore, the wetlands also showed nitrogen reduction effects due to nitrification reactions.
∙The overall efficiency of the CW showed that, during dry days, TN and TP reduction efficiencies were 26%
and 21%, respectively and during rainfall days, TSS, TN, and TP reduction efficiencies were 54%, 94%, and 35%, respectively.
∙The observations and findings revealed that the CW system was capable of improving the water quality and more importantly solve the diffuse pollution problem in the Hwaseong reservoir.
∙To maintain and improve the reduction efficiency at certain levels, the authors propose periodic removal of vegetation for maintenance of appropriate vegetation density so that the vegetation planted when the constructed wetlands were formed can continuously propagate. In addition, the vegetation in the constructed wetlands should be formed with diverse plant species, planted at different locations in the wetlands that are effective for removal of pollutants at individual locations.
Lastly, the constructed wetlands should be designed to minimize the formation of dead zones in order to prevent algae production, in the form of waterway rather than
ponds to induce minimum necessary water flows.
Acknowledgment
This research was supported by a grant from Korea Rural Community Corporation. The authors are grateful for their support.
References
Changguk Kang, Marla C. Maniquiz, Younggyu Son and Lee-Hyung Kim (2010) Analysis of water purification in the FWS wetland for Agreculture Area,
J. of Wetlands Research
, 12(3), pp. 39-47.Comin, F. A., Romero, J. A., Astorga, V. and Garcia, C. (1997) Nitrogen removal and cycling in restored wetlands used as filters of nutrients for agricultural run-off, Water Science and Technology, 33, pp. 225–261.
F. K. F. Geronimo, M. C. Maniquiz-Redillas, J. A. S. Tobio and L. H. Kim (2014) Treatment of suspended solids and heavy metals from urban stormwater runoff by a tree box filter, Wat. Sci. & Tech. 69(12), pp. 2460-2467.
Hammer, D. A. (1992) Designing constructed wetlands systems to treat agricultural non-point source pollution. Ecological Engineering, 1, pp. 49–82.
Jaeho Jang, Hyeongsik Kang and Kwangwook Jung (2012) Watershed modeling Research for receiving water quality management in hwaseong reservoir watershed,
J. of Korean Society on Water Environment
, 28(6), pp. 819-832.Jiyeon Choi, Marla C. Maniquiz-Redillas, Soyoung Lee, Jean Margaret R. Mercado, and Lee-Hyung Kim (2013) Application of a gravel wetland system for treatment of parking lot runoff, Desalination and Water Treatment, 51(19-21), pp. 4129-4137.
Jonghwa Ham and Taeho Lee (2014) Temporal operation result of large scale constructed wetland for hwaseong reservoir water pollution protection, 2014 Korea wetlands society conference on wetlands.
J. Vymazal (2005) Horizontal sub-surface flow and hybrid constructed wetlands systems for wastewater treatment, Ecological Engineering, 25(5), pp. 78–490.
Kovacic, D. A., Gentry, M. B. and Lowell, E. (2000) Effectiveness of constructed wetlands in reducing nitrogen and phosphorus export from agricultural tile drainage.
J.
of Environmental Quality
, 29, pp. 1262–1274.M. C. Maniquiz, SY Lee, JY Choi, SM Jeong and L.H. Kim (2012) Treatment performance of a constructed wetland during storm and non-storm events in Korea, Water Science and Technology, 65(1), pp. 119-126.
N.E. Driver and B.M. Troutman (1989) Regression models for
estimating urban storm-runoff quality and quantity in the United States,
J. of Hydrol,
109, pp. 221–236.Scholz, M. and Lee, B.W. (2005) Constructed wetlands: a review. International
J. of Environmental Studies
, 62 (4), pp. 421– 447.Song, M. Y., Le, G. Y. and Baek, K. O (2009) Preliminary Feasibility Study on the Desalination of Hwaseong &
Tando reclaimed reservoirs, Gyeonggi Research Institute.
S. Y. Lee, M. C. Maniquiz, J. Y. Choi, S. M. Jeong and L. H.
Kim (2013). Seasonal nutrient uptake of plant biomass in a constructed wetland treating piggery wastewater effluent, Water Science & Technology, 67(6), pp. 1317-1323.
Vymazal, J., Brix, H., Cooper, P., Haberl, R., Perfler, R. and Laber, J. (1998) Removal Mechanisms and Types of Constructed Wetlands, Constructed Wetlands for wastewater treatment in Europe, Backhuys Publishers, Leiden, The Netherlands.
W.J. Walden (1999) Nonpoint Source Pollutant Export Estimation from Urban Catchments, Faculty of Engineering, University of Queensland, Brisbane.
Yi Yuan, Ken Hall and Carolyn Oldham (2001) A preliminary model for predicting heavy metal contaminant loading from an urban catchment, Science of the Total Environment, 266 (1–3), pp. 299–307.