• 검색 결과가 없습니다.

Understanding the Food Hygiene of Cruise through the Big Data Analytics using the Web Crawling and Text Mining

N/A
N/A
Protected

Academic year: 2021

Share "Understanding the Food Hygiene of Cruise through the Big Data Analytics using the Web Crawling and Text Mining"

Copied!
10
0
0

로드 중.... (전체 텍스트 보기)

전체 글

(1)

1. INTRODUCTION

The modern cruise industry emerged in the late 1960s and early 1970s (Rodrigue & Notteboom, 2013). The cruise industry is the fastest-growing category in the leisure travel market experiencing a steady 8.4% increase per year since 1984.

According to the Cruise Line International Association (CLIA, 2015), the number of cruisers in 2016 is approximately 22.9 million, and the development of the cruise industry has created 119.9 billion dollars in global economic impact and 939,232 jobs around the world.

Given the worldwide cruise market size and potential growth of the whole market, cruise operators are presented with not only an abundance of opportunities, but also challenges.

While the lack of hospitality-oriented understanding of food hygiene about cruise industry is one of the major factors con- straining market expansions. The importance of good food hy- giene is much bigger for ship itself, due to the possibility of food born disease epidemics (Addiss, Yashuk, Clapp, & Blake, 1989; Koo, Maloeny, & Tauxe, 1996). The conditions of food hygiene of cruise ship have been studied while the number of studies is limited and mostly are specific case studies with Information available at the Culinary Society of Korea (http://www.culinary.re.kr/)

Culinary Science & Hospitality Research

Journal & Article Management System: https://cshr.jams.or.kr/

21-28

http://dx.doi.org/10.20878/cshr.2018.24.2.005

Understanding the Food Hygiene of Cruise through the Big Data Analytics using the Web Crawling and Text Mining

Tao Shuting

1

, Byongnam Kang

2

& Hak-Seon Kim

1

1

School of Hospitality & Tourism Management, Kyungsung University

2

Dept. of Foodservice Management & Culinary, Hyejeon College

KEYWORDS ABSTRACT

Cruise food hygiene, Big data,

Language network analysis,

Web crawling, Text mining.

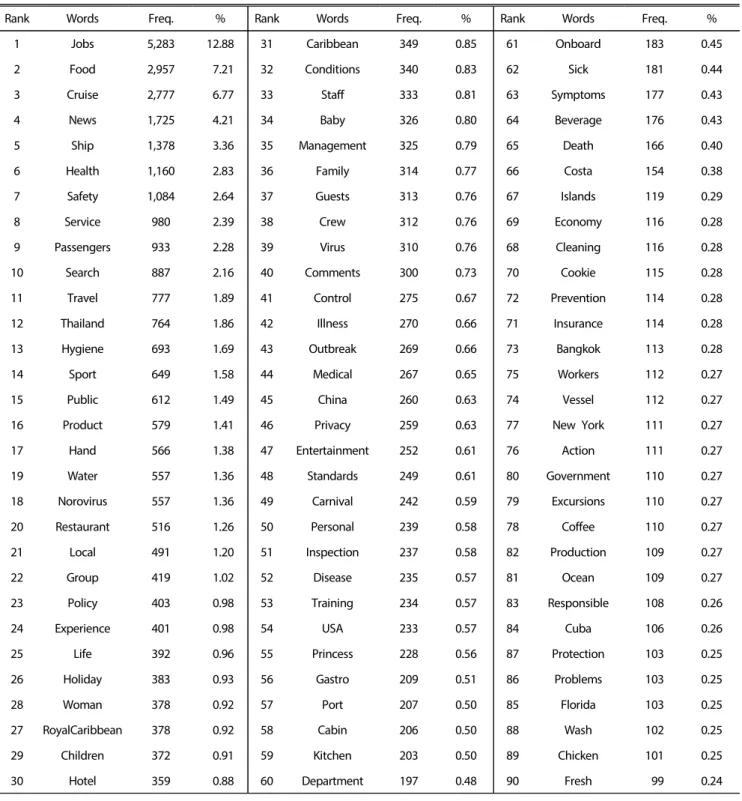
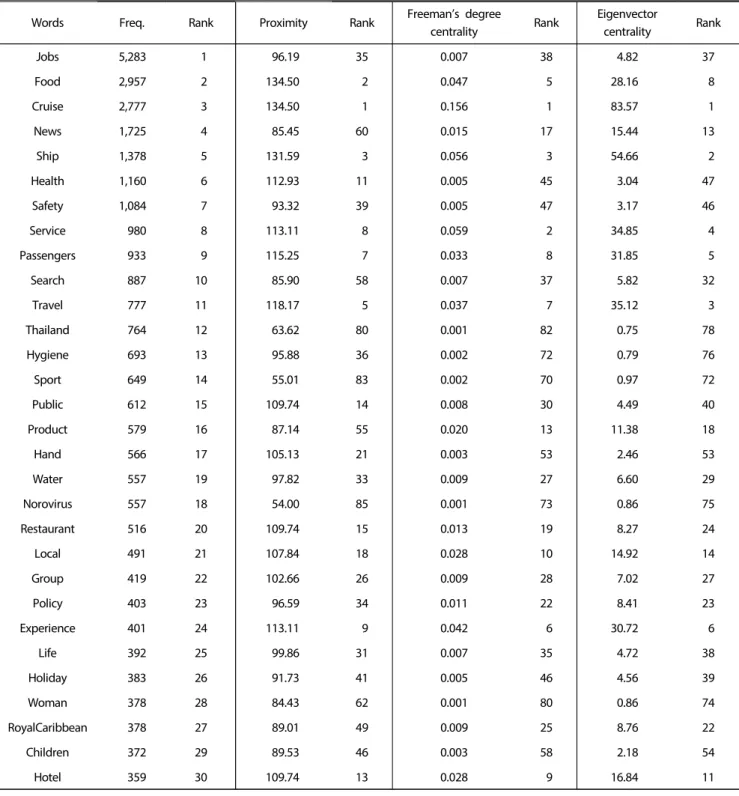
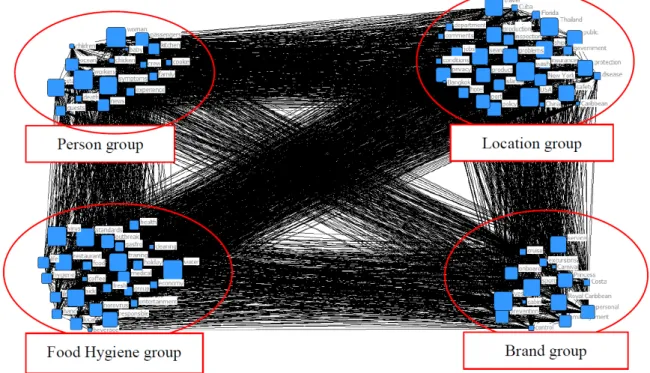
The objective of this study was to acquire a general and text-based awareness and recognition of cruise food hygiene through big data analytics. For the purpose, this study collected data with conducting the keyword “food hygiene, cruise” on the web pages and news on Google, during October 1st, 2015 to October 1st, 2017 (two years). The data collection was processed by SCTM which is a data collecting and processing program and eventually, 899 kb, approximately 20,000 words were collected. For the data analysis, UCINET 6.0 packaged with visualization tool-Netdraw was utilized. As a result of the data analysis, the words such as jobs, news, showed the high frequency while the results of centrality (Freeman's degree centrality and Eigenvector centrality) and proximity indicated the distinct rank with the frequency. Meanwhile, as for the result of CONCOR analysis, 4 segmentations were created as “food hygiene group”, “person group”, “location related group” and “brand group”. The diagnosis of this study for the food hygiene in cruise industry through big data is expected to provide instrumental implications both for academia research and empirical application.

*

This work was supported by the Ministry of Education of the Republic of Korea and the National Research Foundation of Korea (NRF-2016S1A5A2 A03928029).

Corresponding author: Hak-Seon Kim, School of Hospitality & Tourism Management, Kyungsung University, 309, Suyeong-ro, Nam-gu, Busan 48434,

Republic of Korea, Tel. +82-51-663-4473, Fax. +82-51-627-6830, E-mail: [email protected]

(2)

conducting the research to utilize questionnaire surveys.

According to the study of Petrick, Tonner and Quinn in 2014, there are many factors that affect the cruise passenger experience, more specifically the food and beverage on the ship and at the destinations, entertainment, customer service, tours, itinerary and shopping are some of the strong predic- tors of the cruise experience and the subsequent overall satisfaction. The food and beverage sector takes an important significance in the cruising experience. With the prosperous development of cruise tourism, the existing aporia cannot be neglected. The overall of diarrheal disease on cruise ships decreased from 29.2 cases per 100,000 passenger days in 1990 to 16.3 cases per 100,000 days in 2000 (Gramer, Gu, &

Durbin, 2003). However, from 2001 to 2004, this number increased to 29.2 cases per 100,000 days (Gramer et al., 2006).

From 2004 to 2009, an average of 27 laboratory confirmed norovirus outbreaks has been reported to VSP (Vessel Sani- tation Program) annually (unpublished data). And as results of investigation of these outbreaks of diarrheal diseases, food- borne diseases take the important roles.

The tremendous growth of social media and consumer- generated content on the Internet has inspired the develop- ment of the so-called big data analytics to understand and solve real-life problems (Xiang, Schwartz, Gerdes, & Uysal, 2015). In recent years, big data has rapidly developed into a hotspot that attracts great attention from academia, industry, and even governments around the world (e.g. China Develop- ment Index by Chinese government since 2007; Consumer- market investigation from Alibaba in 2016; hotel guests' experience and satisfaction from Xiang et al. in 2015). The emergence of big data has spawned a new research para- digm; that is, with big data, researchers may only need to find or mine from it the required information, knowledge and intelligence which means for the future research, it will break the inherent shortcomings of traditional surveys which are with time and space limitations. In the hospitality field there is growing interests in utilizing user-generated data to gain insights into research problems that have not been well understood by conventional methods (Ye, Law, & Gu, 2009).

For instance, comparison of cruise tours in China and USA from Tao and Kim in 2017.

Since the popularity of cruise tourism, there are a plethora of researches studying on this emerging market from many respects. Although these studies mainly set from the respects of tourism and hospitality, as for the food hygiene on the

cruise ship, previous studies mostly concentrated on the field of medical and epidemic domains. This study took the hos- pitality facet as the jumping-off point to probe into the cruise food hygiene and acquire a comprehensive cognition and awareness of food hygiene in cruise industry based on the language network analysis of web text from big data analytics.

2. LITERATURE REVIEW

2.1. Cruise Industry and Cruise Food Hygiene

To cruise is “to make a trip by sea in a liner for pleasure, usually calling at a number of ports” (Collins English Dictionary, 2010). At the first beginning, the main function of the cruise ship was to carry mail and immigration, and later the cruise ship developed into a new way of tourism (Wang, 2015).

Meanwhile, the cruise industry is in a period of transformation reminiscent of the 1970s when the core product shifted from passenger shipping to cruise vacationing (Kwortnik, 2008).

More recently, the focus of this transformation is the actual cruise experience. Cruise tourism is a special travel experience, not only to provide customers enough leisure space onboard, but also offers them with the scenic ports, additionally, through the shore sightseeing, shopping and activities to enrich the leisure cruising contents. Cruise tourism is a type of tourism which is able to take full advantages of both land and sea space (Chin, 2008). Over the past two decades, more than 60 million people have enjoyed safe, comfortable, and exciting cruise tours (Chin, 2008). The cruise population of approxi- mately 500,000 passengers in 1970 grew to 22.9 million by 2016 and it is forecasted to be 31 million in 2017.

Despite the rapid expansion and prosperous of cruise tourism, the conundrum of this industry still existed and is non-ignorable. The conditions of food hygiene on board mer- chant ships have not been widely studied, and findings of 7.8

% of seamen reported unsatisfactory safety and health condi- tions on board (Tomaszunas, Renke, Filikowski, Rzepiak, &

Zaborski, 1997) which can suggest interest of studying the

specific problem of food hygiene quality on board merchant

ships. Food borne diseases are a serious public health pro-

blem, even in developed countries, creating a significant social

and economic burden on communities and their health sys-

tem (Marmot, Friel, Bell, Houweling, & Taylor, 2011), especially

in settings with close living quarters, such as nursing homes,

university dormitories, and cruise ships (Kak, 2007). At the

same time, one of the most representative examples is the

(3)

outbreaks of diarrheal diseases onboard.

From 1990 through 2000, incidence rates of diarrheal di- sease on cruise ships declined in association with the environmental health inspection programs conducted by the Vessel Sanitation Program (VSP), National Center for Environ- mental Health Centers for Disease Control and Prevention (CDC) (Cramner et al., 2003). Overall incidence of diarrheal disease among passengers declined from 29.2 cases per 100,000 passenger days in 1990 to 16.3 passenger days in 2000. Outbreak-related (outbreak defined as 3% or more of passengers ill) diarrheal disease cases decreased from 4.2 to 3.5 per 100,000 passenger days from 1990~1995 to 1996~

2000. This represented a further decline from six outbreak- related illness per 100,000 passenger days in 1989~1993(Koo et al., 1993). However, in 2002, VSP reported 29 outbreaks of acute gastroenteritis on cruise ships, an increase from two outbreaks reported the previous year. Since that time, noro- virus (NoV) have emerged as a frequent cause of illness at sea.

2.2. Big Data

What is big data? So far, there is no universally accepted definition of big data. In Wikipedia, big data is defined as “an all-encompassing term for any collection of data sets so large and complex that it becomes difficult to process using tradi- tional data processing applications.” And the term of big data was officially used in the latest sense as the World Economic Forum (2012) reported that big data is the 10 most promising technologies in the future. Compared to traditional data, the features of big data can be characterized by 5Vs, namely, huge volume, high velocity, high variety, low veracity, and high value (Jin, Wah, Cheng, & Wang, 2015). Some predict, however, that big data's popularity will plummet as rapidly as it soared (Wixomet et al., 2014). This prediction is based on the challenges of big data, and the challenges center around the diversified data types (variety), timely response requirements (velocity), and uncertainties in the data (veracity) (Jin et al., 2015).

Though the shortcomings of big data are inevitable, at present, the world has completely entered the era of the information age, big data will definitely be a new point of economic growth. Big data has caused the scientific com- munity to re-examine its methodology of scientific research and has triggered a revolution in scientific thinking and methods. The classic example of big data analytics is the pio- neer study using Google search queries to detect epidemic

diseases in the society (George, Haas, & Pentland, 2009). Big data is of great value, which is beyond all doubt. Nature and Science have published special issues dedicated to discuss the opportunities and challenges brought by big data. What’s more, due to the great value of big data, it has been essen- tially changing and transforming the way we live, work and think (Viktor & Kemmeth, 2013). Big data, especially big networked data, contains a wealth of societal information and can thus be viewed as a network mapped to society. To this end, analyzing big data and further summarizing and finding clues and laws it implicitly contains can help us better per- ceive the present. Every field hopes to mine from big data demand-given information, knowledge and even intelligence and ultimately taking full advantage of the huge value of big data (Jin et al., 2015).

2.3. Semantic Network Analysis

Since the early 2000s, network science has begun to ad- vance rapidly with contributions from sociologists, mathemati- cians, and computer scientists. Various social network theories, network metrics, topology, and mathematical models have been developed that help understand network properties and relationships (e.g., centrality, betweenness, cliques, paths, ties, structural holes, structural balance; random network, small- world network, scale-free network) (Arney, 2009; Barabási &

Watts, 2002). In the social sciences, content analysis is the general name for the methodology and techniques to analyze the content of (media) messages (Krippendorff, 2004). An alternative content analysis method is called semantic network analysis or relational content analysis (Van Atteveldt, 2008).

Semantic network analysis analyzes the semantic pattern of a message through the relationship between the frequency of words and words used simultaneously in one sentence without assuming a specific nominal (Shim, Kim, Shon, & Lim, 2011). Semantic network analysis is based on the frequency of usage of the main words on the web, the link status between the main words, and the structure of the network (Kim, 2017a; Jo, & Kim, 2017). Semantic network analysis can be used as a useful methodology for understanding the flow of web materials (Kim, 2017b).

Xiang, Wober and Fesenmaier (2008) showed that quan-

titative textual analysis, particularly semantic network analysis,

provides a strong theoretical and methodological foundation

with which to describe the semantic nature of the online

tourism domain. In semantic network analysis, the semantic

(4)

structure, that is, “meanings”, of text can be constructed and represented in a variety of ways by establishing the associa- tions between different concepts. Different measures such as centrality and proximity can be derived to measure the structure of a semantic network and to compare the diffe- rences between two semantic structures (Carley,1997; Popping, 2000). Some studies indicated that a common vocabulary is essential because it is used to bridge the various “languages”

of computer systems and users so that meaning (i.e., se- mantics) can be established and shared between the system and the users. (i.e., Berners-Lee, Fischetti & Foreword By- Dertouzos).

3. METHODOLOGY

The web crawling and text mining were utilized for data collection, at the same time, the semantic network analysis was conducted to data analysis so as to possess a correspon- dingly thorough awareness of food hygiene for cruise tourism.

Data collection was from October 1st, 2015 to October 1st.

2017, during 2 years utilizing SCTM which is a program that is competent to collect data simultaneously and process data by generating words matrix <keywords × keyword>. As for the data analysis, UCINET 6.0 packaged with visualization tool- Netdraw was used and it mainly concentrated on the se- mantic network analysis about 90 extracted top frequency keywords from Internet-user generated raw data. Freeman's degree centrality, eigenvector centrality and proximity were chosen for the data analysis. According to Carley (1997), Pop- ping (2000), and Han et al. (2017), different measures such as centrality and proximity can be derived to measure the structure of a semantic network and to compare the diffe- rences between two semantic structures. Finally, CONCOR (CONvergence of iterated CORrelation) analysis results were visualized by Netdraw to illustrate a more intuitionistic visua- lization of the segmentation of the top frequency words.

4. RESULTS

“Food hygiene, cruise” as keywords were conducted to crawl on the Google web pages and news and there are 899 kb about 20,000 words were collected. A total of 90 words were extracted from the collected data to utilize for the data analysis with deleting redundant, repeated or unnecessary words such as I, and, have, etc. The top 90 high frequency

words were shown in Table 1. Meanwhile, the top frequency keywords visualization was manifested in Fig. 1.

The words such as food, cruise, health, safety, restaurant, hand, norovirus, etc. which are directly revelant to the cruise food hygiene had the hihg web visibility. And words demon- strating the locations of cruise tour, such as Thailand, Cari- bben, China, USA alos occuered frequnetly from the Internet collect data. What's more, the cruise brand also illustrated in the top 90 frequency keywords, for instance, Royal Caribbena, Princess, Costa, which are all worldwide well-known cruise lines.

The words collected with frequencies ranging from words such as “jobs” (5283) and “food” (2957) to many words with a frequency of one, even some other languages except for English, serves as the basis for understanding the Internet- user's awareness for cruise food hygiene. Fig. 2 demonstrated the distribution of top 90 words based upon frequency. As can be seen, words related cruise location, and cruise person like children, passenger, and staff possessed the high fre- quency.

The degree centrality is a measure of the extent to which a node is directly connected to other nodes on the network.

The greater the number of connected nodes, the higher of the degree of connectivity among them. As the degree of a node is the number of its adjacent nodes, the degree can be considered as a measure of local centrality. As the degree centrality depends on networks and the total number of nodes, Freeman (1979) proposed a relative (normalized) deg- ree centrality. The eigenvector centrality is a measure of the influence of a node in a network. Relative weights are assigned to all nodes in the network, based on the concept that connections to high-scoring nodes contribute more to the score of the node in question than an equal number of connections to low-scoring nodes (Gould, 1976). In other words, a node having many connections with other nodes has a high eigenvector centrality, on the contrary, a node with a few connections has a low eigenvector centrality.

Proximity is one of the most important measures in that

it can be used to measure the interrelationships between

words within a semantic network. Proximity estimates the

proportion of all geodesics linking to nodes (e.g., A and C)

that pass through a particular node (e.g., B) that is the second

to last node (i.e., the penultimate actor) on the geodesic. In

other words, on the geodesic that runs from actor A to C and

passed through B. B would be considered the penultimate

(5)

actor if the tie between B and C is the last edge of the geodesic. Proximity can therefore be thought of as a measure of the number of a node occurs in a penultimate position on a geodesic (Cunningham, Everton, & Murphy, 2016). Table 2 shows the comparison of 30 top frequency words' Freeman centrality, eigenvector centrality and proximity. As results, word “jobs” showed the highest frequency while the rank of

Table 1. Top keywords frequency of food “hygiene, cruise”

Rank Words Freq. % Rank Words Freq. % Rank Words Freq. %

1 Jobs 5,283 12.88 31 Caribbean 349 0.85 61 Onboard 183 0.45

2 Food 2,957 7.21 32 Conditions 340 0.83 62 Sick 181 0.44

3 Cruise 2,777 6.77 33 Staff 333 0.81 63 Symptoms 177 0.43

4 News 1,725 4.21 34 Baby 326 0.80 64 Beverage 176 0.43

5 Ship 1,378 3.36 35 Management 325 0.79 65 Death 166 0.40

6 Health 1,160 2.83 36 Family 314 0.77 66 Costa 154 0.38

7 Safety 1,084 2.64 37 Guests 313 0.76 67 Islands 119 0.29

8 Service 980 2.39 38 Crew 312 0.76 69 Economy 116 0.28

9 Passengers 933 2.28 39 Virus 310 0.76 68 Cleaning 116 0.28

10 Search 887 2.16 40 Comments 300 0.73 70 Cookie 115 0.28

11 Travel 777 1.89 41 Control 275 0.67 72 Prevention 114 0.28

12 Thailand 764 1.86 42 Illness 270 0.66 71 Insurance 114 0.28

13 Hygiene 693 1.69 43 Outbreak 269 0.66 73 Bangkok 113 0.28

14 Sport 649 1.58 44 Medical 267 0.65 75 Workers 112 0.27

15 Public 612 1.49 45 China 260 0.63 74 Vessel 112 0.27

16 Product 579 1.41 46 Privacy 259 0.63 77 New York 111 0.27

17 Hand 566 1.38 47 Entertainment 252 0.61 76 Action 111 0.27

19 Water 557 1.36 48 Standards 249 0.61 80 Government 110 0.27

18 Norovirus 557 1.36 49 Carnival 242 0.59 79 Excursions 110 0.27

20 Restaurant 516 1.26 50 Personal 239 0.58 78 Coffee 110 0.27

21 Local 491 1.20 51 Inspection 237 0.58 82 Production 109 0.27

22 Group 419 1.02 52 Disease 235 0.57 81 Ocean 109 0.27

23 Policy 403 0.98 53 Training 234 0.57 83 Responsible 108 0.26

24 Experience 401 0.98 54 USA 233 0.57 84 Cuba 106 0.26

25 Life 392 0.96 55 Princess 228 0.56 87 Protection 103 0.25

26 Holiday 383 0.93 56 Gastro 209 0.51 86 Problems 103 0.25

28 Woman 378 0.92 57 Port 207 0.50 85 Florida 103 0.25

27 RoyalCaribbean 378 0.92 58 Cabin 206 0.50 88 Wash 102 0.25

29 Children 372 0.91 59 Kitchen 203 0.50 89 Chicken 101 0.25

30 Hotel 359 0.88 60 Department 197 0.48 90 Fresh 99 0.24

proximity and centrality are low which stands from “jobs” are searched by many internet-users when refers to cruise food hygiene, however,” jobs” does not possess much relationship with other words and the influence of “jobs” is retrained.

The frequency rating of word” experience” is 24 while the

rank of centrality and proximity is relatively high, ranked 6

and 6 respectively, which means though this words are not

(6)

Fig. 1. Keywords visualization of network analysis.

Fig. 2. Distribution of top frequency keywords related to “food hygiene, cruise”.

exposed on the web text frequently, it is still strongly related to other words and affected other words. Mostly, the rank of centrality is similar with the rank of proximity; nevertheless, a node having a high degree of centrality does not necessarily have a high proximity. For example, the word “news” with the centrality rank 17 and 13 while the proximity rank is 60 which represents that this word is highly connected to other high- frequency words, nevertheless, this word is not in the central

of the network and the controlling force of this word to other is relatively low.

CONCOR is a method of repeatedly performing correlation

analysis to find an appropriate level of similarity groups by

performing correlation analysis repeatedly. This study con-

ducted CONCOR analysis based on semantic network analysis

results and it was performed in Fig. 3. And there are four

groups-food hygiene group, person group, location group and

(7)

Table 2. Comparison of keywords frequency, centrality and proximity for cruise food hygiene Words Freq. Rank Proximity Rank Freeman’s degree

centrality Rank Eigenvector

centrality Rank

Jobs 5,283 1 96.19 35 0.007 38 4.82 37

Food 2,957 2 134.50 2 0.047 5 28.16 8

Cruise 2,777 3 134.50 1 0.156 1 83.57 1

News 1,725 4 85.45 60 0.015 17 15.44 13

Ship 1,378 5 131.59 3 0.056 3 54.66 2

Health 1,160 6 112.93 11 0.005 45 3.04 47

Safety 1,084 7 93.32 39 0.005 47 3.17 46

Service 980 8 113.11 8 0.059 2 34.85 4

Passengers 933 9 115.25 7 0.033 8 31.85 5

Search 887 10 85.90 58 0.007 37 5.82 32

Travel 777 11 118.17 5 0.037 7 35.12 3

Thailand 764 12 63.62 80 0.001 82 0.75 78

Hygiene 693 13 95.88 36 0.002 72 0.79 76

Sport 649 14 55.01 83 0.002 70 0.97 72

Public 612 15 109.74 14 0.008 30 4.49 40

Product 579 16 87.14 55 0.020 13 11.38 18

Hand 566 17 105.13 21 0.003 53 2.46 53

Water 557 19 97.82 33 0.009 27 6.60 29

Norovirus 557 18 54.00 85 0.001 73 0.86 75

Restaurant 516 20 109.74 15 0.013 19 8.27 24

Local 491 21 107.84 18 0.028 10 14.92 14

Group 419 22 102.66 26 0.009 28 7.02 27

Policy 403 23 96.59 34 0.011 22 8.41 23

Experience 401 24 113.11 9 0.042 6 30.72 6

Life 392 25 99.86 31 0.007 35 4.72 38

Holiday 383 26 91.73 41 0.005 46 4.56 39

Woman 378 28 84.43 62 0.001 80 0.86 74

RoyalCaribbean 378 27 89.01 49 0.009 25 8.76 22

Children 372 29 89.53 46 0.003 58 2.18 54

Hotel 359 30 109.74 13 0.028 9 16.84 11

brand group were created after identifying the blocks of nodes according to the correlation coefficient of the matrices of the concurrent keywords and forms segmentations that include keyword with similarities (Wasseman & Fuast, 1994).

The results of CONCOR analysis are as follows. There are four clusters created by conducting CONCOR analysis with UCINET 6.0. program. The person related group includes

words who are relevant to the cruise food hygiene, such as

woman, children, crew, guest, passenger, workers, etc. Loca-

tion related group consists of Thailand, Bangkok, Florida, China,

and Caribbean, Cuba and so on, which contains countries and

specific cities. The words like islands, port also are segmented

into this group. Virus, norovirus, hygiene, food, safety, coffee,

sick and some other words belong to the food hygiene direct

(8)

Fig. 3. Visualization with CONCOR analysis.

related group which showed the strong connection with the cruise food hygiene. For the brand related group, cruise brand like Royal Caribbean, Costa, Princess and Carnival are exposed in this cluster and service, management, onboard which related to the cruise operators are also illustrated in this segmentation.

5. CONCLUSION & DISCUSSION

Big data has emerged as an important area of study both for practitioners and researchers and at the same time, cruise tourism has sprung up in the leisure tourism market as a significant driving force for the tourism development. Con- sequently, studies and researches about these two fields res- pectively are sufficient while the utilizing big data to study cruise industry is limited. This study analyzed a total of 90 words relevant to cruise food hygiene through semantic network analysis by using big data and mainly focused on the centrality analysis (Freeman's degree centrality and Eigen- vector centrality), proximity analysis and CONCOR analysis, utilizing UCINET 6.0 packaged with Netdraw which is for visualization.

The words such as jobs, food, safety, service, Thailand, passenger, Royal Caribbean, etc. illustrated the high web visibility which represents different respects for cruise food

hygiene, such as the person related group and destination group. The degree centrality, eigenvector centrality and pro- ximity of keywords were calculated to figure out the connec- tivity, the influential keywords and the central controlling words among these most frequency words. The CONCOR analysis was performed to categorize the understanding and awareness of the Internet-users so that it can be helpful to be clear of the implications for empirical application. After the CONCOR analysis, the top 90 frequent words are categorized into 4 clusters. There is a cluster of brand related group, which means when consumers refer to the cruise food hygiene, they talked about the cruise brand, that is, it is instrumental for cruise lines to establish their brand image in terms of the facet of food hygiene since the customers possess the recog- nition and awareness of brand image when they referred to the food hygiene issues of cruise.

With the respect to cruise food hygiene directly related

category, words “food”, ”safety”, ”norovirus”, ”hygiene” were

comprised and the kernel word” food” manifest the similar

rank with frequency, centrality and proximity which expresses

that “food” not only inseparably related to other words but

also conceived the influential position in the semantic net-

work. The implications of this study revealed both for acade-

mia and empirical applications. Attached to the respect of

implications for academia, this study provided a new para-

(9)

digm for the research of cruise food hygiene with utilizing big data analytics which not only provides new application direction of big data but also furnishes the novel research method for the cruise industry without the restrictions of time and space due to the merits of the big data. In terms of the empirical proposals, this study performed that the food safety and hygiene issues are essential for the cruise industry, for instance, there is a cluster referring to cruise brand which implies that it is vital for cruise corporation to build their brand image with cruise food hygiene issues, moreover, the segmentation of destinations of cruise stated clearly that cultivated personality of cruising destinations is incumbent.

What’s more, the person group of cruise food hygiene includes crew, workers and passengers, woman, baby and family which refers that the cruise food hygiene is not relative to guests singly but also matters the cruise staff. That illustrated build food hygiene of cruise is both significant for their market attraction and their staff maintenance.

This study should be interpreted with caution since it is subject to at least 3 limitations. First, the internet generated materials are difficult to identify the information resource since he or she can be the consumer or the market-provider which implies that we only can utilize these collected data as a reference data instead of simply using these data as an accurate consumer data resource. Second, the online infor- mation is raw and unstructured, therefore, the collected data to some extent exists the spelling mistakes or grammar mistakes or the different expression habits from the infor- mation-producer, and thus the data is inevitable to be deviant.

For example, Words, hand and wash are shown separately in the collected data, which does make sense, it may be searched as phrase “wash hand” while generally, handwashing was conducted to the text use, like Chimonas et al. (2008) studied handwashing is a widely advocated means of reducing norovirus transmission and provides a significant protective effect in cruise ship outbreaks. Finally, the cognition and understanding of food hygiene for the general customers is limited and infinite, so the search information posted on the internet is also lack and thus, the collected data is not sufficient, that means, using big data is also limited by the research topic and this one determine the volume of data you can collect.

For the future research, when we conduct a specific research theme, firstly, it is necessary to narrow the data collection scope to relatively purify the sophisticated statistics

and then, the analytical skills are supposed to develop more to promote and perfect the usage of big data.

REFERENCES

Addiss, D. G., Yashuk, J. C., Clapp, D. E., & Blake, P. A. (1989).

Outbreaks of diarrhoeal illness on passenger cruise ships, 1975-85. Epidemiology & Infection, 103(1), 63-72.

Arney, C. (2009). Linked: how everything is connected to everything else and what it means for business, science, and everyday life. Mathematics & Computer Education, 43(3), 271.

Barabási, A. L., & Watts, D. J. (2002). Six Degrees: the Science of a Connected Age.

Berners-Lee, T., Fischetti, M., & Foreword By-Dertouzos, M. L.

(2000). Weaving the Web: The original design and ulti- mate destiny of the World Wide Web by its inventor.

Harper Information.

Carley, K. M. (1997). Extracting team mental models through textual analysis. Journal of Organizational Behavior, 533- 558.

Chin, C. B. (2008). Cruising in the global economy: Profits, plea- sure and work at sea. Ashgate Publishing, Ltd..

CLIA (2015), Cruise Line International Association.

Collins English Dictionary (2010), Collins English dictionary.

Bishop Briggs, Glasgow: Harper Collins.

Cramer, E. H., Blanton, C. J., Blanton, L. H., Vaughan, G. H., Bopp, C. A., Forney, D. L., & Vessel Sanitation Program Environmental Health Inspection Team (2006). Epidemio- logy of gastroenteritis on cruise ships, 2001-2004. Ameri- can Journal of Preventive Medicine, 30(3), 252-257.

Cramer, E. H., Gu, D. X., Durbin, R. E., & Vessel Sanitation Program Environmental Health Inspection Team. (2003).

Diarrheal disease on cruise ships, 1990-2000: the impact of environmental health programs. American Journal of Preventive Medicine, 24(3), 227-233.

Cunningham, D., Everton, S., & Murphy, P. (2016). Understan- ding dark networks: A strategic framework for the use of social network analysis. Rowman & Littlefield.

Freeman, L. C. (1979). Centrality in social networks conceptual clarification. Social Networks, 1(3), 215-239.

George, G., Haas, M. R., & Pentland, A. (2014). Big data and management. Academy of Management Journal, 57(2), 321-326.

Gould, S. J. (1997). Nonoverlapping magisteria. Natural History,

(10)

106(2), 16-22.

Han, S. I., Kim, T. H., Lee, J. H. & Kim, H. S. (2017). A study on the application of SNS big data to the industry in the fourth industrial revolution. Culinary Science & Hospitality Research, 23(7), 1-10.

Jin, X., Wah, B. W., Cheng, X., & Wang, Y. (2015). Significance and challenges of big data research. Big Data Research, 2(2), 59-64.

Jo, A., & Kim, H. S. (2017). A comparison of Starbucks between South Korea and U.S.A. through big data analysis. Culinary Science & Hospitality Research, 23(8), 195- 205.

Kak, V. (2007). Infections in confined spaces: Cruise ships, military barracks, and college dormitories. Infectious Disease Clinics of North America, 21(3), 773-784.

Kim, H. S. (2017a). A semantic network analysis of big data regarding the food exhibition on convention center. Culi- nary Science & Hospitality Research, 23(3), 257-270.

Kim, H. S. (2017b). An exploratory study on the semantic network analysis of food tourism through the big data.

Culinary Science & Hospitality Research, 23(4), 22-23.

Klein, R. A. (2011). Responsible cruise tourism: issues of cruise tourism and sustainability. Journal of Hospitality & Tourism Management, 18(1), 107-116.

Koo, D., Maloney, K., & Tauxe, R. (1996). Epidemiology of diarrheal disease outbreaks on cruise ships, 1986 through 1993. Jama, 275(7), 545-547.

Krippendorff, K. (2004). Content analysis: An introduction to its methodology. Sage.

Kwortnik, R. J. (2008). Shipscape influence on the leisure cruise experience. International Journal of Culture, Tourism &

Hospitality Research, 2(4), 289-311.

Marmot, M., Friel, S., Bell, R., Houweling, T. A., Taylor, S., &

Commission on Social Determinants of Health. (2008).

Closing the gap in a generation: health equity through action on the social determinants of health. The Lancet, 372(9650), 1661-1669.

Petrick, J. F., Tonner, C., & Quinn, C. (2006). The utilization of critical incident technique to examine cruise passengers repurchase intentions. Journal of Travel Research, 44(3), 273-280.

Popping, R. (2000). Computer-assisted text analysis. Sage.

Rodrigue, J. P., & Notteboom, T. (2013). The geography of cruises: Itineraries, not destinations. Applied Geography, 38, 31-42.

Shim, H. J., Kim, Y. C., Shon, H. Y., & Lim, J. Y. (2011). An

exploratory usage pattern research of smartphone and social media users through semantic network analysis:

Gender and age differences in perception and evaluation of usage pattern. Korean Journal of Broadcasting, 25(4), 28-138.

Shuting, T., & Kim, H. S. (2017). A study of comparison bet- ween cruise tours in China and USA through big data analy- tics. Culinary Science & Hospitality Research, 23(6), 1-11.

Sun, X. D., & Feng, X. G. (2012). China cruise tourism industry:

Research status and prospects. Journal of Tourism, (2), 101-112.

Tomaszunas, S., Renke, W., Filikowski, J., Rzepiak, M., &

Zaborski, L. (1997). Diseases and work-related injuries in Polish seafarers and conditions of their work on foreign- flag ships. Bulletin of the Institute of Maritime & Tropical Medicine in Gdynia, 48(1-4), 49-58.

Van Atteveldt, W. H. (2008). Semantic network analysis: Tech- niques for extracting, representing, and querying media content.

Viktor, M. S., & Kenneth, C. (2013). Big data: A revolution that will transform how we live, work, and think. Houghton Mifflin Harcourt.

Walker, E., Pritchard, C., & Forsythe, S. (2003). Food handlers’

hygiene knowledge in small food businesses. Food Con- trol, 14(5), 339-343.

Wang, Y. (2015). The rise of the ‘shareholding state’: financiali- zation of economic management in China. Socio-Economic Review, 13(3), 603-625.

Wixom, B., Ariyachandra, T., Douglas, D. E., Goul, M., Gupta, B., Lyer, L. S., ... & Turetken, O. (2014). The current state of business intelligence in academia: The arrival of big data. CAIS, 34, 1.

Xiang, Z., Schwartz, Z., Gerdes, J. H., & Uysal, M. (2015). What can big data and text analytics tell us about hotel guest experience and satisfaction? International Journal of Hospi- tality Management, 44, 120-130.

Xiang, Z., Wöber, K., & Fesenmaier, D. R. (2008). Representation of the online tourism domain in search engines. Journal of Travel Research, 47(2), 137-150.

Ye, Q., Law, R., & Gu, B. (2009). The impact of online user reviews on hotel room sales. International Journal of Hos- pitality Management, 28(1), 180-182.

Received:

Revised:

Accepted:

11 December, 2017

20 February, 2018

23 February, 2018

수치

Table 1. Top keywords frequency of food “hygiene, cruise”
Fig. 2. Distribution of top frequency keywords related to “food hygiene, cruise”.
Table 2. Comparison of keywords frequency, centrality and proximity for cruise food hygiene Words Freq
Fig. 3. Visualization with CONCOR analysis.

참조

관련 문서

1 John Owen, Justification by Faith Alone, in The Works of John Owen, ed. John Bolt, trans. Scott Clark, &#34;Do This and Live: Christ's Active Obedience as the

In this study, the different codes were compared and analyzed for the research on decontamination and decommissioning waste generation by using the codes

2) the process of underground mining generates a rock structure consisting of voids, support elements and abutment; mechanical performance of the structure is amenable to

Thus, this study has researched the literature study of the current statistic data and study article and field survey in some farm households, analysis

Objective: The purpose of this study was to investigate the effect of clinical practice satisfaction on professional self-concept among dental hygiene students.. Methods:

In this study, the existing material of the air conditioner compressor and Al6061 material were applied through structural analysis and fluid-structure coupling analysis using

Data were analyzed using independent-sample t tests for checking the equivalency between the experimental and control groups at pretest and three-way analysis

This paper also analyzed the current status of the competitive power of 10 major ports in China using efficiency and SWOT analysis and sought the