Received: March 4, 2013; Accepted: March 24, 2013 Corresponding author : Sang-Man Cho
Tel: +82 (63) 469-1839 e-mail: [email protected] 1225-3480/24468
This is an Open Access article distributed under the terms of the Creative Commons Attribution Non-Commercial License with permits unrestricted non-commercial use, distribution, and reproducibility in any medium, provided the original work is properly cited.
Study on Optimal Condition for Oyster Rack Culture in terms of tidal exposure and rack
height in Wando Coast, Korea
Hyon Sob Han1 and Sang-Man Cho2
1West Sea Fisheries Research Institution of NFRDI, Incheon 400-420, Republic of Korea
2Department of Aquaculture and Aquatic Science, Kunsan National University, 558 Deahangno, Gunsan, Jeonbuk 573-701, Republic of Korea
ABSTRACT
We investigated the growth performance of oysters (initial shell height 57.5 ± 8.5 mm) under differing conditions of tidal exposure time and culture rack height in an experiment that commenced in April, 2011. Significant differences were observed in shell height from June 2011, in total weight from August, and in meat weight from September.
Fatness tended to decrease during the experimental period, but was not significantly different at the end of the experiment. Significant differences in survival rates were mainly observed from June to August. After September, further changes were not observed in any experimental treatment group. The greatest growth potential (L∞) and survival rate were observed at a sea level of approximately 116 cm. The results indicate that in the study area the use of oyster culture conditions involving 1 or 2 h of tidal exposure and 60 - 70 cm rack height could result in oysters reaching the favored commercial half shell size within 14 months, with > 80% survival.
Keywords: Pacific oyster, rack culture, off-bottom culture
Introduction
The southwestern coast of Korea is renowned for Porphyra aquaculture, and accounts for approximately 85% of national production (Lee, 2006). Annual production decreased from the mid-1990s since reached a peak of 265,581 million tons in 1995 (Lee, 2006). Wando (the study area) is the one of the most famous Pophyra aquaculture areas. Laver farming has a 200-year history, and Wando is the largest production area, accounting for 22% of annual national production. In 2006 approximately 2.3 million tons of green laver was exported from Wando to the United States, Japan, and Taiwan. However, as
a consequence of environmental change, including global warming and demographic and industrial changes, sustainable Porphyra aquaculture has become increasingly difficult.
Oyster rack culture was introduced to Korea in the late 1990s, as an alternative to Porphyra culture for fisheries production. Following the MT Hebei Spirit oil spill in 2007, oyster rack culture has rapidly expanded along the west coast of Korea as part of the restoration of intertidal fisheries.
Oyster cultural racks are commonly established in locations that provide a 2 - 5 h exposure time and 60 cm rack heights. Rack culture was introduced as a substitute for traditional tidal flat fisheries, and was expected to provide a comparable annual income to the hanging culture method. Rack culture facilities have been introduced in 20 areas (29.2 ha) on the west coast of Korea, with production of 160 million oysters/year (Kim, 2010), but annual production has varied among localities because development of the industry has mainly been driven by private sector.
In this study we introduced oyster rack culture to
Fig. 1. Map of cultural site for the experiment at Yeonghueng, Wando coast, Korea.
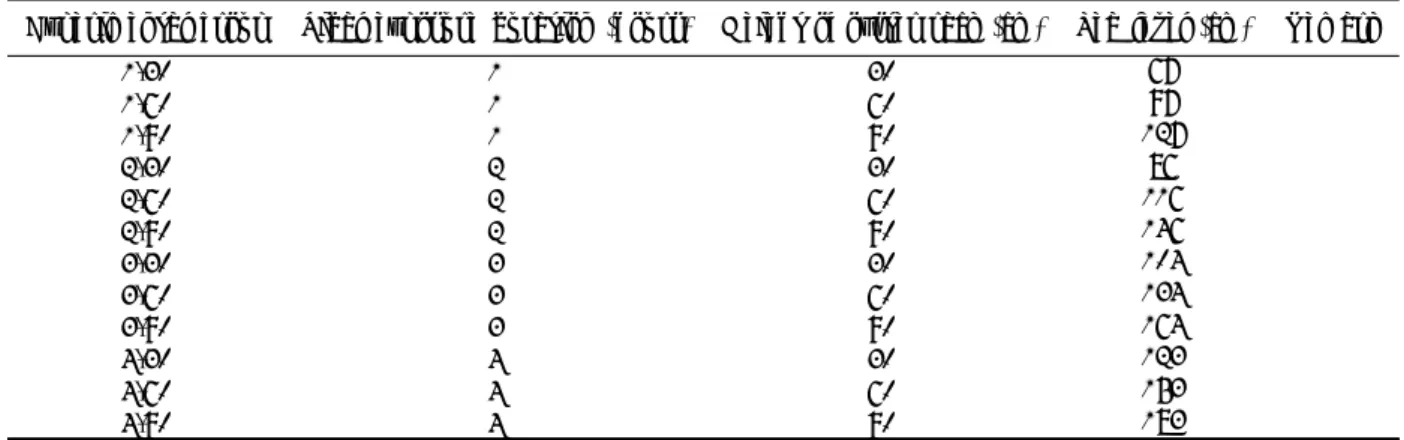
Experimental group Tidal exposure duration (hours) Height of oyster rack (cm) Sea level (cm) Remark
1-30 1 30 67
1-60 1 60 97
1-90 1 90 127
2-30 2 30 86
2-60 2 60 116
2-90 2 90 146
3-30 3 30 104
3-60 3 60 134
3-90 3 90 164
4-30 4 30 123
4-60 4 60 153
4-90 4 90 183
Table 1. Oyster growth conditions at the study site
Porphyra cultural beds in the intertidal zone of Wando Island and assessed the effect of several rack culture conditions on oyster growth and mortality, with the aim of determining the optimal conditions for maximizing production.
Materials and Methods 1. Study site
Wando Island is located in the southern part of the Korean peninsula (Fig. 1), which comprises 256 islands with 839 km of shoreline. The annual average water temperature and salinity range from 6.37 to 23.0℃ and 31.21 to 33.92 psu, respectively (KHOA, 2011). The study site, at Yeonghueng-ri is located in the northern part of the island and is bordered by a narrow channel separating Heanam, Gohueng, and Wando islands. The intertidal zone at the
Yeonghueng-ri site is mainly composed of a mudsand flat that has a typical semidiurnal tidal cycle, and is suitable for short-neck clam and rock oyster cultural beds.
2. Oyster racks
A total of 12 oyster racks were installed to assess the effect of two conditions: duration of tidal exposure and rack height. Each oyster rack included 5 plastic mesh bags (1 × 0.5 m; 5 mm mesh), each containing 200 oysters. Four tidal exposure times (1, 2, 3, and 4 h) were tested, and the tidal level was determined and standardized from daily forecast data for March 2011 (KHOA, 2011). Three heights were tested for each tidal exposure condition (Table 1).
3. Biological measurements
Triploid oysters were obtained from Seaever Ltd.
(Seochon, Korea). On 17 April, 2011 a total of 12,000 oysters (57.5 ± 8.5 mm shell height) were randomly allocated to 60 plastic mesh bag and the bags were transferred to the oyster racks. Oyster samples were collected on a monthly basis from April 2011 to March 2012, and used to determine the shell height (SH, mm), total weight (TW, g), and meat weight (MW, g). Fatness was also calculated from the equation: Fatness = MW/TW × 100. Mortality was also monitored monthly from two bags in each experimental treatment (n = 2).
4. Statistical analysis
Statistical analysis was carried out using Sigmaplot
Group 2011 2012
May Jun. Jul. Aug. Sep. Oct. Nov. Dec. Jan. Feb. Mar.
1-30 60.0 ± 7.5bc
75.5 ± 4.0ab
76.2 ± 9.7ab
79.6 ± 6.3bc
83.4 ± 5.2ab
82.3 ± 5.6
85.3 ± 7.0bcd
80.6 ± 8.6c
88.9 ± 12.1ab
90.4 ± 7.5b
88.7 ± 8.9bcd 1-60 63.4 ±
7.0abc
79.3 ± 8.5a
80.1 ± 6.2a
84.1 ± 9.4abc
86.0 ± 10.3a
87.0 ± 10.3
95.0 ± 11.5ab
91.6 ± 11.7ab
95.4 ± 7.6a
92.1 ± 7.4b
99.1 ± 5.8a 1-90 67.9 ±
6.9abc
76.7 ± 4.1abc
74.0 ± 8.5ab
84.4 ± 5.9a
81.8 ± 10.2ab
86.3 ± 10.2
93.9 ± 13.6abc
94.4 ± 10.6a
95.6 ± 11.1a
87.6 ± 8.1b
91.1 ± 6.3bc 2-30 61.7 ±
8.0abc
76.4 ± 9.2abc
76.2 ± 11.3ab
74.8 ± 7.6c
79.0 ± 7.4ab
84.2 ± 8.6
83.9 ± 5.1cd
80.0 ± 13.5c
87.5 ± 11.5ab
92.6 ± 8.2b
85.8 ± 6.1cd 2-60 64.3 ±
9.8abc
76.3 ± 8.2abc
79.9 ± 13.1a
78.6 ± 8.3bc
81.5 ± 9.5ab
87.1 ± 10.9
98.4 ± 9.7a
85.8 ± 14.8abc
98.0 ± 14.2a
103.2 ± 12.2a
95.1 ± 7.3ab 2-90 68.5 ±
7.0ab
75.0 ± 9.3abc
78.2 ± 7.2a
87.1 ± 8.8ab
81.8 ± 7.6ab
88.8 ± 8.2
93.7 ± 6.9abc
95.9 ± 8.4a
95.0 ± 10.0ab
87.3 ± 12.4b
87.6 ± 5.3cd 3-30 59.7 ±
6.5c
78.0 ± 8.2abc
76.8 ± 8.0a
74.6 ± 5.7c
80.4 ± 7.8ab
79.5 ± 11.1
90.8 ± 10.9abcd
91.8 ± 10.5ab
86.4 ± 5.6ab
87.1 ± 8.1b
91.3 ± 6.9bc 3-60 67.8 ±
6.3abc
73.4 ± 8.8abc
72.5 ± 10.5ab
81.9 ± 7.2abc
84.1 ± 12.3ab
88.0 ± 12.2
86.0 ± 9.4bcd
97.6 ± 9.6a
87.5 ± 13.0ab
90.6 ± 10.0b
91.0 ± 6.9bc 3-90 69.8 ±
6.3a
70.2 ± 6.5abc
66.1 ± 8.9P
76.2 ± 6.5c
76.7 ± 6.3ab
89.5 ± 13.3
80.5 ± 11.3d
86.5 ± 10.3
82.9 ± 11.2b
90.0 ± 8.1b
82.7 ± 5.2d 4-30 61.8 ±
5.8abc
77.4 ± 2.1abc
79.3 ± 12.1P
79.9 ± 6.4bc
79.2 ± 7.2ab
80.6 ± 8.2
82.9 ± 7.0d
82.3 ± 9.9bc
88.6 ± 9.0ab
87.3 ± 8.3b
87.1 ± 6.9cd 4-60 66.5 ±
7.7abc
73.9 ± 8.4abc
75.0 ± 9.7ab
81.3 ± 7.5abc
83.2 ± 9.2ab
78.7 ± 15.2
83.7 ± 10.8cd
89.4 ± 9.9abc
90.1 ± 12.2ab
92.3 ± 12.1b
88.1 ± 7.7cd 4-90 67.9 ±
9.3abc
67.8 ± 8.8c
71.5 ± 8.0ab
72.6 ± 13.4c
75.0 ± 5.7b
82.3 ± 7.6
79.2 ± 8.6d
78.6 ± 7.0c
85.9 ± 6.8ab
90.7 ± 16.2b
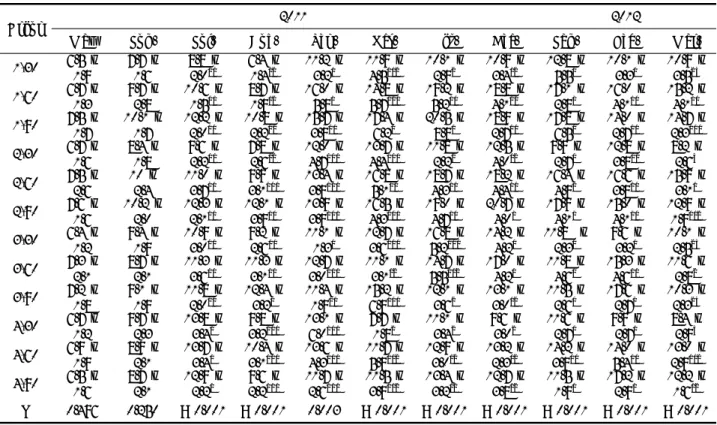
86.7 ± 4.8cd P < 0.001 0.030 0.004 < 0.001 0.024 0.034 < 0.001 < 0.001 0.001 0.003 < 0.001 Table 2. Monthly growth in oyster shell height (mm) under the each cultural condition at Yeonghueng, Wando coast, Korea
software (Ver. 11.0, Systat Software, Inc., San Jose, CA). Group mean values and standard deviation were calculated. Following homogeneity analysis, the data were analyzed using analysis of variance (ANOVA), and significant results were analyzed using the multiple comparison Student-Newman-Keuls (SNK) test. A Bertalanffy growth curve was estimated using nonlinear regression of exponential rise to maximum mode. To assess the optimal sea level for growth and survival we also used nonlinear regression of peak mode.
Results
1. Growth
A difference in oyster growth (initial shell height 57.5 ± 8.5 mm) was observed from May in the racks at 90 cm height with the exception of 4-90 treatment group (P < 0.001). No significant differences were observed between the oysters in the racks at 60 and
30 cm height (P > 0.05). From June the growth differences increased significantly (P = 0.030), but were not significant in October (P = 0.159). From November the growth pattern was very different from that in spring, with greater growth being found in the racks at 60 cm (P < 0.001). At the end of the experiment the greatest growth was observed in the 1-60 group (99.1 ± 5.8 mm), while the least growth was found in the 3-90 group (82.7 ± 5.2 mm) (Table 2). The estimated constants of the Bertalanffy growth curve are shown in Table 3.
No differences in total weight were observed until July, with the exception of 3-90 in July (30.9 ± 6.8 g;
P = 0.005). From August, significant differences were observed amongst the experimental treatment groups, with greater growth usually being found in the racks at 60 and 90 cm height than those at 30 cm. At the end of the experiment there was a tendency for greater meat production to be associated with shorter
Constant
Experimental group
1-30 1-60 1-90 2-30 2-60 2-90 3-30 3-60 3-90 4-30 4-60 4-90
L∞ 88.0 97.9 94.2 89.4 106.8 92.7 92.7 95.7 87.4 86.6 92.4 94.0
K 0.344 0.272 0.308 0.257 0.163 0.357 0.239 0.237 0.241 0.361 0.239 0.133 t0 -1.98 -2.22 -2.07 -3.03 -3.86 -1.70 -2.99 -2.94 -3.64 -1.96 -3.23 -6.64 Table 3. Estimated constants for the Bertalanffy growth curve for oysters reared under each cultural condition
Group 2011 2012
May Jun. Jul. Aug. Sep. Oct. Nov. Dec. Jan. Feb. Mar.
1-30 22.6 ± 6.1
37.4 ± 8.6
44.2 ± 13.1a
40.5 ± 6.5d
56.6 ± 5.5abc
47.6 ± 13.3ab
54.2 ± 14.6c
56.0 ± 12.8d
72.9 ± 21.8cde
69.4 ± 20.7c
73.2 ± 18.3bcd 1-60 24.0 ±
4.9 39.2 ±
9.7 44.1 ±
7.4a 45.4 ±
9.4abcd 64.2 ±
15.6ab 55.9 ±
16.5a 84.6 ±
23.0ab 84.3 ±
19.1ab 81.5 ±
16.6bcd 98.9 ±
21.8ab 92.5 ± 13.4a 1-90 28.2 ±
5.5
38.4 ± 7.7
47.8 ± 14.7a
50.7 ± 12.4a
67.7 ± 13.6a
65.3 ± 17.9a
88.7 ± 28.7a
97.0 ± 18.8a
102.1 ± 31.4a
96.4 ± 23.3ab
83.6 ± 12.9ab 2-30 24.0 ±
6.1
35.1 ± 8.6
42.1 ± 12.1a
37.7 ± 9.6d
54.3 ± 14.5abc
52.1 ± 9.6ab
54.2 ± 8.5c
60.3 ± 20.6d
52.2 ± 13.3e
86.0 ± 17.1bc
63.6 ± 10.8d 2-60 26.4 ±
9.0
36.9 ± 7.6
43.2 ± 15.9a
43.3 ± 11.4bcd
59.2 ± 13.0abc
60.7 ± 17.0a
80.5 ± 13.3ab
78.5 ± 14.9bc
86.8 ± 23.3abc
116.7 ± 27.1a
91.5 ± 14.5a 2-90 29.2 ±
5.9
36.7 ± 8.4
43.0 ± 7.7a
56.0 ± 14.5ab
60.9 ± 13.2abc
67.1 ± 17.9a
92.3 ± 20.0a
94.9 ± 17.9a
97.9 ± 19.2ab
94.5 ± 23.0ab
78.1 ± 10.6bc 3-30 23.2 ±
4.7
37.9 ± 6.0
40.1 ± 10.8a
39.9 ± 6.9cd
50.9 ± 9.7bc
50.4 ± 9.9ab
70.8 ± 17.8abc
70.3 ± 18.5bcd
62.9 ± 14.0de
80.2 ± 20.6bc
75.9 ± 10.9bcd 3-60 28.3 ±
7.2
33.3 ± 7.5
37.2 ± 13.4a
50.7 ± 8.7abcd
55.4 ± 13.5abc
51.7 ± 13.8ab
69.5 ± 16.1bc
85.3 ± 17.0ab
64.3 ± 21.3de
98.0 ± 23.8ab
80.9 ± 11.9ab 3-90 27.7 ±
6.2
33.9 ± 5.8
30.9 ± 6.8b
48.0 ± 12.0abcd
51.1 ± 9.3bc
61.7 ± 21.5a
59.7 ± 12.5bc
70.6 ± 13.4bcd
65.3 ± 13.7de
93.1 ± 10.2ab
66.0 ± 10.0cd 4-30 25.0 ±
4.6
38.5 ± 6.1
44.4 ± 14.2a
40.0 ± 6.8cd
54.5 ± 12.8abc
35.7 ± 7.9b
53.1 ± 15.9c
52.3 ± 18.2d
64.8 ± 19.4de
76.6 ± 15.1bc
64.5 ± 13.6d 4-60 26.3 ±
6.2
35.0 ± 6.8
42.1 ± 11.7a
52.6 ± 21.7abc
59.1 ± 13.8abc
51.9 ± 19.7ab
65.6 ± 15.4bc
70.4 ± 16.7bcd
77.7 ± 22.2cd
85.8 ± 26.8bc
78.8 ± 12.7b 4-90 26.6 ±
7.3
34.1 ± 10.1
39.1 ± 8.5a
37.8 ± 6.5d
48 ± 10.0c
49.1 ± 12.4ab
66.8 ± 17.3bc
65.7 ± 16.5cd
65.0 ± 10.9de
115.9 ± 28.1a
76.0 ± 9.8bcd P 0.059 0.401 0.027 < 0.001 < 0.001 < 0.001 < 0.001 < 0.001 < 0.001 < 0.001 < 0.001 Table 4. Monthly variations in total weight (g) of oysters reared under the each cultural condition at Yeonghueng, Wando coast,
Korea
exposure, with the greatest total weight being recorded in the 1-60 treatment group (Table 4).
The initial meat weight in April was 6.1 ± 1.3 g, and no significant differences were observed among the experimental treatments until June (P = 0.496 for May, and P = 0.250 for June). However, there was a slight increase in the meat weight in the 4 h tidal exposure treatment in July (P < 0.001), with the height of the oyster rack being the main factor affecting growth during summer (P < 0.001). From
September, greater meat weight was found with shorter exposure time, but the meat weight of oysters in the 30 cm height treatment was significantly less than others during autumn. The greatest meat weight was observed in 2-90 in December (20.7 ± 4.0), and this decreased slightly after January 2012 (Table 5).
At the end of the experiment the rack height was a significant factor for oyster meat growth, with an apparently negative effect on meat weight.
Group 2011 2012
May Jun. Jul. Aug. Sep. Oct. Nov. Dec. Jan. Feb. Mar.
1-30 6.5 ± 1.9
7.7 ± 1.6
8.8 ± 2.0bc
6.4 ± 1.4cd
11.2 ± 3.2c
11.9 ± 4.5bcd
10.1 ± 2.9d
10.9 ± 3.4cd
12.8 ± 5.5b
10.1 ± 3.3c
10.9 ± 3.5de 1-60 6.7 ±
1.3
9.7 ± 2.8
10.6 ± 1.5bc
8.7 ± 1.9cd
16.0 ± 5.8a
14.8 ± 5.7abc
19.2 ± 5.2ab
18.8 ± 4.1ab
17.1 ± 2.8a
16.0 ± 4.1ab
15.2 ± 4.1ab 1-90 7.5 ±
1.7
10.1 ± 1.7
12.2 ± 2.0ab
10.8 ± 2.2ab
15.7 ± 3.8ab
17.4 ± 6.2a
20.5 ± 8.8a
18.9 ± 2.7ab
17.8 ± 6.5a
14.0 ± 2.7ab
14.7 ± 2.3abc 2-30 6.7 ±
1.6
8.4 ± 1.8
9.6 ± 2.2bc
7.8 ± 2.6cd
12.0 ± 4.7abc
13.7 ± 4.4abc
11.8 ± 2.2d
12.5 ± 4.0cd
9.9 ± 2.7b
12.8 ± 3.8bc
8.2 ± 2.6e 2-60 7.5 ±
2.6
10 ± 2.4
11.0 ± 3.7ab
9.9 ± 3.1abc
13.4 ± 3.9abc
16.8 ± 5.1bc
18.7 ± 4.3ab
18.2 ± 4.4ab
16.4 ± 4.9a
16.6 ± 3.8ab
15.9 ± 3.1a 2-90 7.6 ±
1.6
10.2 ± 2.0
12.3 ± 2.1ab
12.1 ± 3.9ab
13.9 ± 3.9abc
16.5 ± 4.3abc
19.0 ± 4.7ab
20.7 ± 4.0a
17.9 ± 4.1a
15.0 ± 4.1ab
12.9 ± 1.9bcd 3-30 6.4 ±
1.2 9.4 ±
1.9 10.9 ±
3.0ab 9.2 ±
2.6bc 11.1 ±
1.3c 12.7 ±
3.6abc 16.8 ±
5.2abc 14.2 ±
4.2c 11.8 ±
2.3b 9.6 ±
3.2c 10.1 ± 2.5de 3-60 7.3 ±
2.1
8.7 ± 2.1
11.3 ± 3.6ab
11.3 ± 3.1ab
12.7 ± 3.0abc
11.1 ± 3.1cd
14.7 ± 5.5bcd
17.0 ± 4.2b
11.8 ± 4.6b
15.3 ± 4.6ab
11.6 ± 2.8d 3-90 7.2 ±
1.8
9.1 ± 1.9
11.8 ± 2.0ab
12.4 ± 3.2a
11.4 ± 1.9bc
15.2 ± 6.9abc
12.1 ± 3.6d
13.1 ± 3.0cd
11.5 ± 2.6b
17.6 ± 2.7a
10.3 ± 2.3de 4-30 6.7 ±
1.2 9.7 ±
2.3 13.8 ±
3.4a 9.8 ±
3.2abc 13.1 ±
6.0abc 7.7 ±
1.8d 11.1 ±
3.4d 9.6 ±
3.0d 11.6 ±
2.7b 9.9 ±
2.7c 8.4 ± 2.9e 4-60 6.9 ±
1.9
8.9 ± 2.1
13.7 ± 3.4a
10.4 ± 3.1abc
13.6 ± 4.3abc
11.7 ± 5.9bcd
12.9 ± 3.0cd
13.2 ± 2.3cd
14.2 ± 3.9ab
14.0 ± 5.4ab
13.0 ± 2.9bcd 4-90 6.5 ±
1.6
8.7 ± 2.1
12.9 ± 2.2a
9.6 ± 2.2abc
11.7 ± 2.6abc
11.5 ± 3.9bcd
13.4 ± 3.2cd
12.7 ± 3.8cd
11.5 ± 1.9b
17.2 ± 2.9a
12.2 ± 1.6cd P 0.496 0.250 < 0.001 < 0.001 0.003 < 0.001 < 0.001 < 0.001 < 0.001 < 0.001 < 0.001 Table 5. Monthly variationsin meat weight (g) of oysters reared under the each cultural condition at the rearing facility at
Yeonghueng, Wando coast, Korea
Month
4 5 6 7 8 9 10 11 12 1 2 3
Fatness (%)
0 10 20 30 40 50
1-30 1-60 1-90 2-30 2-60 2-90 3-30 3-60 3-90 4-30 4-60 4-90
2011 2012
Fig. 2. Monthly variations in the fatness of oysters reared under the each cultural condition at Yeonghueng, Wando coast, Korea. Data are means and standard deviations.
2. Fatness
Fatness measurements ranged from 11.9 ± 2.3 to 38.96 ± 4.6, but significant differences were only observed in July and August (P < 0.001). During the experimental period the fatness index was higher with longer exposure times; the lowest fatness indices were
observed with exposure times of 1 and 2 h. After September, no significant differences were observed between experimental treatments (P > 0.05). There was a trend of decreasing fatness during the experimental period, but no significant differences were evident at the end of experiment (Fig. 2).
3. Survival rate
The survival rate ranged from 62.6% to 86.4% at the end of the experiment. Significant changes in survival rate were mainly observed from June to August, and after September no marked changes were observed in any experimental treatment group. The highest survival rates (>86%) were observed in the 3-30 and 1-60 groups (P < 0.001), while the lowest survival rate (70%) at the end of the experiment occurred in the 4-90 treatment group (P = 0.004) (Fig. 3).
Discussion
The growth of oysters in the study was strongly
Month
6 7 8 9 10 11 12 1 2 3
Survival rate (%)
50 60 70 80 90 100
1-30 1-60 1-90 2-30 2-60 2-90 3-30 3-60 3-90 4-30 4-60 4-90
2011 2012
Fig. 3. Monthly variations in survival rate (%) of oysters reared at the rearing facility at Yeonghueng, Wando coast, Korea. Data are means and standard deviations.
Sea level (cm)
60 80 100 120 140 160
Maximum shell height (mm)
60 70 80 90 100 110
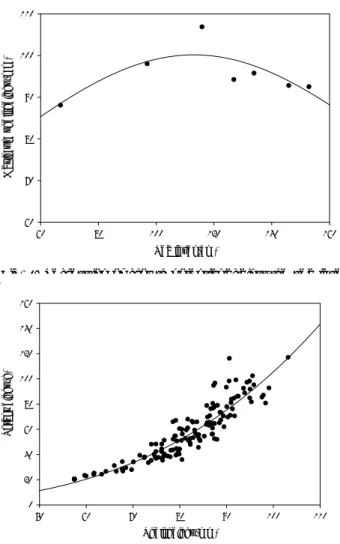
Fig. 4. Regression of growth potential against the sea level of each cultural condition. Maximum growth performance was observed at a sea level of approximately 110 m, with the greatest growth occurring in the 2-60 treatment group.
Shell height (mm)
50 60 70 80 90 100 110
Total weight (g)
0 20 40 60 80 100 120 140 160
Fig. 5. Shell height–total weight relationships for Crassostrea gigas cultured at the rearing facility at Yeonghueng, Wando coast, Korea. TW = 0.0004SH3.2121 (r2 = 0.8593, P < 0.0001). Data is the monthly mean of each measurement.
influenced by the experimental conditions. At the end of the experiment the increase in shell height of oysters in the 1-60 treatment group was greater than in the other treatments (Table 2, P < 0.05). Shell height was markedly influenced by tidal exposure time, oyster rack height, and their interaction (two way-ANOVA; P < 0.001 for tidal exposure time, P = 0.001 for oyster rack height, P < 0.001 for the interaction). With respect to tidal exposure time, the 1 h and 2 h exposure times produced much greater growth than the 3 h and 4 h treatments (P < 0.008), and with respect to oyster rack height the 60 cm treatment produced greater growth than the 90 cm and 30 cm treatments (P = 0.002). To estimate the growth potential the data had to be standardized because of fluctuations in the monthly data as a consequence of sampling errors. To minimize the effect of these errors we estimated the Bertalanffy growth curve to compare growth performances. The growth potential for each experimental treatment group was estimated from the maximum shell height (L∞) (Table 3). The greatest growth potential (L∞; 106.8 mm) was found in the 2-60 treatment group (approximately 116 cm sea level) (Fig. 4). Based on application of the length - weight relationship (Fig. 5) in this equation, the estimated maximum total weight was found to be 131.3 g. Thus, within 14 months the oysters could exceed 100 g in weight, which is the
favored commercial size for half shell oysters. This is a much higher growth rate than previously reported (Lee, 2011).
Meat weight was also highly influenced by tidal exposure time and the oyster rack height (two way-ANOVA; P = 0.019 for tidal exposure time, P <
0.001 for oyster rack height, P < 0.001 for their interaction). Based on the two-way ANOVA the best growth performance in the treatments was in the order 2, 1, 3, and 4 h tidal exposure, with growth in the 4 h treatment being significant less than in the 2 h and 1 h treatments (P < 0.036). With respect to the oyster rack height, significant growth suppression was
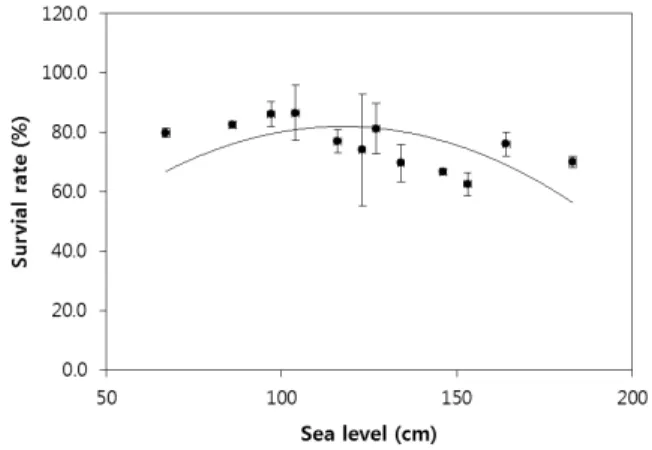
Fig. 6. Regression analysis between survival rate and sea level for oysters reared at Yeonghueng, Wando coast, Korea. Maximum oyster survival rates were estimated to be associated with approximately 116 cm of sea level.
observed only in the 30 cm treatment (P < 0.001).
The patterns were very significant in summer (from June to September), with a significant decrease in meat weight being found in the 30 cm treatment (P
< 0.001), possibly indicating a negative effect of mud (Patrick et al., 2005; Soletchnik et al., 2005) on meat weight increase. The mud effect was much greater with short exposure times, but no differences were observed with the 3 and 4 h exposures (P > 0.161).
Fatness decreased continuously during the experiment (although fluctuations were observed during summer), but significant differences were only observed in July and August. There were no significant differences related to tidal exposure level, but marked trends in the effect of exposure level depended on the rack height (P < 0.001). Although resuspension can have beneficial effects on oyster growth through food supplementation, it is dependent on the nutritional quality of the seston (Bricelj et al., 1984), and inhibition of oyster growth can occur because of decreased ingestion of food, or dilution with high levels of inorganics (Grant et al., 1990). The effect of rack height was significant in the 1 and 3 h exposure treatments, with higher fatness levels found in the 90 cm oyster rack treatment group (two way ANOVA; P = 0.020 for 1-90 against 1-30 in 1 hour level and P = 0.019 and 0.023 for 3-90 against 3-30 and 3-60 in 3 hour level, respectively). This effect of rack height on the fatness was only observed during summer, the spawning season of the oysters. The effect of spawning on the decrease of fatness, however, was negligible because we used triploid oysters in the study. Therefore the significant decrease in the oysters at 30 cm rack might be attributed to negative effects from sediment. No significant differences were observed from September until end of the experimental treatment groups.
Mortality was markedly influenced by tidal exposure and oyster rack height (two way ANOVA, P
< 0.001), and by the interaction of these two variables (two way ANOVA, P < 0.001). The latter result indicates that the effect of different exposure times depended on the rack height. The highest survival rate was observed in the 1-60 treatment
group. Based on regression analysis, the optimal sea level was estimated to be approximately 116 cm (Fig.
6). Substantial variability was found for oysters reared at sea levels > 110 cm.
When reared in the intertidal zone, oysters are exposed to thermal stress during the tidal cycle.
Although the reported sublethal temperature for oysters is much higher than that at the experimental site (Hamdoun et al., 2003), tissue temperatures could rapidly increase in oysters exposed directly to the sun, even for short periods (Potter and Hill, 1982).
Therefore, thermal stress in summer may be a major factor in summer mortality. At the end of the experiment a highly negative correlation was found between survival rates and sea level (coefficient = 0.689, P = 0.0133), which was possibly because of tidal exposure.
Although a higher mean survival rate was observed in the 30 cm treatment group (P < 0.001), the mudflat could become enriched with organic matter from the cultured oysters (Mitchell, 2006), with substantial negative impacts on the benthic community (Tenore et al., 1982; Mallet et al., 2006).
The deployment of oyster racks could obstruct the current flow pattern, leading to increased sedimentation rates and decreased mechanical erosion (Ottman and Sornin, 1985). Organic enrichment of the cultural bed could increase the possibility of
negative effects on cultured animals. In our study, the high elevation of mud bottom was observed at a rack height of 30 cm, and this could contribute to increasing the sedimentation rate of oyster feces (data not shown). The impact of feces should be minimized to reduce potential negative effects on the growth performance of cultured oysters.
Our study suggests that the optimal conditions for off-bottom oyster rack cultivation in the study area are approximately 1 or 2 h of tidal exposure and 60 - 70 cm rack heights. Under these conditions it should be possible to achieve >100 g total weight within 14 months, and >80% survival. There are many variables affecting the growth performance of oysters, including culture density and the size of the oyster seed. These factors should be investigated further to improve oyster production.
Acknowledgment
This research was supported by Fishery Commercialization Technology Development Program, Ministry for Food, Agriculture, Forestry and Fisheries, Republic of Korea.
References
Bricelj, V.M., Malouf, R.E. and Quillfeldt, C. (1984) Growth of juvenile Mercenaria mercenaria and the effect of resuspended bottom sediments. Marine Biology, 84: 167-173.
Grant, J., Enright, C.T. and Griswold, A. (1990) Resuspension and growth of Ostrea edulis: A field experiment. Marine Biology, 104: 51.
Hamdoun, A.M., Cheney, D.P. and Cherr, G.N. (2003) Phenotypic plasticity of HSP70 and HSP70 gene expression in the Pacific oyster (Crassostrea gigas):
Implications for thermal limits and induction of thermal tolerance. The Biological Bulletin, 205:
160-169.
KHOA (2011) Report of Real-teim Korea Oceanographic Observations. Korean Hydrodynamic and Oceanographic Association
Kim, Y.G. (2010) Status of cultural technologies in Western intertidal zone, Korea (Oyster rack culture).
In; Symposium for development of strategies in aquaculture on the western coast of Korea. (ed. by Kaf). pp. 53. Taean.
Lee, C.H. (2011) Comparison of growth rates between diploid oyster and triploid oyster (Crassostrea gigas Thunberg, 1793) using rack culture system on the tidal flat in the West Sea of Korea. Department of Marine Biology, Pusan, Korea.
Lee, K.H. (2006) Current status and enhancement plans of Porphyra cultivation industry in Korea. Major in Marine & Fisheires Resources, Mokpo, KR.
Mallet, A.L., Carver, C.E. and Landry, T. (2006) Impact of suspended and off-bottom Eastern oyster culture on the benthic environment in eastern Canada.
Aquaculture, 255: 362.
Mitchell, I.M. (2006) In situ biodeposition rates of Pacific oysters (Crassostrea gigas) on a marine farm in Southern Tasmania (Australia). Aquaculture, 257:
194.
Ottman, F. and Sornin, J.-M. (1985) Observations on sediment accumulation as a result of mollusk culture systems in France. In; International Symposium on Utilization of Coastal Ecosystems, Planning, Pollution, and Productivity. (ed. by Chao N.L. and Kirby-Smith W.). pp. 329337. Universidade Federal do Rio Grande. Rio Grande.
Patrick, S., Christian, L. and Katherine, C. (2005) Summer mortality of Crassostrea gigas (Thunberg) in relation to environmental rearing conditions.
Journal of Shellfish Research, 24: 197-207.
Potter, M.A. and Hill, B.J. (1982) Heat mortality in the Sydney rock oyster, Saccostrea (Crassostrea) commercialis and the effectiveness of some control methods. Aquaculture, 29: 101.
Soletchnik, P., Lambert, C. and Costil, K. (2005) Summmer mortality of Crassostrea gigas (Thunberg) in relation to environmental rearing conditions.
Journal of Shellfish Research, 24: 197.
Tenore, K.R., Boyer, L.F., Cal, R.M., Corral, J., Garcia-Fernandez, C., Gonzalez, N., Gonzalez- Gurriaran, E., Hanso, R.B., Oglesias, J., Krom, M., Lopez-Jamar, E., McClain, J., Pamatmat, M.M., Perez, A., Rhoads, D.C., Santiago, G.D., Tietjen, J., Westrich, J. and Windom, H.L. (1982) Coastal upwelling in the Rias Bajas, NW Spain: contrasting the benthic regimes of the Rias de Arosa and de Muros. Journal of Marine Research, 40: 701-772.