전신과민성 식품 알레르기 마우스 모델에서의 刀豆 추출물의 항염 효과
양원경1,2#, 박양춘1, 김한영3, 김근회3, 노성수4, 김승형2*
1 : 대전대학교 한의과대학 폐계내과학교실, 2 : 대전대학교 동서생명과학연구원 3 : 애경중앙연구소, 4 : 대구한의대학교 한의과대학
Anti-inflammatory Effects of Canavaliae Semen(
Canavalia gladiate
) Extracts in a Systemic Anaphylaxis Food Allergy Mouse ModelWon-Kyung Yang
1,2#, Yang-Chun Park
1, Han-Young Kim
3, Geun-Hui Kim
3Seong-Soo Noh
4, Seung-Hyung Kim
2*1 : Division of Respiratory System, Dept. of Internal Medicine, College of Korean Medicine, Daejeon University 2 : Institute of Traditional Medicine and Bioscience, Daejeon University, Daejeon 34520, Republic of Korea
3 : Central Research Laboratories of Aekyung industrial Co. Ltd., Daejeon, Republic of Korea 4 : Department of Herbology, College of Korean Medicine, Daegu Haany University, Daegu, Korea
ABSTRACT
Objective : An allergy to peanuts is a major cause of fatal food-induced anaphylaxis, with food allergies becoming an increasingly important health research issue. Food allergy as clinical entity has been recongnized for many years, although there is yet no general concord as to the incidence of this symptom.
1)Methods : This study was undertaken to verify the effect of seeds of
Canavalia gladiata(Jacq.) DC. extract (CGE) on the inhibition of allergic reactions using a cholera toxin and peanut extract-immunized food allergy mouse model. We determine whether the changes in rectal temperature were related to energy consumption owing to heat production in the body. Mast cell distribution and degranulation in the dermis and epidermis were observed with an optical microscope. Subsequently, Ara h1 levels in serum and interleukin (IL)-4, IL-10, and IFN-γlevels in cultured supernatants of splenocytes were measured.
Results : CGE treatment significantly attenuated the secretion of the Ara h1 antibody in serum and splenocytes.
Ara h 1 was undetected in the cholera toxin and peanut extract-immunized food allergy mouse model.
Improvement in ear tissue inflammation symptoms was the CGE experimental group. In the control group and peanut extract control group, the expression of mast cells was higher, whereas that in the CGE experimental group was significantly lower.
Conclusion : CGE causes suppression in a food allergy mouse model via the inhibition of Ara h1 secretion, and might be useful for developing functional health foods.
Key words : anti-allergy, Canavaliae Semen,
Canavalia gladiata, cholera toxin, food allergy, immunogenicity, Systemic Anaphylaxis
*Corresponding author: Seung-Hyung Kim. Institute of Traditional Medicine and Bioscience, Daejeon University, 62 Daehak-ro, Dong-gu, Daejeon 34520, Republic of Korea.
·Tel : +82-42-280-2642 ·Fax : +82-42-274-2600 ·E-mail : [email protected]
#First author : Won-Kyung Yang, Division of Respiratory System, Dept. of Internal Medicine, College of Korean Medicine, Daejeon University and Institute of Traditional Medicine and Bioscience, Daejeon University.
·Tel : +82-42-280-2646 ·Fax : +82-42-274-2600 ·E-mail : [email protected] ·Received : 12 November 2018 ·Revised : 30 November 2018 ·Accepted : 25 January 2019
Introduction
Adverse food reactions are abnormal reactions that occur after the ingestion of food. A food allergy is a hypersensitivity reaction mediated by an immunological mechanism
1). Over the past two decades, the incidences of food allergies have steadily increased, with severity also increasing
2, 3). In a previous meta-analysis study, the prevalence of self-reported symptoms compared to the prevalence of food allergies diagnosed by specific IgE or oral food challenge tests was significantly different. The prevalence rates of milk, egg, peanut, and seafood allergies diagnosed by oral food challenge tests were approximately 3.5%, which were much lower than the self-reported symptoms
4). The most common types of food allergies are to milk and eggs, with allergic reactions to peanuts increasing in recent years. An ISAAC study showed that eggs, milk, fish, shrimp, and crabs were the most common causes of allergic reactions
5, 6). In a food-specific IgE study on patients with atopic dermatitis, which is a high food allergy risk group, allergies to eggs, milk, fish, crustaceans such as shrimp, soybean, peanuts, and wheat flour were common
7). A recent increase in allergic diseases, including food allergies, cannot be fully explained by genetic factors alone, and allergic diseases are multifactorial diseases that occur owing to a combination of genetic and environmental factors. A food allergy is also known as a food hypersensitivity, which is immunologically controlled by food and causes undesirable conditions in humans. Reduced ingestion of omega-3 fatty acids, oxidase, and vitamin D has been reported to increase food allergies
8, 9). The characteristics of food allergens also play an important role in the development of allergies. The most common cause of food allergies is class 1 food allergen-soluble glycoproteins that are found in eggs, milk, nuts, crustaceans, wheat, and soybeans. These glycoproteins are 10 to 70 kD in size and are resistant to heat, acid, and proteolytic enzymes. These allergens are sensitized by ingestion via the gastrointestinal tract and cause systemic symptoms. Class 2 food allergens have a similar structure to pollens and are extracted from plants. These are mostly sensitized via the respiratory tract. They are highly sensitive to acid, heat, and proteases, and their structures are altered by ingestion or cooking, thus reducing antigenicity. Most class 2 allergens can be categorized into several specific protein groups
10, 11). The time and route of exposure of food allergens also affect the occurrence of allergies. In animal experiments, allergen intake via the intestinal tract showed immune tolerance, yet sensitization via
the skin caused anaphylaxis
12). In addition, antigen sensitization has been reported to occur in the skin of patients with atopic dermatitis who have peanut allergies
13)and, in another study, food antigen-specific T cells were found in atopic dermatitis lesions
14). The gastrointestinal tract is protected from external materials by physical mechanisms such as intestinal mucous membrane cells, glycocalyx, gastric acid, intestinal enzymes, and peristalsis, and by immunological mechanisms such as normal bacterial flora, secretory IgA, and the reticuloendothelial system. Approximately 2% of ingested food allergens are absorbed into the blood via the barrier; however, these normally do not cause clinical symptoms in most people owing to oral tolerance to ingested allergens. Oral tolerance is defined as specific immunological nonresponsiveness to previously orally ingested allergens. Oral tolerance is acquired mainly by antigen presenting cells (APC) including intestinal epithelial cells (IEC), dendritic cells, and regulatory T cells. IEC are non-specific APC with no costimulatory signals or receptors, such as cytokines, that are required for T cell activation. IEC presents food allergens to T cells via the class II major histocompatibility complex, resulting in T cell anergy or T cell deletion and formation of oral tolerance.
Dendritic cells are present in the Peyer’s patch and induce tolerance by secreting interleukin (IL)-10 and IL-4. Regulatory T cells include T helper 3 cells, T helper 1 cells, and CD4(+)CD25(+) T cells. These regulate T cells and B cells via the transformation of growth factors (e.g., TGF-
) and IL-10 to induce oral tolerance
15). Recently, the effects of natural extracts on disease control have been actively studied; therefore, the effects of natural extracts such as traditional herbs have been attracting increasing attention.
Canavalia gladiata(Jacq.) DC. belongs to the order Rosales and family Leguminosae, and is an annual vine plant, commonly known as the Jack bean or Sword bean. The origin of Canavaliae Semen (
C. gladiate) is a tropical area in East Asia and it is cultivated in Korea;
however, there have been no accurate statistics on the production and consumption of Canavaliae Semen (
C.gladiate
)
16, 17, 18). In oriental medicine, Canavaliae Semen
(
C. gladiate) fruit has been used as a medicinal herb
for the treatment of hiccups, vomiting, abdominal
pain, kidney disease, and asthma. In folk remedies, it
has been used to treat empyema, hemorrhoids, and
purulent inflammation such as furuncle
19, 20). In addition,
Canavaliae Semen (
C. gladiate) has been reported to
have anticancer, antioxidant, and anti-diabetic effects,
and to be effective against chronic nephritis
21, 22, 23, 24).
Recent studies have shown that Canavaliae Semen (
C.Fig. 1. Experimental plan of repeated cholera toxin inducement gladiate
) enhances anti-inflammatory effects by improving the balance between CD4+ T and CD8+ T cells in atopic dermatitis
25, 26). Although many studies have revealed the efficacy of seeds of C.
gladiata, there has been no study to date on its effect on food allergies.
Therefore, the objective of the present study was to evaluate the effect of the seeds of C.
gladiataextract (CGE) on food allergens.
Materials and methods
1. Experimental materials
The seeds of
C. gladiataused in the present study was purchased from Soybean World Co., Ltd. (Jecheon in Chungcheongbuk-do, Korea) and validated by Professor Young-Chul Lee from the Department of Herbology at Sangji University. CGE was stored in a cryo-freezer (-84℃) (standard sample: CGS-70 EtOH and AL-70 EtOH) at the Institute of Traditional Medicine and Bioscience at Daejeon University and diluted to a certain concentration for use. Ethanol was purchased from Samchun Chemicals Ltd. (Pyeongtek, Korea); dimethyl sulfoxide was purchased from Sigma- Aldrich (St. Louis, MO, USA); and Dulbecco’s modified Eagle’s medium, fetal bovine serum (FBS), penicillin- streptomycin B (antibiotics), phosphate buffered saline
(PBS), and 0.25% trypsin-EDTA were purchased from Gibco (Carlsbad, CA, USA). The antibodies for fluorescence-activated cell sorting (FACS) analysis (R-Phycoerythrin (PE) anti-mouse fluorescein (FITC) anti-mouse CD4 (RM4-5, rat IgG2a), PE anti-mouse CD8 (53-6.7, rat IgG2a), PE anti-mouse CD69 (H1.2F3, rat IgG2a), FITC anti-mouse CD11b+F4/80+(aM, rat IgG2b), PE-cy5.5 anti-mouse B220 (RA3-6B2, rat IgG2b), and FITC anti-mouse NK1.1 (PK136, rat IgG2b)) were purchased from Biosciences (Franklin Lakes, USA). Mouse interferon gamma, IL-4 and IL-10 (R&D system, USA), and Ara h1-specific IgE enzyme-linked immunosorbent assay (ELISA) (INDOOR biotechnology, Virginia, USA) were also used.
2. Animal experiment subjects
This study was approved by the Institutional Animal Care and Use Committee at Daejeon University (Approval No.: DJUARB2017-038) and was performed according to the regulations.
3. Cholera toxin induction and administration of study materials
Four-week-old female C57bl/6n mice were supplied from Orient Bio Co., Ltd. and acclimated to an experimental animal room for 1 week. The temperature of the room was adjusted to 20 ± 2℃ and the relative humidity was adjusted to 50 ± 5%. Harlan feed (2018S, Harlan, USA) and drinking water were kept in the cage and were available for ad libitum feeding. The light: dark cycle was 12 h:12 h. Cholera toxin was administered orally to the C57bl/6n mice (n = 4/group) on day 0 and day 7 at a concentration of 10 µg/mouse to induce sensitization. CGE (5 mg/kg) was orally administered on day 0 day and day 7, and CGE (10 mg/kg) was orally administered twice in a 30-min interval on day 21. On day 35, CGE (10 mg/kg) was orally administered and administered intraperitoneally at a concentration of 1 mg/mouse (Fig. 1). The mice were sacrificed after the last injection to measure the results from the experiment.
4. Changes in rectal temperature in the cholera toxin-induced mouse model
To determine whether the changes in rectal temperature
were related to energy consumption owing to heat
production in the body, the white mice were transferred
from the rearing room to the laboratory. Then, the
body temperature was measured after 30 min of
acclimation to the environment. A YTI –402 thermistor
probe was inserted into the rectum of the experimental
animals, held in place when approximately 8 cm was
inserted, and remained in place for 20 s. Numerical
values appeared on the digital YTI –43TG Telethermometer
(Yellow Springs Instruments, Yellow Springs: OH), with
rectal temperatures measured after 30 min, 60 min,
and 90 min. Differences between the cholera toxin-induced
group, cholera toxin complex peanut extract administration group, and CGE administration group were confirmed.
5. Flow cytometry
After sacrificing the C57bl/6 mice, peripheral blood mononuclear cells (PBMC), separated splenocyte cells, and mesenteric lymph node (MLN) cells were centrifuged, and the pellets were used for analysis. Each separated cell was washed twice with FACS buffer and immuno- fluorescence staining was performed at 4℃. Each tissue was cultured for 30 min with anti-CD69- PE, anti-CD11b-FITC, anti-CD4-FITC, anti-CD8-FITC, anti-CD11b+F4/80+-FITC, and anti-B220-PE. After the reaction, the cells were washed three or more times with PBS and measured with a FACS Calibur
Ⓡ(BD Bioscience, San Jose, CA). The CD4+/CD8+, CD4+
/CD25+, Gr-1+/CD11b+, and B220+/CD23+ cells were counted as a percentage (%) using the Cell Quest software program, and the wavelengths expressed in each cell were represented as dot plots.
6. Ara h1-specific IgE production inhibition assay
Total Ara h1-specific IgE concentration in the serum was measured using an ELISA. After completion of the experiment, the blood collected from the C57bl/6 mice was centrifuged, and the IgE concentration in the serum was measured using an Ara h1-specific IgE ELISA kit. Ara 1h-specific IgE standard solution and samples were reacted in an antibody-coated well at room temperature for 2 h, and the cells were reacted with biotin-conjugated anti-IgE antibody solution for 2 h. The samples were then reacted with HRP-avidin solution for 1 h and with chromogenic substrate reagent for 20 min. A reaction stopper was added to stop the reaction and the absorbance was measured at 450 nm using ELISA (Molecular devices EMax).
7. Isolation and culture of mouse splenocytes
After completion of the experiment, the spleens of the C57bl/6 mice were aseptically removed, and the splenocytes were suspended. Then, cell debris was removed using mesh stainless steel sieve (Sigma Chemical Co., St. Louis, MO, U.S.A.). The cell suspension was centrifuged at 4℃ and 1,500 RPM for 10 min. Then, the obtained cell pellets were centrifugally washed, placed in RPMI1640 medium containing 5% FBS, aliquoted to a 96-well plate coated with anti-CD3 antibodies, and cultured for 48 h. The cytokines present
were measured in the separated culture supernatant as outlined below.
8. Measurement of cytokine production in cultured mouse splenocytes
Cytokines (IFN-
, IL-4, and IL-10) were measured in the culture supernatant of mouse splenocytes. The culture supernatant was collected from each cell culture well and centrifuged at 1,000 rpm for 10 min.
Then, IFN-
, IL-4, and IL-10 content were measured by ELISA. Biotinylated antibody reagent was added to each well in a 96-well plate and the supernatant was added. Then, the cells were cultured at room temperature.
Streptavidin-HRP solution was added to each well, and the cells were cultured at room temperature for 30 min. A 100 µL sample of TMB substrate solution was added to each well and the reaction was stopped after culturing in a dark room for 30 min. The absorbance was measured at 450 nm with an ELISA reader within 30 min of the reaction stopping. The concentration was calculated and analyzed for each well using a standard curve prepared using standard IFN-
, IL-4, and IL-10.
9. Pathological observation of skin tissues
The ear tissue samples taken during the autopsy were fixed for 24 h. The tissues were rinsed with water, dehydrated, permeated, and infiltrated, and then paraffin embedding was performed. The tissues were cut into 4 µm sections and stained with toluidine blue. Then, mast cell distribution and degranulation in the dermis and epidermis were observed with an optical microscope.
10. Statistical analysis
All measurements were expressed as the mean and standard error of the mean of representative values derived from independent experiments. Data were analyzed using the Statistical Package for the Social Sciences (SPSS; version 14.0, SPSS Inc, Chicago, IL, USA) and the significance of each group was p<0.05, which was determined by Duncan’s multiple range test and t-test.
Results
1. Rectal temperature changes in cholera
toxin-induced animal model
B
D
Fig. 3. Cholera toxin-induced peanut extract and Canavalia gladiata extract inhibiting IL-4, IL-10, and IFN- expression in splenocytes of cholera toxin-induced mouse model. The production of Ara h1-specific IgE in serum (A), IFN- (B), IL-10 (C), and IL-4 (D) in splenocytes were measured by ELISA. Data are shown as mean ± SEM. #p<0.05,
##p<0.005 vs Nor; *p<0.05, **p<0.01 and ***p<0.001 vs CTL.
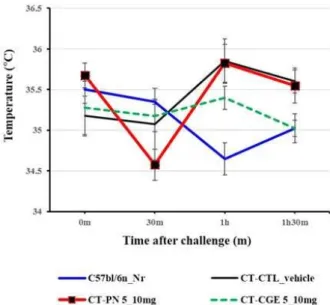
There were no significant differences in rectal temperature among any of the experimental groups;
however, the rectal temperature decreased after 30 min in the group sensitized with cholera toxin and administered peanut extract (Fig. 2).
Fig. 2. Changes in rectal temperature (℃) in cholera toxin- induced mouse model. C57bl/6n_Nr: normal; CT_CTL: cholera toxin-induced control; CT-PN 5_10 mg: cholera toxin-induced peanut extract; CT-CGE 5_10 mg: cholera toxin-induced Canavalia gladiata extract. Data are expressed as mean ± SEM.
2. Determination of serum Ara h1 specific IgE secretion and IgE and cytokine secretion in splenocytes
In the cholera toxin-induced mouse model, Ara h1 specific IgE and inflammatory cytokines based on different CGE treatments were investigated. There are eight peanut protein antigens (Ara h1 to Ara h8), of which the major antigens are Ara h1, Ara h2, and Ara h3. The serum was separated to measure Ara h1- specific IgE, and production of inflammatory mediators (IFN-
, IL-10, and IL-4) in the splenocytes was measured by ELISA. IFN-
, IL-10, and IL-4 production in the splenocytes of the cholera toxin-induced control group was found to be higher than that of the normal group (Fig. 3). However, a significant increase was observed in the group administered the peanut extract, and the production of IL-10 and IL-4 showed a statistically significant increase. IFN-
, IL-10, and IL-4 production decreased in the CGE experimental group. IFN-
production decreased, whereas the production of IL-4 increased owing to a chronic disease reaction caused by an allergic mechanism. IgE production was increased by the imbalance of Th1/Th2 cells, which were shown by IFN-
and IL-4. In addition, increased IgE is known to be a major problem in allergies.
C
A
Fig. 5. Histopathology of ear tissue (toluidine blue staining) in mast cells of cholera toxin-induced systemic anaphylaxis.
C57bl/6n_Nr: normal; CT_CTL: cholera toxin-induced control; CT-PN 5_10mg: cholera toxin-induced peanut extract;
CT-CGE 5_10mg: cholera toxin–induced Canavalia gladiata extract.
Fig. 4. Total PBMC, splenocytes, and MLN cells in each treatment group of the Canavalia gladiata extract of the cholera toxin-induced mouse model. Total PBMC (A), splenocytes (B), and MLN (C) cells were counted using flow cytometry. Data are shown as mean ± SEM. ##p<0.005 vs Nor; *p<0.05 vs CTL
A
C
E
B
D
F
Fig. 6. Effects of CGE treatment on the changes in total absolute numbers of T cells in the PBMC of C57bl/6 mice in the cholera toxin-induced mouse model. The total absolute numbers of CD4+CD8+ (A), (B) and CD4+CD25+ (C), (D) and B220+CD23+ (E), (F) cells in the C57bl/6n mice. C57bl/6n_Nr: normal; CT_CTL: cholera toxin-induced control; CT-PN 5_10mg: cholera toxin-induced peanut extract; CT-CGE 5_10mg: cholera toxin-induced Canavalia gladiata extract. #p< 0.05 vs Nor; *p<0.05, **p<0.01 and ***p<0.001 vs CTL.
3. Total PBMC, splenocytes, and MLN cells Number of the
CGEof the cholera toxin- induced mouse model
Total PBMC, splenocytes, and MLN cells were counted using flow cytometry in the cholera toxin-induced mouse model and the total number of MLN and
A B C
A
B
C
B
D
F
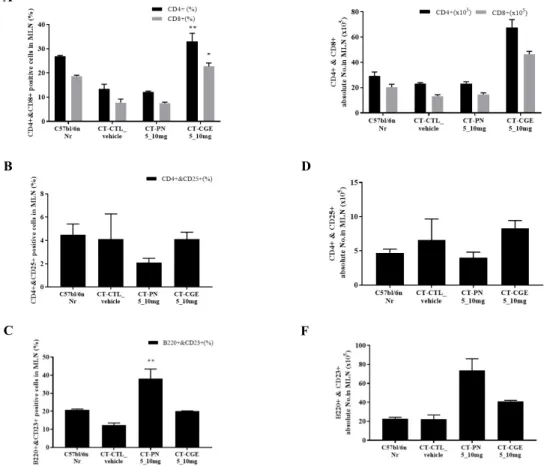
Fig. 7. Effects of CGE treatment on the changes in total absolute numbers of T cells in the MLN of C57bl/6 mice in the cholera toxin-induced mouse model. Total absolute numbers of CD4+CD8+ (A), (B) and CD4+CD25+ (C), (D) and B220+CD23+ (E), (F) cells in the C57bl/6n mice. C57bl/6n_Nr: normal;
CT_CTL: cholera toxin-induced control; CT-PN 5_10mg: cholera toxin-induced peanut extract;
CT-CGE 5_10mg: cholera toxin-induced Canavalia gladiata extract. *p<0.05 and **p<0.01 vs CTL.
splenocytes were higher in the cholera toxin-induced mouse group than in the other groups. However, the total number of MLN cells and splenocytes decreased based on the concentration of CGE orally administered to the mice (Fig. 4).
4. Inflammation symptom improvement by CGE administration in the cholera toxin- induced mouse model
Improvement in ear tissue inflammation symptoms were observed in the cholera toxin-induced group and the CGE experimental group. In the control group and peanut extract control group, the expression of mast cells was higher, whereas that in the CGE experimental group was significantly lower (Fig. 5).
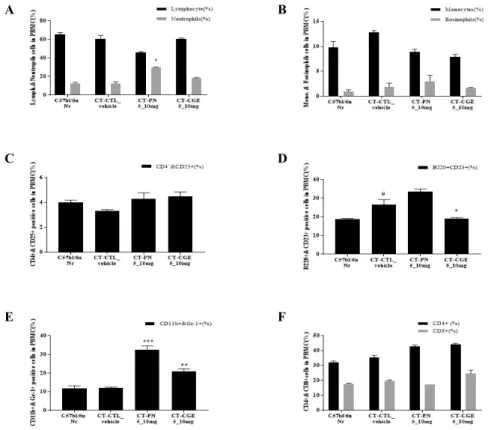
5. Absolute total number of PBMC in cholera toxin-induced mouse model
In the cholera toxin-induced mouse model, PBMC were analyzed with flow cytometry and represented as lymph and neutrophil percentages (%), and the absolute
total number of cells in each tissue was calculated by applying the total number of cells. Neutrophils were three times higher in the PBMCs of the cholera toxin-induced control group administered peanut extract, whereas they were lower in the CGE experimental group, a level similar to that of the normal group (Fig. 6).
6. Absolute total number of MLN cells in the cholera toxin-induced mouse model
MLN cells in mice were analyzed as a percentage (%) by flow cytometry analysis, and the absolute total number of cells in each cell was calculated by applying the total number of cells. Eosinophils were higher in MLN cells from the cholera toxin-induced control group administered the peanut extract, whereas they were lower in the CGE experimental group. B220+
CD23+ cells showed the same pattern.
7. Absolute total number of splenocytes in the cholera toxin-induced mouse model
Splenocytes in the mice were analyzed as a percentage
A
B
C
D
Fig.8. Effects of CGE treatment on the changes in total absolute numbers of T cells in the spleen of C57bl/6 mice in the cholera toxin-induced model. Total absolute numbers of B220+CD23+ (A), (B) and CD11b+Gr-1+ (C), (D) cells in the C57bl/6n mice. C57bl/6n_Nr: normal; CT_CTL: cholera toxin- induced control; CT-PN 5_10mg: cholera toxin-induced Peanut extract; CT-CGE 5_10mg: cholera toxin-induced Canavalia gladiata extract. **p<0.01 vs CTL.
(%) by flow cytometry analysis, and the absolute total number of the cells in each cell was calculated by applying the total number of cells. CD11b+/Gr-1+ cells were higher among splenocyte cells in the cholera toxin- induced control group administered the peanut extract, whereas they were lower in the CGE experimental group.
Discussion
C. gladiata