Effects of Storage Duration on Physicochemical and Antioxidant Properties of Tomato
( Lycopersicon esculentum Mill.)
Shimeles Tilahun, Do Su Park, Adanech Melaku Taye, and Cheon Soon Jeong
*Department of Horticulture, Kangwon National University, Chuncheon 24341, Korea
*Corresponding author: [email protected]
Abstract
This study explored the physicochemical and nutritional changes associated with storage duration of fresh tomatoes. Fruits of the ‘TY Megaton’ and ‘Yureka’ tomato cultivars were harvested at the pink stage and stored at 12ºC for 20 days. During storage, firmness, weight loss, skin color (Hunter L, a, b, a / b values), soluble solids content (SSC), titratable acidity (TA), pH, antioxidant contents (lycopene, ascorbic acid, and total phenolics) and antioxidant activity were evaluated. Firmness was above the minimum marketable limit and fresh weight loss was below maximum acceptable weight loss after 3 weeks of storage, and no deleterious effect on antioxidant contents or activities were observed. Significant differences in SSC, TA, and pH were seen between varieties, but not between fruits stored for different durations.
In both varieties, Hunter a values increased more than five-fold after 8 days of storage; this correlated with a more than four-fold accumulation of lycopene after two weeks of storage.
The antioxidant activity of tomatoes was highest at the beginning of the storage period, likely because of the effective DPPH - reducing power of ascorbic acid and total phenolics.
Antioxidant activity increased after 12 days of storage because of increasing lycopene content.
Hence, this study indicates that pink - stage tomatoes may be stored at 12ºC for up to 3 weeks without affecting marketability or nutritional value.
Additional key words: antioxidant activity, ascorbic acid, lycopene, phenolics, storage period.
Introduction
Tomato (Lycopersicon esculentum Mill.) is a major horticultural crop with a worldwide production of 163.43 million tons and a value of US$59.88 billion. In South Korea, 388.5 thousand tons of tomatoes with a value of US$143.58 million were produced in 2013 (FAOSTAT, 2013). As one of the most widely consumed horticultural crops in the world, tomatoes make a significant contribution to human nutrition because they contain sugars, acids, vitamins, minerals, lycopene and other carotenoids, among other constituents (Simonne et al., 2006; Toor and Savage, 2006). Tomatoes are a rich source of antioxidants such as vitamin C, lycopene, phenolics, flavonoids and β - carotene, which contribute to
Received: August 18, 2016 Revised: September 5, 2016 Accepted: September 13, 2016 Copyrightⓒ 2017 Korean Society for Horticultural Science.
This is an Open-Access article distributed under the terms of the Creative Commons Attribution NonCommercial License which permits unrestricted non- commercial use, distribution, and reproduction in any medium, provided the original work is properly cited.
This work was supported by the Korea Institute of Planning and Evaluation for Technology in Food, Agriculture, Forestry and Fisheries (IPET), through the Agri-Bioindustry Technology Development Program, funded by the Ministry of Agriculture, Hortic. Sci. Technol. 35(1):88-97, 2017
https://doi.org/10.12972/kjhst.20170010
pISSN : 1226-8763 eISSN : 2465-8588
OPEN ACCESS
and tomato - based products is associated with a reduced risk of cancer and cardiovascular diseases (Giovannucci et al., 2002). This protective effect is mainly attributed to valuable bioactive components with antioxidant properties (Borguini and Torres, 2009).
Tomatoes are climacteric fruits with a relatively short postharvest life in ambient conditions. As in other climacteric fruit, tomato ripening is highly dependent on ethylene action (Alexander and Grierson, 2002), which makes this fruit highly perishable. Inhibition of ethylene production delays fruit ripening and increases the shelf life for the consumer (Madhavi and Salunkhe, 1998). Variety, environmental effects, cultivation conditions, ripening stage, and postharvest storage all affect tomato composition (Anza et al., 2006). Temperature is the most important environmental factor to consider in the postharvest life of tomatoes because of its effects on the rates of biological processes (Mostofi and Toivonen, 2006). Low temperature is important for maintaining quality and extending the shelf life of fruits and vegetables after harvest. Postharvest recommendations indicate that tomatoes should be stored at 10ºC or higher to avoid chilling injury (Roberts et al., 2002), and even 10ºC may be detrimental to tomato flavor quality (Maul et al., 2000). A storage temperature of 10 - 13ºC is recommended for pink - red to firm - red greenhouse - grown tomatoes (Alban, 1961).
Several studies have explored tomato storage and shelf life under various conditions, as well as the effects of different drying processes (Chang et al., 2006), and cooking processes such as boiling, baking, or frying (Sahlin et al., 2004) on the antioxidant properties of different varieties (George et al., 2004) and tomato fractions (Toor and Savage, 2005). However, information on the physicochemical changes and overall nutritional implications of storage duration on fresh tomato is not clear. The time between fruit harvesting and consumption might be up to several weeks, and during this period biochemical changes may affect tomatoes’ nutritional value, Thus, an experiment was designed to study the variations in physicochemistry and antioxidant properties of fresh tomatoes during storage.
Materials and Methods
Chemicals
All chemicals used were of analytical grade. Folin–Ciocalteu’s phenol reagent, 2,2 - diphenyl - 1 - picrylhydrazyl (DPPH), gallic acid and ascorbic acid were purchased from Sigma - Aldrich, Korea. Metaphosphoric acid and potassium dihydrogen phosphate were obtained from Yakuri Pure Chemicals, Kyoto, Japan. Sodium hydroxide, sodium carbonate, butylated hydroxylanisole, methanol, ethanol, hexane and acetone were obtained from DaeJung Chemicals, Korea.
Tomato Samples and Storage Conditions
Tomatoes (Lycopersicon esculentum Mill) cv. ‘TY Megaton’ and ‘Yureka’ were grown in a greenhouse in the Kangwon province of South Korea during Spring 2016. A USDA biological color chart (1991) was used to precisely select fruits of consistent maturity level and fruit color. Uniform - size fruits free from physical defects were harvested at the pink stage.
Tomato fruits were washed and wiped dry and placed in a commercial plastic tomato box before being stored at 12ºC for
up to 20 days. Fruits were regularly inspected and data were collected at 4 - day intervals for the parameters considered (see
below).
Physicochemical Changes Fresh Weight Loss and Firmness
Tomatoes were weighed prior to storage, and weighed again at the end of the storage period. The post - storage weight was subtracted from the pre - storage weight, and fresh weight loss was presented as a percentage (%) of weight lost compared to the initial weight.
Tomato fruit firmness was measured using a Sun Rheo Meter Compac - 100II (Sun Scientific Co. Ltd., USA) with a maximum force of 10 kg and a 3 mm diameter round stainless steel probe with a flat end. Measurements were taken at the equator of the fruit
Color Changes
Hunter a (redness), b (yellowness), and L (brightness) values (McGuire, 1992) were determined using a CR - 400 chroma meter (Minolta, Japan). Color variables were measured three times from the sides of three tomatoes (near to the equatorial section), and the average determined.
Soluble Solids Content (SSC), Titratable Acidity (TA), and pH
Soluble solids content (SSC) was determined for each of five sample fruits using an Atago DR - A1 digital refractometer (Atago Co. Ld., Japan) at 20ºC, and expressed as ºBrix.
Titratable acidity (TA) was obtained by titrating diluted tomato juice (1 ml juice: 19 ml distilled water) with 0.1 N NaOH up to pH 8.1 using a DL22 Food and Beverage Analyzer (Mettler Toledo Korea Ltd.). The result was expressed as mg of citric acid per 100 g of fresh tomato weight. A Mettler Toldo InLab 413 pH meter was used to measure pH.
Antioxidant Properties Lycopene Content
Lycopene content of triplicate tomato samples was determined according to the method of Fish et al. (2002), with some modifications. Homogenized tomato samples (0.5 g of each) were placed into vials, to which was added 5 mL of 0.05%
(w/v) butylated hydroxyl toluene (BHT) in acetone, 5 mL of 95% (v / v) ethanol, and 10.0 mL of hexane. Vials were then centrifuged (15 000 rpm for 15 min). Afterwards, 3 mL of deionized water was added to each vial, and the samples were shaken for another 5 min. Vials were left at room temperature for 5 min without agitation to allow phase separation. The absorbance of the hexane (upper) layer was measured with a spectrophotometer (Thermofisher Scientific, USA) at 503 nm versus a blank of hexane solvent. Lycopene content of samples was expressed as mg·kg
-1of fresh weight.
Ascorbic Acid
Vitamin C was analyzed using reversed - phase liquid chromatography with UV detection, according to the method
described by Kim et al. (2011). Briefly, 1 g of sample was mixed with 10 mL of 5% metaphosphoric acid and homogenized
for 1 min. After centrifuging the mixture (20 000 rpm for 10 min), the liquid layer of extracts was membrane - filtered (0.22
µm) and analyzed using a ZORBAX Eclipse XDB - C18 (4.6 × 250 mm, 5 µm, Agilent, USA) column and detector (UV -
Total Phenolics
Total phenolics content was quantified using a slightly modified version of the method described by Pataro et al. (2015).
Briefly, 2 g of each tomato sample (in duplicate) was extracted with 20 mL of 0.05% (v / v) aqueous HCl / methanol (10:90, v / v) using a homogenizer (Ultra Turrax T18 Basic, IKA, Germany) at speed 5 for 1 min, and the homogenate was membrane - filtered (0.45 µm). The sample extract (0.2 mL) was mixed with 2.6 mL of deionized water, 2 mL of 7% (w / v) Na
2CO
3, and 0.2 mL of Folin - Ciocalteu’s phenol reagent. After incubating at room temperature for 90 min, a spectrophotometer (Thermofisher Scientific, USA) was used to measure the absorbance of the reaction mixture at 750 nm against a blank sample containing the same mixture solution without the sample extract. Total phenolics content was expressed as mg of gallic acid equivalents (GAE) per kg fresh weight of sample.
Antioxidant Activity
Using duplicates of the same extracts used to quantify total phenolic content analyses, antioxidant activity was measured by spectrophotometric assay (Thermofisher Scientific, USA) and the DPPH method reported by Pataro et al. (2015), with some modifications. First, cuvettes (Kartell, Italy) containing 3.9 mL of DPPH dissolved in methanol (0.1 mM) were prepared, and the absorbance at 515 nm was read immediately (t
0= 0 min). Methanol was used to determine the absorbance of auto zero and the blank. Subsequently, 800 μL of each tomato extract was mixed with 3.2 mL of methanol–DPPH solution and kept in the dark for 30 min (t
30) at room temperature before measuring their absorbance. The percentage of DPPH inhibition was calculated as follows:
% reduced DPPH = [(absorbance t
o− absorbance t
30) ÷ absorbance t
o] × 100
Statistical Analysis
A completely randomized study design was used, with nine replicates for color, five for weight loss, firmness, SSC, TA and pH, and three for all other parameters. Parameter measurements were analyzed by analysis of variance (ANOVA) at p
< 0.05 using SAS (SAS / STAT
®9.1, SAS Institute Inc., Cary, NC, USA) statistical software. Differences between mean values were analyzed by one - way ANOVA to determine whether storage duration and variety caused significant differences in the physicochemical and antioxidant properties of tomatoes. Duncan’s multiple range test was used to determine which particular means were significantly different (p < 0.05).
Results and Discussion
Physicochemical Changes Weight Loss and Firmness
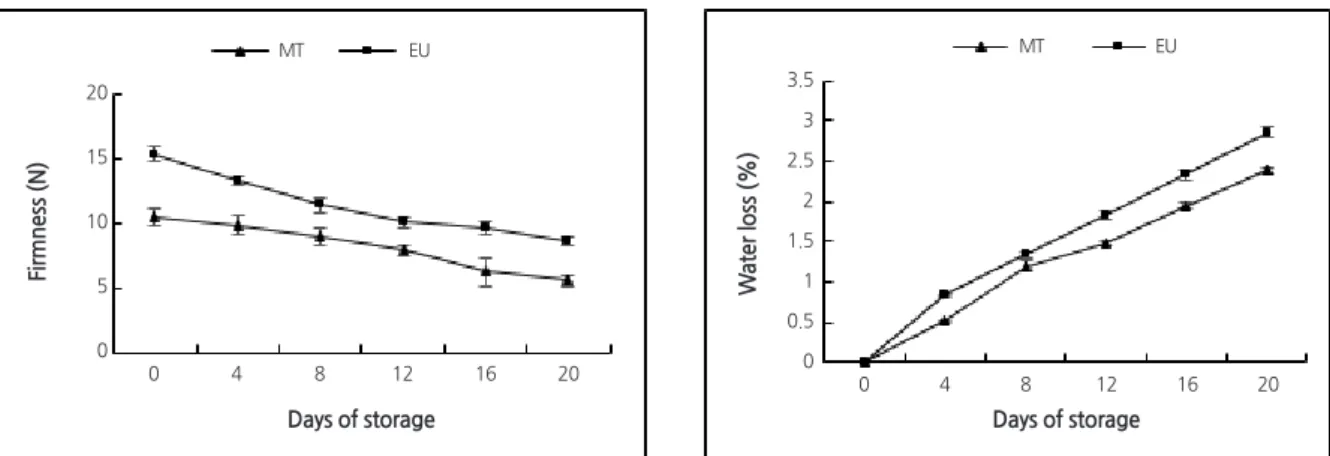
In both tomato varieties, percentage weight loss increased significantly (p < 0.05) with increasing storage period (Fig. 1).
After 20 days of storage the weight loss was 2.86% and 2.38% for ‘Yureka’ and ‘TY Megaton’, respectively. According to
Nunes (2008), the maximum acceptable weight loss before a tomato becomes unsellable is 6 - 7% (Nunes, 2008); in this
study, weight loss for both cultivars was within the acceptable weight loss range. This may be because the tomatoes used in
this study were stored at the recommended temperature of 12ºC (Alban, 1961), and relative humidity was managed at 85 ± 5%. In the present study, significantly different weight loss was observed between the two cultivars, suggested that these cultivars vary in amount of water loss.
In both varieties, firmness reduced significantly (p < 0.05) with increasing storage duration (Fig. 1), but in both cases remained above the minimum limits of marketable firmness suggested by Batu (2004), at 1.45 N for retail, and 1.28 N for home consumption. In this study, firmness after 20 days of storage was 5.8 N and 8.7 N for ‘TY Megaton’ and ‘Yureka’, respectively.
SSC, TA, and pH
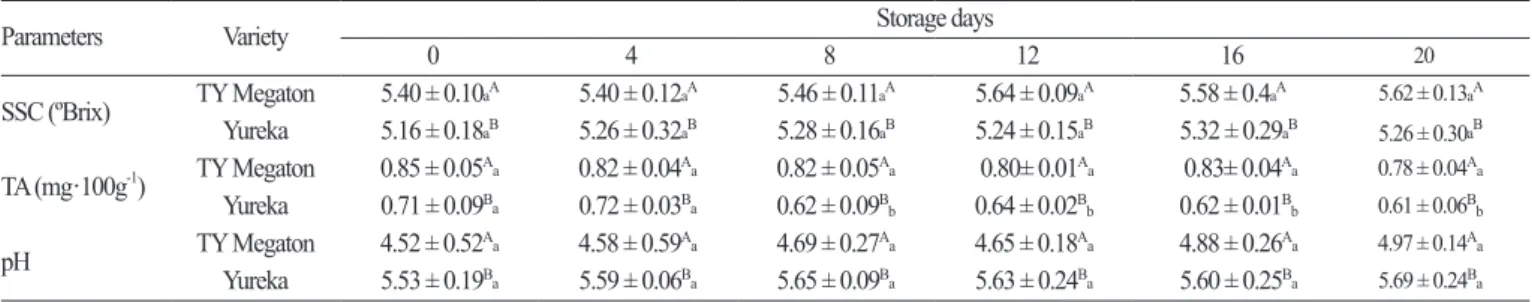
Analysis of variance (ANOVA) revealed significant differences (p < 0.05) between tomato cultivars in terms of their biochemical characteristics. The maximum SSC (5.64 ºBrix) for ‘TY Megaton’ was recorded on day 12, and for ‘Yureka’
(5.32 ºBrix) was recorded on day 16, but there was no significant difference (p > 0.05) between the number of storage days (Table 1). Previous studies likewise reported no significant differences between tomato cultivars stored at room temperature for 14 days (Wills and Ku, 2002).
Fig. 1. Changes in firmness and water loss of ‘TY Megaton’ (MT) and ‘Yureka’ (EU) tomato cultivars, as affected by storage duration at 12℃. Vertical bars represent standard error of the means (n = 5).
Firmness (N) W ater loss (%)
5
0 10 15 20
0 4 8 12 16 20 0 4 8 12 16 20
Days of storage Days of storage
MT EU MT EU
2
0 2.5 3 3.5
1 0.5 1.5
Table 1. Changes in color of ‘TY Megaton’ and ‘Yureka’ tomato cultivars, as affected by storage duration at 12 ℃ .
Parameters Variety Storage days
0 4 8 12 16 20
L* TY Megaton 50.52 ± 0.62
aA46.75 ± 1.18
bA44.49 ± 1.54
cA44.80 ± 1.70
cA43.79 ± 1.80
dA43.67 ± 1.23
dAYureka 50.63 ± 0.98
aA45.64 ± 0.49
bB45.66 ± 1.54
bB45.42 ± 0.56
bB45.33 ± 0.73
bB44.80 ± 0.48
cBa* TY Megaton 2.06 ± 0.89
aA7.97 ± 0.72
bA11.40 ± 1.21
cA14.62 ± 1.48
dA15.24 ± 2.87
eA13.62 ± 1.25
fAYureka 1.26 ± 1.05
aA9.43 ± 3.16
bB12.53 ± 1.53
cB13.28 ± 1.50
dB12.65 ± 0.73
cB9.89 ± 1.17
bBb* TY Megaton 16.22 ± 1.27
aA14.08 ± 0.59
bA13.11 ± 0.50
cA13.12 ± 0.95
cA12.94 ± 0.61
cA12.37 ± 0.43
dAYureka 19.77 ± 1.74
aB16.99 ± 0.45
bB16.94 ± 0.69
bB16.15 ± 0.75
cB16.02 ± 0.77
cB13.75 ± 1.24
dBa* / b* TY Megaton 0.13± 0.06
aA0.57 ± 0.06
bA0.87 ± 0.09
cA1.12± 0.13
dA1.18 ± 0.22
dA1.10 ± 0.10
deAYureka 0.06 ± 0.05
aB0.55 ± 0.18
bA0.74 ± 0.07
cB0.82 ± 0.09
dB0.79 ± 0.04
dB0.72 ± 0.04
deBValues with different upper case letters within the same column, and means with different lower case letters within the same row are significantly different ( p < 0.05).
Titratable acidity (TA) gradually decreased with increasing storage duration; a minimum acidity of 0.61 mg·100g
-1was recorded in ‘Yureka’ after 20 days of storage, while for ‘TY Megaton’, maximum acidity (0.85 mg·100g
-1) was at day 0 (Table 1). Reduction in acidity during storage might be associated with the conversion of organic acids into sugars and their derivatives, or their utilization in respiration (Rai et al., 2012).
The pH varied from 4.52 to 4.97 in ‘TY Megaton’ and from 5.53 to 5.69 in ‘Yureka’ (Table 1). The pH of both cultivars increased with increasing storage duration. The maximum pH content of tomato fruit juice was recorded after 20 days of storage in both cultivars. Rai et al. (2012) studied four cultivars of tomato and found variations in pH from 3.43 to 4.63.
Color Changes
Skin and flesh color is one of the most important quality factors affecting tomato appearance (Brandt et al., 2006). Color is measured using a chroma meter and evaluated against the Hunter a, b, L scale, where more negative a represents increasing greenness and more positive a represents increasing redness; more negative b indicates increasing blueness and more positive b indicates increasing yellowness; and L (on a scale of 0 - 100) indicates darkness to brightness. In tomato, color development is characterized by lower L values readings, and a change from negative to positive a values (Shewfelt et al., 1988). Increasing redness is desirable in most tomato cultivars, hence Hunter a values are best for evaluating the maturation process based on color.
In the present study, Hunter a values of both cultivars were significantly different ( p < 0.05) throughout the storage period.
The highest values (+ 15.4) and (+ 13.8) were recorded on day 16 for ‘TY Megaton’ and on day 12 for ‘Yureka’, respectively (Table 2). The a / b ratios were significantly different and follow the same trend as Hunter a values for both cultivars (Table 2). The highest ratios - 1.18 and 0.82 - were obtained on day 16 for ‘TY Megaton’ and on day 12 for ‘Yureka’, respectively.
In the present study, increasing a value was shown to be directly associated with lycopene synthesis, and hence increasing lycopene content. The a / b ratio is a good indicator of lycopene content and, therefore, can be used to characterize fresh tomato ripeness stage (Arias et al., 2000; Helyes et al., 2006).
Hunter L values reduced slightly during storage, irrespective of cultivar (Table 2).
Antioxidant Properties Lycopene
The lycopene content of both cultivars increased significantly ( p < 0.05) after harvest and throughout the storage period.
The initial lycopene content of ‘TY Megaton’ and ‘Yureka’ was 5.43 and 4.00 mg·kg
-1, respectively. The lycopene content of ‘Yureka’ reached its peak (23.88 mg·kg
-1) on day 20, and ‘TY Megaton’ (22.05 mg·kg
-1) on day 16 (Table 3). Lycopene synthesis increased with increasing storage duration. In ‘TY Megaton’, storage for more than 16 days after harvest led to a decrease in the total lycopene content, while in ‘Yureka’ it increased for up to 20 days. As George et al. (2004) proposed, this might be due to the nature of the cultivar.
The present study revealed high correlation (r
2= 0.92) between tomato color (Hunter a value) and lycopene content (Table
4). Lycopene content increases significantly as tomato fruits mature from the green stage to the red stage (Dumas et al.,
2003; Brandt et al., 2006; Helyes et al., 2006). Lycopene begins to accumulate after the breaker stage, and by the ripe - red
stage, lycopene comprises 95% of all colored carotenoids and 73% of the total carotenoids (Dumas et al., 2003). The
antioxidant properties of carotenoids may offer protection against some forms of cancer (Opiyo and Ying, 2005).
Ascorbic Acid
In both cultivars, significant (p < 0.05) variation in ascorbic acid content was observed throughout the storage period. The Table 2. Changes in soluble solids content, titratable acid and pH of ‘TY Megaton’ and ‘Yureka’ tomato cultivars, as affected by storage duration
at 12 ℃ .
Parameters Variety Storage days
0 4 8 12 16 20
SSC (ºBrix) TY Megaton 5.40 ± 0.10
aA5.40 ± 0.12
aA5.46 ± 0.11
aA5.64 ± 0.09
aA5.58 ± 0.4
aA5.62 ± 0.13
aAYureka 5.16 ± 0.18
aB5.26 ± 0.32
aB5.28 ± 0.16
aB5.24 ± 0.15
aB5.32 ± 0.29
aB5.26 ± 0.30
aBTA (mg · 100g
-1) TY Megaton 0.85 ± 0.05
Aa0.82 ± 0.04
Aa0.82 ± 0.05
Aa0.80± 0.01
Aa0.83± 0.04
Aa0.78 ± 0.04
AaYureka 0.71 ± 0.09
Ba0.72 ± 0.03
Ba0.62 ± 0.09
Bb0.64 ± 0.02
Bb0.62 ± 0.01
Bb0.61 ± 0.06
BbpH TY Megaton 4.52 ± 0.52
Aa4.58 ± 0.59
Aa4.69 ± 0.27
Aa4.65 ± 0.18
Aa4.88 ± 0.26
Aa4.97 ± 0.14
AaYureka 5.53 ± 0.19
Ba5.59 ± 0.06
Ba5.65 ± 0.09
Ba5.63 ± 0.24
Ba5.60 ± 0.25
Ba5.69 ± 0.24
BaValues with different upper case letters within the same column, and means with different lower case letters within the same row are significantly different ( p < 0.05).
For each value, mean ± standard deviation was determined from five replicates.
Table 3. Changes in lycopene content, ascorbic acid, total phenolics, and DPPH scavenging power of ‘TY Megaton’ and ‘Yureka’ tomato cultivars, as affected by storage duration at 12 ℃ .
Parameters Variety Storage days
0 4 8 12 16 20
Lycopene (mg · kg
-1) TY Megaton 5.43 ± 0.03
aA10.66 ± 0.03
bA12.84 ± 0.13
cA17.77 ± 0.07
dA22.05 ± 0.03
eA16.84 ± 0.02
fAYureka 4.00 ± 0.15
aB10.49 ± 0.10
bA15.98 ± 0.08
cB21.71 ± 0.05
dB21.51 ± 0.17
eA23.88 ± 0.12
fBAscorbic acid (mg · 100g
-1) TY Megaton 31.32 ± 0.25
aA25.89 ± 0.32
bA24.48 ± 0.67
cA23.29 ± 0.41
dA22.89 ± 0.34
dA21.01 ± 1.78
eAYureka 30.16 ± 0.23
aB29.72 ± 1.02
aB24.77 ± 0.71
bA23.34 ± 0.55
cA22.98 ± 0.18
cA22.95 ± 0.49
cBTotal phenolics (mg GAE · kg
-1) TY Megaton 231.30 ± 3.12
aA220.04 ± 14.7
bA245.12 ± 11.39
cA233.08± 5.34
aA238.18 ± 5.8
aA237.42 ± 6.3
aAYureka 262.67 ± 11.5
aB266.37 ± 13.6
aB279.13 ± 5.45
bB276.46 ± 0.97
bB268.05 ± 2.5
aB263.76 ± 8.4
aBDPPH inhibition (%)
ZTY Megaton 91.04 ± 0.72
aA91.72 ± 0.42
aA91.44 ± 0.21
aA93.63 ± 0.80
bA94.69 ± 0.65
cA91.4 ± 0.98
aAYureka 0.57 ± 0.51
aB90.58 ± 0.22
aB90.61 ± 0.80
aB92.24 ± 0.54
bB93.06 ± 0.79
cB93.07 ± 0.54
cBValues with different upper case letters within the same column, and means with different lower case letters within the same row are significantly different ( p < 0.05).
Z