© 2014 The Korean Ophthalmological Society
This is an Open Access article distributed under the terms of the Creative Commons Attribution Non-Commercial License (http://creativecommons.org/licenses /by-nc/3.0/) which permits unrestricted non-commercial use, distribution, and reproduction in any medium, provided the original work is properly cited.
Original Article
Accuracy of Biometry for Intraocular Lens Implantation Using the New Partial Coherence Interferometer, AL-scan
Sang Woo Moon1,2, Sung Hyup Lim1,2, Ho Young Lee3
1Department of Ophthalmology, Busan Paik Hospital, Inje University College of Medicine, Busan, Korea
2Therapeutics Center for Ocular Neovascular Disease, Busan, Korea
3Shinsegae Eye Clinic, Busan, Korea
Purpose: To compare the refractive results of cataract surgery measured by applanation ultrasound and the new partial coherence interferometer, AL-scan.
Methods: Medical records of 76 patients and 104 eyes who underwent cataract surgery from January 2013 to June 2013 were retrospectively reviewed. Biometries were measured using ultrasound and AL-scan and in- traocular lens power was calculated using the SRK-T formula. Automatic refraction examination was done 1 month after the operation, and differences between the ultrasound group and AL-scan group were compared and analyzed by mean absolute error.
Results: Mean axial length measured preoperatively by the ultrasound method was 23.53 ± 1.17 mm while the lengths measured using the AL-scan were 0.03 mm longer than that of the ultrasound group (23.56 ± 1.15 mm). However, there was not a significant difference in this finding (p = 0.638). Mean absolute error was 0.34
± 0.27 diopters in the ultrasound group and 0.36 ± 0.31 diopters in AL-scan group, which showed no significant difference (p = 0.946) in precision of predicting postoperative refraction.
Conclusions: Although the difference was not statistically significant, intraocular lens calculations done by the AL-scan were nearly similar in predicting postoperative refraction compared to those of applanation ultra- sound, however more precise measurements may be obtained if the axial length is longer than 24.4 mm. Ex- cept in the case of opacity in the media, which makes obtaining measurements with the AL-scan difficult, AL- scan could be a useful biometry in cataract surgery.
Key Words: Biometry, Interferometery, Phacoemulsification, Ultrasonography
Satisfaction of patients undergoing cataract surgery is dependent on precise predictions of refractory outcomes.
Over the years, development of biometry, phacoemulsifica- tion, and intraocular lens (IOL) calculation enabled precise prediction of postoperative refractory status.
To obtain accurate IOL power, a number of factors are needed. These biometries include axial length, corneal re- fractive power, and anterior chamber depth. Among these factors, Olsen [1]reported that axial length plays a main role in determining postoperative refraction and is respon- sible for 54% of the actual refractive error. Axial length error of 100 μm translates to a postoperative refraction er- ror of 0.28 diopters (D).
Until recently, axial length was measured by using ap- planation ultrasound technique, which involves contact
Received: November 18, 2013 Accepted: April 17, 2014
Corresponding Author: Ho Young Lee, MD. Shinsegae Eye Clinic, #783- 1 Gaya-daero, Busanjin-gu, Busan 614-849, Korea. Tel: 82-51-808-8288, Fax: 82-51-808-8238, E-mail: [email protected]
with the cornea and can result in corneal epithelial injury, infection, and patient discomfort. Error due to corneal in- dentation, which can lead to axial lengths 0.1 to 0.3 mm shorter than those measured by the immersion technique, is also a major disadvantage of the applanation ultrasound method [2].
To overcome this limitation, a partial coherence interfer- ometer (PCI), which is based on the principle similar to that of optical coherence tomography, was introduced. Ax- ial length measured by this method was comparable to that of other methods in precision and repeatability. Especially considering that the method is of the non-applanation type, it has the advantage of giving the patient less discomfort and has a low interobserver error [3-6].
Commonly used PCIs in the clinical setting include the IOL Master(Carl Zeiss Meditiec, Jena, Germany) and Len- star(Haag Steit AG, Koeniz, Switzerland). Recently, the new PCI AL-scan(Nidek, Gamagori, Japan) has been in- troduced and increases precision by using a 3-dimentional ocular tracking technique. By using PCI and scheimpflug imaging techniques, AL-scanmade it possible to measure axial length, corneal refractive power, anterior chamber depth, central corneal thickness, white-to-white distance, and pupil size in a single sitting based on those values and automatically calculates the appropriate IOL power to be used in cataract surgery by onboard software.
According to previous studies, it is known that the IOL Master and Lenstarshow greater or similar accuracy com- pared to the conventional ultrasound techniques [3,7,8].
However, studies on the newly launched PCI, AL-scan, are lacking. Therefore, in this study we used AL-scan to mea- sure axial length and refraction. With the obtained values, IOL power is calculated to look for the degree of error compared with the predicted value preoperatively and ana- lyze the accuracy compared to values obtained from ultra- sound.
Materials and Methods
Medical records of 76 patients (104 eyes) who underwent phacoemulsification and posterior chamber IOL (AcrySof IQ SN60WF; Alcon, Forth Worth, TX, USA) implantation from January 2013 to June 2013 were retrospectively re- viewed. The operation was the temporal clear corneal inci- sion technique. Patients had follow up of more than 1
month.
Those with factors known to influence visual acuity were excluded such as history of intraocular operation, in- flammation, retinopathy, and others. Cases of posterior capsule rupture during cataract surgery and those requir- ing sutures at the corneal incision site were excluded. Fur- thermore, patients with axial length that could not be mea- sured by the AL-scan were not included in the statistical process.
In the AL-scan group, axial length, anterior chamber depth, and corneal refractive power were measured by the AL-scan. In the ultrasound group, corneal refractive power was measured by auto kerato refractometer (KR-1; Topcon, Tokyo, Japan), and applanation ultrasound (Echoscan US- 4000, Nidek) was used to obtain anterior chamber depth and axial length.
IOL power was calculated using the SRK-T formula and the A-constant was maintained at 118.7, a value provided by the manufacturer. The predicted refraction value target- ed emmetropia and myopia on patient request. Automatic refraction examination was done at the 1-month follow-up after the operation to obtain the actual postoperative re- fraction value.
Mean numerical error (MNE) was achieved based on the difference between actual refraction value and desired re- fraction value using the SRK-T formula. We assessed the result as hyperopic if the value was negative and myopic when positive. Also, with the absolute value of actual dif- ference and by averaging it, mean absolute error (MAE) could be calculated to evaluate the precision of the IOL power calculation. Differences between the ultrasound group and AL-scan group were compared and analyzed by MNE and MAE.
It has been reported that biometry measurements by ap- planation ultrasound technique and by PCI technique vary by axial length. Generally the measurement attained from the PCI is higher [6,9]so if the reverse result is drawn in the actual clinic setting the reliability of the measurement must be questioned. Also, Lee et al. [10] reported that post- operative refraction predicted by using the SRK-T formula is generally precise but refraction error had a relationship with the axial length. Based on the axial length of 24.4 mm, which is the value used to compensate axial length in the formula, axial lengths shorter than 24.4 mm tend to have hyperopic shift as eyes get shorter, and vice versa.
Therefore, in this study we separated the group of patients
with longer axial length measurements by ultrasound and AL-scan and analyzed the results drawn from those groups. Also, patients were divided into two groups by ax- ial length of 24.4 mm, which was measured by ultrasound.
Differences of axial length measured by ultrasound and PCI were compared and analyzed using the paired t-test.
Comparison of predictive error between those two meth- ods was analyzed by absolute value using Wilcoxon rank test. A p-value of less than 0.05 indicated statistical signifi- cance.
Results
A total of 75 patients and 104 eyes were included in this study. The mean age was 67.4 ± 9.6 years. A total of 6 eyes failed to have axial length measured by the AL-scan (5.77%) and were excluded from the statistic analysis.
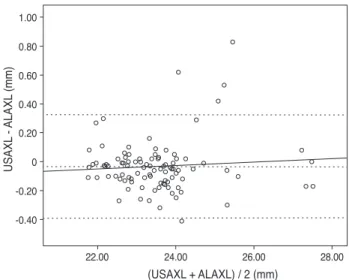
Axial length measurement by the two methods showed a statistically significant relationship (r = 0.976, p < 0.01) (Fig.
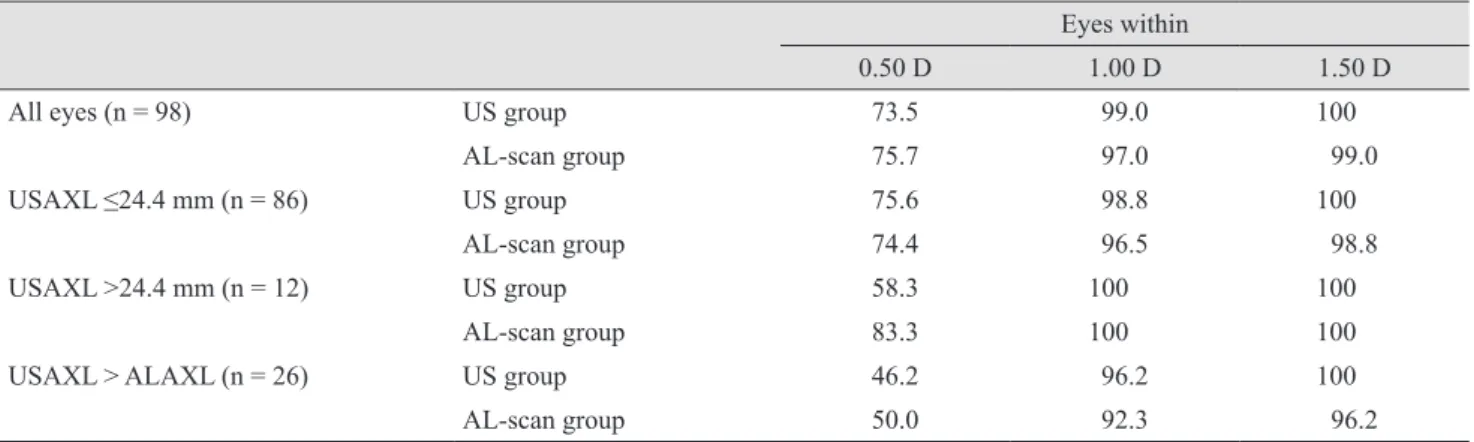
1). The dotted lines are the line of equality for the corre- sponding two methods. The Bland-Altman plot was exam- ined to evaluate the agreement between the two methods (Fig. 2). Most values are along the dotted line (±1.96 stan- dard deviation [SD], -0.3919 to 0.3251), meaning the meth- ods were comparable. Furthermore, the slope of the regres- sion line being 0.012 represents low error between the two methods and high reliability.
Mean axial length measured preoperatively by ultra- sound was 23.53 ± 1.17 mm, and AL-scanmeasurements were 0.03 mm longer than that of the ultrasound group (23.56 ± 1.15 mm). However, there was no significant dif- ference in this finding (p = 0.638). Anterior chamber depth measured by the two methods was 3.17 ± 0.34 mm and 3.14
± 0.39 mm, with the ultrasound group having the lower value, but the difference was not significant (p = 0.764) (Table 1).
Post operative MNE in the ultrasound group was slightly hyperopic by -0.05 ± 0.43 D. In addition the AL-scan group had a tendency to be myopic by 0.13 ± 0.45 D, which was a statistically significant difference (p = 0.02). MAE was 0.34
± 0.27 D in the ultrasound group and 0.36 ± 0.31 D in the AL-scan group, which showed no significant difference (p
= 0.946) in precision in predicting post-operative refraction (Table 1). There was no statistically significant difference in corneal refractive power between the two groups as
well. Examining the distributions determined by each method, MAE less than 0.5 D was found in the ultrasound
Fig. 1. Scatter plots to compare means for axial length measured with ultrasound and AL-scan. Axial length measurement by two methods showed a statistically significant relationship. USAXL
= axial length measured with applanation ultrasound; ALAXL = axial length measured with AL-scan. r = 0.976, p < 0.01.
USAXL (mm)
ALAXL (mm)
22.00 24.00 26.00 28.00
22.00 24.00 26.00 28.00
Fig. 2. Bland-Altman plots for assessing agreement of pairs of two methods. y = 0.012 X - 0.317; mean = -0.0334 ; mean +2 SD
= 0.32508 ; mean -2 SD = -0.39188. The solid line represents the average mean difference (-0.0334) and the dotted line represents the 95 percentile confidence interval. The slope of regression line is 0.012 and represents low error between two methods and high reliability. In the scatter plot, most values are on the dotted line (±1.96 SD, -0.3919 to 0.3251), suggesting good comparability. SD = standard deviation; USAXL = axial length measured with appla- nation ultrasound; ALAXL = axial length measured with AL-scan.
(USAXL + ALAXL) / 2 (mm)
USAXL - ALAXL (mm)
22.00 24.00 26.00 28.00
-0.40 -0.20 0 0.20 0.40 0.60 0.80 1.00
group in 73.5% of cases, and 75.5% of cases in the AL- scan group. Furthermore, MAE less than 1 D was 99% and 97% each, and less than 1.5 D was 100% and 99% each, respectively (Table 2).
The group with an axial length shorter than 24.4 mm in- cluded a total of 86 eyes, mean axial length measured by applanation ultrasound method and AL-scan was 23.18 ± 0.65 mm and 23.23 ± 0.68 mm, respectively and neither finding had a significant difference (p = 0.551) (Table 3).
There were 12 eyes with an axial length longer than 24.4 mm and mean axial length measured by each method was 25.84 ± 1.21 mm (ultrasound group) and 25.95 ± 1.08 mm (AL-scan group), which also showed no significant differ- ence (p = 0.751) (Table 4). However, the difference between the two methods was 0.11 mm, which was relatively higher than the group with an axial length of less than 24.4 mm.
In the case of an axial length less than 24.4 mm, MNE was -0.03 ± 0.41 D in the ultrasound group and MAE was
0.32 ± 0.25 D. In the AL-scan group, it was 0.12 ± 0.48 D, 0.38 ± 0.32 D each, which showed no significant difference in precision between two groups (p = 0.088, 0.416) (Table 3). In the case of an axial length longer than 24.4 mm, MNE was -0.14 ± 0.56 D in the ultrasound group and MAE was 0.44 ± 0.34 D. In the AL-scan group, it was 0.22
± 0.22 D, 0.22 ± 0.21 D each, which has shown no signifi- cant difference in precision between two groups (p = 0.076, 0.064) (Table 4). However, comparing the results of the ax- ial length shorter than 24.4 mm group (MAE, 0.06), MAE was relatively higher in axial length longer than 24.4 mm group by 0.22 D. Also, by looking at the result distribution of each method, when the axial length is shorter than 24.4 mm, the distribution between each method was even. On the other hand, in the group with an axial length longer than 24.4 mm, the percentage of patients with an MAE lower than 0.5 D was 83.3% in AL-scan group, which was higher than the ultrasound group (58.3%) (Table 2).
Table 2. Percentage of cases predicted to within ±0.50 D, ±1.00 D, and ±1.50 D of each group
Eyes within
0.50 D 1.00 D 1.50 D
All eyes (n = 98) US group 73.5 99.0 100
AL-scan group 75.7 97.0 99.0
USAXL ≤24.4 mm (n = 86) US group 75.6 98.8 100
AL-scan group 74.4 96.5 98.8
USAXL >24.4 mm (n = 12) US group 58.3 100 100
AL-scan group 83.3 100 100
USAXL > ALAXL (n = 26) US group 46.2 96.2 100
AL-scan group 50.0 92.3 96.2
Values are presented as %.
D = diopter; US = ultrasound; USAXL = axial length measured with applanation ultrasound; ALAXL = axial length measured with AL- scan.
Table 1. Refractive results: comparison of the ultrasound group and the AL-scan group (all eyes, n = 98)
Ultrasound group AL-scan group p-value
Axial length (mm) 23.53 ± 1.17 23.56 ± 1.15 0.638
Anterior chamber depth (mm) 3.17 ± 0.34 3.14 ± 0.39 0.764
Mean numerical error (D) -0.05 ± 0.43 0.13 ± 0.45 0.020
Mean absolute error (D) 0.34 ± 0.27 0.36 ± 0.31 0.946
K1 (D) 44.12 ± 1.50 44.08 ± 1.45 0.813
K2 (D) 44.48 ± 4.41 44.96 ± 1.63 0.730
Values are presented as mean ± standard deviation.
D = diopter; K = corneal refractive power (keratometric diopter).
The axial length of 21 eyes measured by the ultrasound method was longer than that measured by the AL-scan. In this case, MAE values of the ultrasound and AL-scan groups were 0.49 ± 0.33 and 0.53 ± 0.38 D, respectively, and there was no significant difference in precision be- tween the two groups (p = 0.876) (Table 5). However, both groups had higher MAE than any of the other cases, and also rated the MAE lower than 0.5 D was shown to be low- er by 46.2% and 50%, respectively (Table 2).
Discussion
Since PCI principle-based IOL Masterwas introduced in 1992, many studies have been launched to compare this new technology to the conventional applanation ultrasound method. Generally PCI is capable of measuring axial lengths 0.1 to 0.5 mm longer than applanation ultrasound [11,12].In this study using AL-scan which is also based on the PCI principle, total patients had longer axial length than that measured by the ultrasound method. This study Table 4. Refractive results: comparison of the ultrasound group and the AL-scan group (axial length >24.4 mm, n = 12)
Ultrasound group AL-scan group p-value
Axial length (mm) 25.48 ± 1.21 25.95 ± 1.08 0.751
Anterior chamber depth (mm) 3.45 ± 0.27 3.55 ± 0.26 0.340
Mean numerical error (D) -0.14 ± 0.56 0.22 ± 0.22 0.073
Mean absolute error (D) 0.44 ± 0.34 0.22 ± 0.21 0.064
K1 (D) 43.77 ± 1.31 43.75 ± 1.26 0.862
K2 (D) 44.69 ± 1.36 44.78 ± 1.44 0.862
Values are presented as mean ± standard deviation.
D = diopter; K = corneal refractive power (keratometric diopter).
Table 3. Refractive results: comparison of the ultrasound group and the AL-scan group (axial length ≤24.4 mm, n = 86)
Ultrasound group AL-scan group p-value
Axial length (mm) 23.18 ± 0.65 23.23 ± 0.68 0.551
Anterior chamber depth (mm) 3.13 ± 0.33 3.08 ± 0.37 0.537
Mean numerical error (D) -0.03 ± 0.41 0.12 ± 0.48 0.088
Mean absolute error (D) 0.32 ± 0.25 0.38 ± 0.32 0.416
K1 (D) 44.17 ± 1.52 44.13 ± 1.47 0.782
K2 (D) 44.45 ± 4.69 44.98 ± 1.66 0.747
Values are presented as mean ± standard deviation.
D = diopter; K = corneal refractive power (keratometric diopter).
Table 5. Refractive results: comparison of the ultrasound group and the AL-scan group (ultrasound axial length > AL-scan axial length, n = 26)
Ultrasound group AL-scan group p-value
Axial length (mm) 23.66 ± 1.28 23.49 ± 1.19 0.596
Anterior chamber depth (mm) 3.17 ± 0.34 3.08 ± 0.40 0.365
Mean numerical error (D) -0.19 ± 0.57 0.39 ± 0.53 0.001
Mean absolute error (D) 0.49 ± 0.33 0.53 ± 0.38 0.876
K1 (D) 44.70 ± 1.58 44.64 ± 1.51 0.862
K2 (D) 45.62 ± 1.86 45.66 ± 1.96 0.934
Values are presented as mean ± standard deviation.
D = diopter; K = corneal refractive power (keratometric diopter).
showed that there was no statistically significant difference between these two groups, but a strong relationship was identified. This result is thought to be from the different measurement technique. PCI and ultrasound have different refraction planes and also, in the case of applanation ultra- sound, the degree of corneal indentation differs depending on the skill of the examiner [13,14].
By reviewing the previous studies regarding prediction of postoperative refraction, there are many studies report- ing PCI benefit over the ultrasound method [12,15].Con- versely, there are studies reporting similar precision be- tween those two methods [16].This study of the AL-scan also has shown no significant difference in MAE between the two groups using each method. However, the study re- vealed that MAE in the AL-scan group had the tendency of becoming statistically significantly myopic compared to the ultrasound group. We used the A constant offered by the manufacturer but studies revealed a need for adjusting the A-constant [17].
Furthermore, to compare precision in predicting postop- erative refraction by the axial length, patients were divided into two groups based on axial length above and below 24.4 mm. Analysis performed by these groups revealed no significant difference in precision between the two groups.
However, in the axial length over 24.4 mm group, MAE difference between the ultrasound group and AL-scan group was larger and the percentage of patients showing a desired refraction of +0.5 D was higher in the AL-scan group. There is controversy regarding the relevance of re- fraction prediction error by axial length using PCI, so fur- ther studies will be necessary [9,16].
The axial length of 26 eyes was longer using the ultra- sound method than the AL-scanmethod, and there was no significant difference between the two groups using each method. However, MAE was higher than other cases in both the ultrasound and AL-scan group. Postoperative tar- get refraction of +0.5 D was less than 50% in both groups.
Theoretically, ultrasound measures sound wave refracted from the internal limiting membrane while PCI measures the light refracted from the retinal pigment epithelium, which results in a difference of 130 μm. When considering not only the theoretical background but also the results of this study, systemic error may have played an important role when axial length was longer with the ultrasound technique. Such systemic error includes examiner error, patient error, and possible error when using the AL-scan.
So, in this case, remeasurement is required.
PCI is a simple method and is more comfortable for the patient compared to the ultrasound method. It is also a noncontact method, and thus risk for infection is lower.
However, in cases of severe cataracts, posterior capsular cataract, and difficult fixation, PCI cannot measure axial length with an accuracy greater than 10% to 20% [13].In our study, of the 104 eyes, six eyes (5.77%) could not be measured by the AL-scan. According to the manufacturer, AL-scancan measure eyes with dense cataracts, as ad- vanced measurement algorithms enhance the signal-to- noise ratio by decreasing noise and boosting the signal.
However, further study is warranted if AL-scan has higher success rates in measuring axial length.
Here, we compared the precision in predicting postoper- ative refraction between AL-scan and applanation ultra- sound. Eventually, IOL calculations made with the AL- scanwere nearly similar in predicting postoperative refraction compared to that of using the applanation ultra- sound, but it may be more precise in predicting postopera- tive refraction when the axial length is longer than 24.4 mm. Except in the case of opacity of the media, which makes it more difficult to obtain measurements by the AL- scan, this technique could be a useful biometry in cataract surgery.
Conflict of Interest
No potential conflict of interest relevant to this article was reported.
References
1. Olsen T. Sources of error in intraocular lens power calcu- lation. J Cataract Refract Surg 1992;18:125-9.
2. Giers U, Epple C. Comparison of A-scan device accuracy. J Cataract Refract Surg 1990;16:235-42.
3. Findl O, Drexler W, Menapace R, et al. Improved predic- tion of intraocular lens power using partial coherence in- terferometry. J Cataract Refract Surg 2001;27:861-7.
4. Nemeth J, Fekete O, Pesztenlehrer N. Optical and ultra- sound measurement of axial length and anterior chamber depth for intraocular lens power calculation. J Cataract Refract Surg 2003;29:85-8.
5. Findl O, Drexler W, Menapace R, et al. High precision bi- ometry of pseudophakic eyes using partial coherence inter- ferometry. J Cataract Refract Surg 1998;24:1087-93.
6. Rajan MS, Keilhorn I, Bell JA. Partial coherence laser in- terferometry vs conventional ultrasound biometry in intra- ocular lens power calculations. Eye (Lond) 2002;16:552-6.
7. Cruysberg LP, Doors M, Verbakel F, et al. Evaluation of the Lenstar LS 900 non-contact biometer. Br J Ophthalmol 2010;94:106-10.
8. Buckhurst PJ, Wolffsohn JS, Shah S, et al. A new optical low coherence reflectometry device for ocular biometry in cataract patients. Br J Ophthalmol 2009;93:949-53.
9. Hasemeyer S, Hugger P, Jonas JB. Preoperative biometry of cataractous eyes using partial coherence laser interferome- try. Graefes Arch Clin Exp Ophthalmol 2003;241:251-2.
10. Lee MK, Hwang KY, Kim MS. Effects of axial length and vitrectomy on refractive error after cataract surgery using SRK/T formula. J Korean Ophthalmol Soc 2013;54:257-64.
11. Drexler W, Findl O, Menapace R, et al. Partial coherence interferometry: a novel approach to biometry in cataract surgery. Am J Ophthalmol 1998;126:524-34.
12. Haigis W, Lege B, Miller N, Schneider B. Comparison of
immersion ultrasound biometry and partial coherence in- terferometry for intraocular lens calculation according to Haigis. Graefes Arch Clin Exp Ophthalmol 2000;238:765- 73.
13. Tehrani M, Krummenauer F, Blom E, Dick HB. Evaluation of the practicality of optical biometry and applanation ultra- sound in 253 eyes. J Cataract Refract Surg 2003;29:741-6.
14. Packer M, Fine IH, Hoffman RS, et al. Immersion A-scan compared with partial coherence interferometry: outcomes analysis. J Cataract Refract Surg 2002;28:239-42.
15. Kiss B, Findl O, Menapace R, et al. Refractive outcome of cataract surgery using partial coherence interferometry and ultrasound biometry: clinical feasibility study of a commercial prototype II. J Cataract Refract Surg 2002;28:230-4.
16. Song BY, Yang KJ, Yoon KC. Accuracy of partial coher- ence interferometry in intraocular lens power calculation.
J Korean Ophthalmol Soc 2005;46:775-80.
17. Madge SN, Khong CH, Lamont M, et al. Optimization of biometry for intraocular lens implantation using the Zeiss IOLMaster. Acta Ophthalmol Scand 2005;83:436-8.