© 2018 The Korean Ophthalmological Society
This is an Open Access article distributed under the terms of the Creative Commons Attribution Non-Commercial License (http://creativecommons.org/licenses /by-nc/3.0/) which permits unrestricted non-commercial use, distribution, and reproduction in any medium, provided the original work is properly cited.
Original Article
Time Series Changes in Cataract Surgery in Korea
Ju Hwan Song1*, Jung Youb Kang2*, Ki Yup Nam2, Seung Uk Lee2, Sang Joon Lee2,3
1The Bom Eye Clinic, Busan, Korea
2Department of Ophthalmology, Kosin University College of Medicine, Busan, Korea
3Institute for Medicine, Kosin University, Busan, Korea
Cataract causes about half of the world’s blindness cases, and the World Health Organization suggests an annual min-
imum target of at least 300 surgeries per 100,000 people [1,2].
However, the number of actual cataract surgeries varies ac- cording to socioeconomic status, healthcare infrastructure, demographics, and awareness of cataract level [3-8].
The number of cataract surgeries in general is rising due to an aging population, enhanced expectations among pa- tients who want to live with better visual acuity, and ad- vancements in medical technology [3-5,9-11]. Recently, the age of patients receiving cataract surgery has decreased, and
Received: June 12, 2017 Accepted: September 14, 2017
Corresponding Author: Sang Joon Lee, MD, PhD. Department of Oph- thalmology, Kosin University College of Medicine, #262 Gamcheon-ro, Seo-gu, Busan 49267, Korea. Tel: 82-51-990-6140, Fax: 82-51-990-3026, E-mail: [email protected]
*These two authors contributed equally to this work.
Purpose: We analyzed time series changes in cataract surgeries in Korea, and provide basic data to enhance the efficiency of medical services for cataract surgery.
Methods: Among cataract surgery statistics registered in the Korean National Health Insurance Cooperation from 2006 to 2012, we used data regarding the number of patients and operations and the number of patients and operations per 100,000 people. We analyzed various time series changes, including differences by sex and age.
Results: The total numbers of patients from 2006 to 2012 by year were 207,370; 228,170; 250,289; 268,548;
289,867; 308,111; and 302,182, respectively. The total numbers of operations from 2006 to 2012 by year were 272,920; 305,807; 338,332; 365,874; 398,338; 428,158; and 420,905, respectively. The number of patients and operations per 100,000 people were highest in men 80 to 84 years old and women 75 to 79 years old.
Comparing the number of operations in 2006 and after, the patient age group with the highest increase rate changed from over 85 years old to 75–79 years old since 2010 in men and from over 85 years old to 50–54 years old since 2009 in women. For each year investigated, the number of operations performed was higher than the number of patients who received operations.
Conclusions: Over the study period, the number of cataract surgeries increased, while the age of cataract pa- tients decreased. Additionally, the number of cataract-related surgeries increased in relation to the number of patients.
Key Words: Cataract extraction, Epidemiology, Trends
the number of binocular cataract surgeries has increased [10,12].
Cataract can have a negative effect on quality of life and socioeconomic activities. It is therefore important to prop- erly treat cataract and essential not only to understand the prevalence and awareness of cataract, but also to analyze the epidemiology of cataract surgery. We could not identify the actual occurrence of cataracts, but we could predict prev- alence using data on the number of cataract patients and surgeries. We investigated time series changes in the num- ber of cataract surgeries and the trends for whole age groups in the Korean population. There is no formal data on these topics, so our work provides basic knowledge to enhance medical services related to cataract surgery.
Materials and Methods
Ethics statement
This study was conducted with the approval of the insti- tutional review board of Kosin University Gospel Hospital, South Korea (91961-ABG-15-017).
Data sources
We used data registered by the Korean National Health Insurance Service from January 1, 2006 to December 31, 2012 regarding major domestic surgeries performed and that were published by Statistics Korea. We specifically an- alyzed data on the number of cataract surgery patients during this time period, the number of cataract surgeries per- formed according to age and sex, the number of cataract surgery patients, and the number of cataract surgeries per 100,000 people. The categories of cataract surgery, accord- ing to Statistics Korea are pars plana lensectomy, intracap- sular cataract extraction, extracapsular cataract extraction, phacoemulsification, primary intraocular lens implantation, after-cataract surgery, secondary intraocular lens implanta- tion, and intraocular lens exchange.
Statistical analyses
All included patients underwent one of the cataract sur- geries mentioned above. In cases where a patient received more than one cataract surgery within the same year, the
total number of patients remained the same regardless of the numbers of operations, but the total number of opera- tions increased. When a patient received more than two types of simultaneous cataract surgeries (for example, phacoemulsification with primary intraocular lens implan- tation), the number of operations was considered as one for statistical analysis. Population references for the number of patients per 100,000 people and the number of operations per 100,000 people were based on the total population re- ceiving medical insurance coverage, including national health insurance and type-1 and type-2 recipients of Na- tional Basic Livelihood Security including phakia, pseu- dophakia, and aphakia cases. We organized patients into the following age groups: <1 year old, 1–4 years old, 5–9 years old, a group for every 5-year interval up to 85 years, and finally ≥85 years old.
We calculated the average number of patients and opera- tions and the average number of patients and operations per 100,000 people over 7 years. To investigate the overall trend in cataract surgery frequency over 7 years, we ana- lyzed the annual growth trend and identified age groups that accounted for the highest number of surgeries for each sex. From the total number of operations, we calculated the ratio of female-to-male cases. Using annual fluctuations, we sought to differentiate trends for female cases and trends for male cases. We also conducted analyses based on the number of operations per 100,000 people for each age group of women and men and noted any sex differences for each age group. To understand any age-related changes in cataract surgery cases, we compared the annual number of operations that occurred in 2007 or later with that of 2006 according to age group and then analyzed the trend for the age group with the highest increase rate. The ratio of the number of operations to the number of patients was calcu- lated and analyzed by year to understand the trend of pa- tients who received surgery at least twice in the same year.
Descriptive analyses to estimate the mean number of pa- tients and the number of operations over 7 years, as well as the number of patients and operations per 100,000 people, were performed using PASW Statistics ver. 18.0 (SPSS Inc., Chicago, IL, USA). We conducted annual trend analyses with Spearman’s rank correlation test. Annual changes in the fe- male-to-male surgery ratio and the trend regarding the ratio of the number of operations to the number of patients re- ceiving operations were estimated using Spearman’s rank correlation test. For the trend of the age group to show the
peak increase rate of operations compared to 2006 was an- alyzed using GraphPad Prism ver. 6 (GraphPad Software, San Diego, CA, USA).
Results
The average number of patients who underwent opera- tion from 2006 to 2012 was 264,934 in the total population, with an average of 106,919 for men and 158,015 for women.
The average number of operations over the 7 years was 138,904 for men and 222,572 for women. The average num- ber of patients per 100,000 people over the 7 years was 423.13 for men and 630.18 for women. The average number of op- erations per 100,000 people over the 7 years was 549.59 for men and 887.44 for women. Over a 7-year period, there was a larger number of surgeries performed on female patients than male patients (Table 1). However, both sexes showed an increase over time in number of patients, number of op- erations, number of patients per 100,000 people, and num- ber of operations per 100,000 people (p < 0.001).
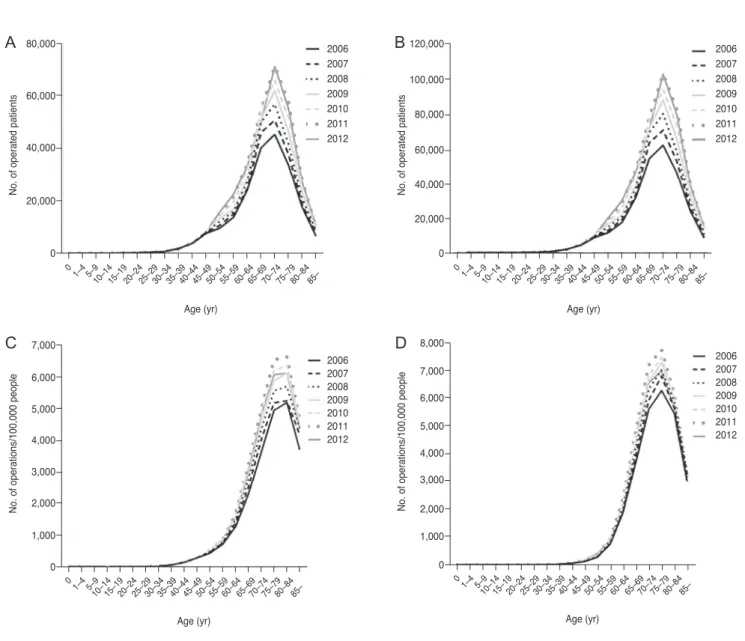
The peak age group of patients receiving surgery and of the total number of operations was 70- to 74-year-olds among both men and women, regardless of investigation year (Fig. 1A, 1B). For the number of operations per 100,000 people, the peak age groups were men 80- to 84-years-old and women 75- to 79-years-old (Fig. 1C, 1D).
Considering the ratio of women-to-men cases in terms of number of operations, the absolute ratio of the number of
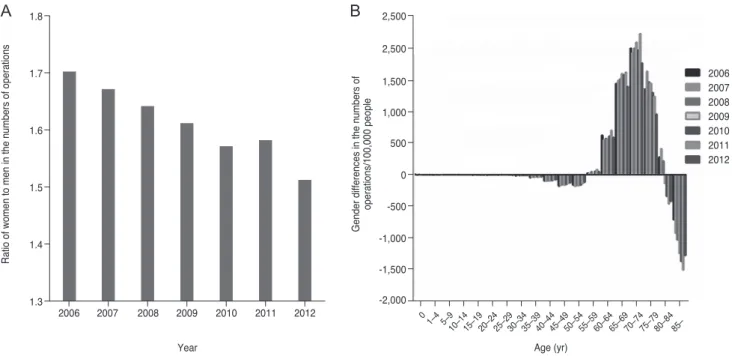
operations was higher among women with a trend that de- clined each year from 1.70 in 2006 to 1.51 in 2012 (Spear- man’s rho = -0.964, p < 0.001). Additionally, women’s share of the total number of operations decreased from 63.0% in 2006 to 60.2% in 2012 (Fig. 2A).
When we analyzed sex differences in terms of the num- ber of operations per 100,000 people according to age group, men showed higher frequency among the 50- to 54-year- old group and among the ≥85-year-old group than women, and women showed higher frequency among the 55- to 79-year-old group than men, presenting a bimodal curve of sex difference (Fig. 2B).
The increase rate of the annual number of operations among women from 2007 to 2012 compared to 2006 hit a peak in 2007 and 2008 among the >85-year-old group and from 2009 among the 50- to 54-year-old group, indicating that there was an increase in cataract surgeries among rel- atively younger age groups (Fig. 3A). For men, the increase rate peaked in 2007, 2008, and 2009 in the >85-year-old group and from 2010 in the 75- to 79-year-old group, simi- lar to the pattern observed in women (Fig. 3B).
The number of operations was higher than the number of patients for both men and women across all study years.
The ratio of the number of operations to the number of pa- tients showed a continuous increasing trend, from 1.25 (men) and 1.36 (women) in 2006 to 1.33 (men) and 1.44 (women) in 2012, with the number higher among women than men (Spearman’s rho = 1.000, p < 0.001) (Fig. 4).
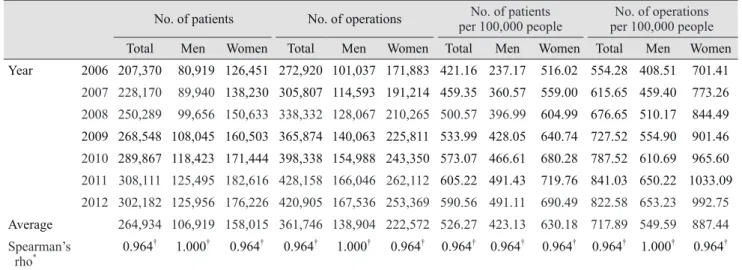
Table 1. The number of patients and operations and the number of patients and operations per 100,000 people from 2006 to 2012 No. of patients No. of operations No. of patients
per 100,000 people No. of operations per 100,000 people Total Men Women Total Men Women Total Men Women Total Men Women Year 2006 207,370 80,919 126,451 272,920 101,037 171,883 421.16 237.17 516.02 554.28 408.51 701.41
2007 228,170 89,940 138,230 305,807 114,593 191,214 459.35 360.57 559.00 615.65 459.40 773.26 2008 250,289 99,656 150,633 338,332 128,067 210,265 500.57 396.99 604.99 676.65 510.17 844.49 2009 268,548 108,045 160,503 365,874 140,063 225,811 533.99 428.05 640.74 727.52 554.90 901.46 2010 289,867 118,423 171,444 398,338 154,988 243,350 573.07 466.61 680.28 787.52 610.69 965.60 2011 308,111 125,495 182,616 428,158 166,046 262,112 605.22 491.43 719.76 841.03 650.22 1033.09 2012 302,182 125,956 176,226 420,905 167,536 253,369 590.56 491.11 690.49 822.58 653.23 992.75 Average 264,934 106,919 158,015 361,746 138,904 222,572 526.27 423.13 630.18 717.89 549.59 887.44 Spearman’s
rho* 0.964† 1.000† 0.964† 0.964† 1.000† 0.964† 0.964† 0.964† 0.964† 0.964† 1.000† 0.964†
*Spearman’s rank correlation test; †Statistically significant.
Discussion
This study showed the rising trend of cataract surgery cases, with the total number of operations increased by 54%
and the number of operations per 100,000 people increased by 48% from 2006 to 2012. This finding is primarily attrib- utable to the absolute rise in the population requiring cata- ract surgery due to the aging population [4,5,13]. According to estimated population data by Statistics Korea, there was an increase of 4 million in the population of people >50 years old. In addition, changes in lifestyle expectations among older individuals could be driving the trend toward a larger
number of cataract surgeries because older individuals are more likely than in the past to engage in social activities and live independently. Consequently, there is a greater de- mand for improved visual acuity and less tolerance for in- conveniences to daily life. In a quality-of-life study using data from the 4th Korea National Health and Nutrition Ex- amination Survey, Rim et al. [14] found that quality of life decreased in association with decrease in visual acuity. Cat- aract is associated with low visual acuity, and the desire to improve quality of life might have led to the observed in- crease in cataract surgeries.
Considering the sex proportion for number of operations,
No. of operated patients
Age (yr) 80,000
60,000
40,000
20,000
0
2006 2007 2008 2009 2010 2011 2012
01–45–9 10–14
15–19 20–24
25–29 30–34
35–39 40–44
45–49 50–54
55–59 60–64
65–69 70–74
75–79 80–84
85–
No. of operated patients
Age (yr) 120,000
100,000 80,000 60,000
20,000 40,000
0
2006 2007 2008 2009 2010 2011 2012
01–45–9 10–14
15–19 20–24
25–29 30–34
35–39 40–44
45–49 50–54
55–59 60–64
65–69 70–74
75–79 80–84
85–
A B
No. of operations/100,000 people
Age (yr) 7,000
5,000 6,000
4,000 3,000
1,000 2,000
0
20062007 20082009 20102011 2012
01–45–9 10–14
15–19 20–24
25–29 30–34
35–39 40–44
45–49 50–54
55–59 60–64
65–69 70–74
75–79 80–84
85–
No. of operations/100,000 people
Age (yr) 8,000
5,000 6,000 7,000
4,000 3,000
1,000 2,000
0
20062007 20082009 20102011 2012
01–45–9 10–14
15–19 20–24
25–29 30–34
35–39 40–44
45–49 50–54
55–59 60–64
65–69 70–74
75–79 80–84
85–
C D
Fig. 1. Peak age group with regard to number of patients, number of operations, number of patients per 100,000 people, and number of operations per 100,000 people according to age group and sex. (A,B) The peak age group for patients who underwent operation and for the highest number of total operations was 70 to 74 years for men and women for each year studied. (C,D) The peak age group for the number of operations per 100,000 people for each year studied was 80 to 84 years in men and 75 to 79 years in women.
the absolute proportion was higher in women, although it trended down by year, from 63% in 2006 to 60% in 2012.
In a Swedish study, no significant change was detected from 1992 to 2000 in terms of sex proportion for the num-
ber of cataract surgeries; however, the female proportion for the number of cataract surgeries decreased, similar to our study [4]. On the other hand, in the US Rochester Epi- demiology Project study, the number of cataract surgeries Fig. 3. Comparison of number of operations during 2006 and each year from 2007–2012, according to age group. The numerical values on the vertical axis indicate the increase rates in the annual numbers of operations from 2007–2012 compared to the number of operations in 2006. (A) For women, the age group associated with a peak increase rate began getting younger in 2009. (B) For men, the age group associ- ated with a peak increase rate began getting younger in 2010. *,†Peak age group of increase rate.
Increase rates of the numbers of operations among women (%) 100
80 60 40 20 0
2007/2006 2008/2006 2009/2006 2010/2006 2011/2006 2012/2006
35–39 40–44
45–49 50–54
55–59 60–64
65–69 70–74
75–79 80–84
85– Age (yr)
Increase rates of the numbers of operations among men (%)
120 100 80 60 40 20
-20 -40 0
2007/2006 2008/2006 2009/2006 2010/2006 2011/2006 2012/2006
35–39 40–44
45–49 50–54
55–59 60–64
65–69 70–74
75–79 80–84
85–
Age (yr)
A B
Fig. 2. Surgery frequency trends according to sex. (A) Women undergo operations more often than men, but the ratio of women to men in number of operations decreased with time (Spearman’s rho = -0.964, p < 0.001). (B) Sex differences in the number of operations per 100,000 people according to age group. Positive values on the vertical axis indicate that women underwent operations more frequently than men, and negative values on the vertical axis indicate that men underwent operations more frequently than women.
Ratio of women to men in the numbers of operations
Year 1.8
1.7
1.6
1.5
1.4
1.3 2006 2007 2008 2009 2010 2011 2012
Gender differences in the numbers of operations/100,000 people
Age (yr) 2,500
2,500 1,500 1,000 500
-500 -1,000 -1,500 -2,000 0
20062007 20082009 2010 20112012
01–45–9 10–14
15–19 20–24
25–29 30–34
35–39 40–44
45–49 50–54
55–59 60–64
65–69 70–74
75–79 80–84
85–
A B
for women significantly increased from 2005 to 2011, while that of men did not [5]. This result is different from ours and the Swedish study. Further study is needed to better under- stand the reasons for different sex and geography trends in the number of operations.
Our analyses also revealed the bimodal curve of sex dif- ference in the number of operations per 100,000 people ac- cording to age. These differences might be due to the follow- ing reasons described in previous studies. First, the reason that men not more than 54 years old underwent a larger number of operations was that they were active socially and physically so that they had high frequency of traumatic cata- ract caused from ocular trauma. Song et al.found that men accounted for 87.9% of patients hospitalized for ocular trau- ma, with the prevalence peaking among men in their 20s and decreasing in the order of those in their 30s, 10s, and 40s [15].
They also found that cataract surgery was the most common type of secondary surgery needed to treat complications from ocular trauma. In an epidemiological study of ocular trauma from industrial accidents by Lee et al. [16], men were the majority of the study population (96.65%), and 20- to 50-year-olds represented 86.8% of male cases.
Second, anterior and posterior polar cataracts, which have a significant impact on visual acuity, require earlier cataract surgery and are more common in the relatively younger
male group. This has resulted in more frequent cataract sur- geries in younger men (≤54 years) compared to similarly aged women. Kim et al.[17]found that men made up 81.4%
of anterior polar cataract cases, and 45.4% of these men were <40 years old. Kim and Joo [18] also reported that men predominated among cases of anterior polar cataract in Ko- rea compared to other countries. Further studies are required to identify the factors that contribute to high prevalence among Korean young men with anterior polar cataract.
Third, patient awareness of cataract might contribute to the higher number of operations per 100,000 people among men aged ≥85 years than women. Based on the 4th Korea National Health and Nutrition Examination Survey data, Ko- rean men had a lower awareness level than women about cat- aract [19]. Due to this, men were more likely to undergo sur- gery later than women, after they developed significant visual dysfunction and significant progression of the cataract.
Looking at the rate of increase in the number of opera- tions per year by age group from 2007 compared to that of 2006, the peak age group of men decreased from 2010, and that of women decreased from 2009. This indicates that there was an increase in cataract surgeries among relative- ly younger groups. In this study, there was a limitation to accurately calculating the average age of the patients who underwent surgery. However, we indirectly assumed the lowering of patient average age based on the increased fre- quency of cataract-related surgeries in relatively younger groups. This trend is similar to that observed in the Swed- ish study, which also identified a trend in declining average patient age beginning in 2000 [4]. These results anticipate a continuous declining trend of average age in Korean cata- ract surgery cases in the future.
Throughout the observation period of this study, the total number of operations was consistently higher among both men and women than was the number of the patients who underwent operations. This suggests that some patients un- derwent at least two cataract-related surgeries. We assume that these must be the patients who underwent binocular cataract surgery or an additional surgery after development of postoperative complications in the same year. We cannot conclusively determine the cause, but considering reports from other countries [4,5,10,12], an increasing bilateral sur- gery rate or reduced interval between binocular surgeries is the likely cause.
This study has several limitations. First, the change in the number of cataract surgeries does not reflect a change in Fig. 4. Ratio of number of operations to number of patients. The
ratio increased over time among the total patient population, male patients, and female patients (Spearman’s rho = 1.000, p < 0.001).
Ratio of the numbers of operations to the number of patients
1.5
1.4 Total
Men Women
1.3
Year
2006 2007 2008 2009 2010 2011 2012
the actual prevalence of cataract. We estimated the inci- dence of actual cataract based on both the number of pa- tients and the number of operations. Second, this study re- lied on data from Statistics Korea that were not subdivided by type of surgery, further limiting analysis. Thus, we could not determine whether the increase in the ratio of number of operations to number of patients was due to an increase in binocular surgery or an increase in secondary surgery due to complications. Third, the statistical data that we used were limited to sex and age, and further analysis of cataract surgery statistics could not be performed. Finally, we did not conduct analyses on trends in the number of operations according to patient motivation, i.e., whether the surgery was driven by patient factors like expectations for improved visual function, by introduction of new healthcare policies, or by factors associated with cataract surgery indications.
Nevertheless, this study contains valuable data that can be used to develop medical systems providing high quality medical services for cataract based on surgery trends from a national-level health insurance database.
The frequency of cataract surgery has increased in Ko- rea, and the absolute proportion of female cases was higher than male cases, while the proportion of male cases increased over the study period. In relatively younger groups, the number of operations increased over 7 years compared to 2006 in men and women, which suggests a decline in the average age of patients who underwent cataract surgery.
The increasing ratio of number of operations to the number of patients during the study period can be presumed to be related to increasing bilateral surgery rates, based on pre- vious reports [4,5,10,12]. Further ophthalmologist study of new medical technologies and development of healthcare policies related to cataract treatment are required to im- prove patient satisfaction and quality of medical services.
Conflict of Interest
No potential conflict of interest relevant to this article was reported
Acknowledgements
This work was supported by grants from University Re- search Park Project of Busan National University (URP)
funded by Busan Institute of S&T Evaluation and Plan- ning.
References
1. Resnikoff S, Pascolini D, Etya’ale D, et al. Global data on vi- sual impairment in the year 2002. Bull World Health Organ 2004;82:844-51.
2. World Health Organization. Prevention of blindness and deaf- ness: global initiative for the elimination of avoidable blind- ness [Internet]. Geneva: World Health Organization; 2000 [cited 2017 Jun 9]. Available from: http://apps.who.int/iris/
bitstream/10665/63748/1/WHO_PBL_97.61_Rev.2.pdf.
3. Taylor HR, Vu HT, Keeffe JE. Visual acuity thresholds for cataract surgery and the changing Australian population.
Arch Ophthalmol 2006;124:1750-3.
4. Behndig A, Montan P, Stenevi U, et al. One million cataract surgeries: Swedish National Cataract Register 1992-2009. J Cataract Refract Surg 2011;37:1539-45.
5. Gollogly HE, Hodge DO, St Sauver JL, Erie JC. Increasing incidence of cataract surgery: population-based study. J Cat- aract Refract Surg 2013;39:1383-9.
6. Murthy GV, Gupta S, Ellwein LB, et al. A population-based eye survey of older adults in a rural district of Rajasthan. I.
Central vision impairment, blindness, and cataract surgery.
Ophthalmology 2001;108:679-85.
7. Dandona L, Dandona R, Naduvilath TJ, et al. Population-based assessment of the outcome of cataract surgery in an urban pop- ulation in southern India. Am J Ophthalmol 1999;127:650-8.
8. Zhang JS, Xu L, Wang YX, et al. Five-year incidence of age- related cataract and cataract surgery in the adult population of greater Beijing: the Beijing Eye Study. Ophthalmology 2011;118:711-8.
9. Keenan T, Rosen P, Yeates D, Goldacre M. Time trends and geographical variation in cataract surgery rates in England:
study of surgical workload. Br J Ophthalmol 2007;91:901-4.
10. Lundstrom M, Stenevi U, Thorburn W. Quality of life after first- and second-eye cataract surgery: five-year data collect- ed by the Swedish National Cataract Register. J Cataract Re- fract Surg 2001;27:1553-9.
11. Tan AC, Tay WT, Zheng YF, et al. The impact of bilateral or unilateral cataract surgery on visual functioning: when does second eye cataract surgery benefit patients? Br J Ophthal- mol 2012;96:846-51.
12. Erie JC, Baratz KH, Hodge DO, et al. Incidence of cataract
surgery from 1980 through 2004: 25-year population-based study. J Cataract Refract Surg 2007;33:1273-7.
13. Rachmiel R, Trope GE, Chipman ML, Buys YM. Cataract surgery rates in Ontario, Canada, from 1992 to 2004: more surgeries with fewer ophthalmologists. Can J Ophthalmol 2007;42:539-42.
14. Rim TH, Lee DM, Chung EJ. Visual acuity and quality of life:
KNHANES IV. J Korean Ophthalmol Soc 2013;54:46-52.
15. Song MH, Kim JW, Chung SK. The statistical observation of ocular injury. J Korean Ophthalmol Soc 2009;50:580-7.
16. Lee JE, Kim SY, Lee SU, Lee SJ. Epidemiological profiles
of industrial ocular injuries. J Korean Ophthalmol Soc 2013;54:136-42.
17. Kim HJ, Park JW, Joo CK. An epidemiological study of the risk factors associated with anterior polar cataract. J Kore- an Ophthalmol Soc 2003;44:606-14.
18. Kim H, Joo CK. The prevalence and demographic charac- teristics of anterior polar cataract in a hospital-based study in Korea. Korean J Ophthalmol 2008;22:77-80.
19. Rim TH, Park SY, Kim TI. Epidemiological survey regard- ing cataract awareness in Korea: KNHANES IV. J Korean Ophthalmol Soc 2013;54:72-7.