• 검색 결과가 없습니다.

Analysis of Factors affecting the Patient’s Service Satisfaction in Kimhae Dental Hospital

N/A
N/A
Protected

Academic year: 2021

Share "Analysis of Factors affecting the Patient’s Service Satisfaction in Kimhae Dental Hospital"

Copied!
10
0
0

로드 중.... (전체 텍스트 보기)

전체 글

(1)

215

Analysis of Factors affecting the Patient’s Service Satisfaction in Kimhae Dental Hospital

Mi Gyung Seong

, Jeong Hee Park, Kyeung Ae Jang and Jung Ok Choi

1

Department of Dental Hygiene, Masan College, Kyungnam 630-729, Korea

1

Depertment of Dental clinic, School of Dentistry, Pusan National University Hopistal 602-739, Korea

김해 치과 의료기관의 치과진료 만족도 요인분석

성미경 ·박정희·장영애·최정옥 1

마산대학 치위생과 , 1부산대학교 치과진료처

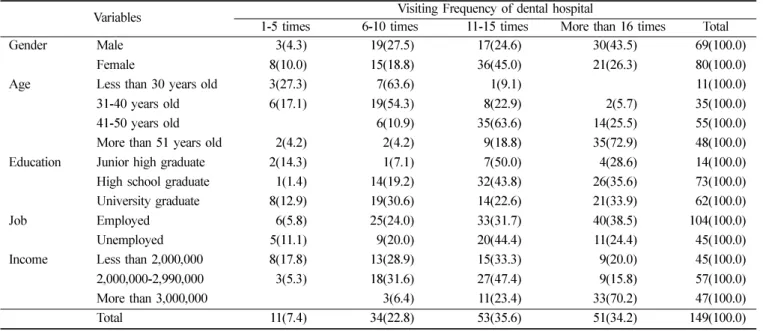
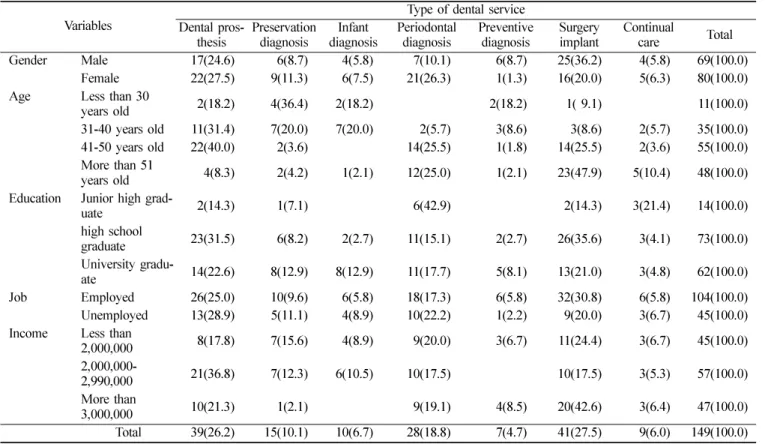
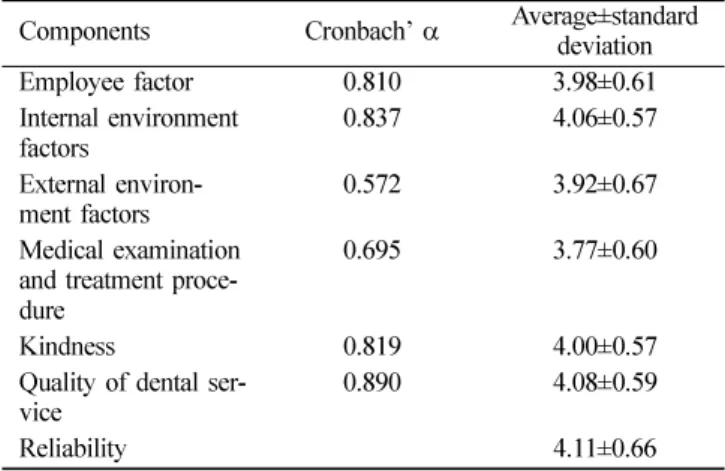
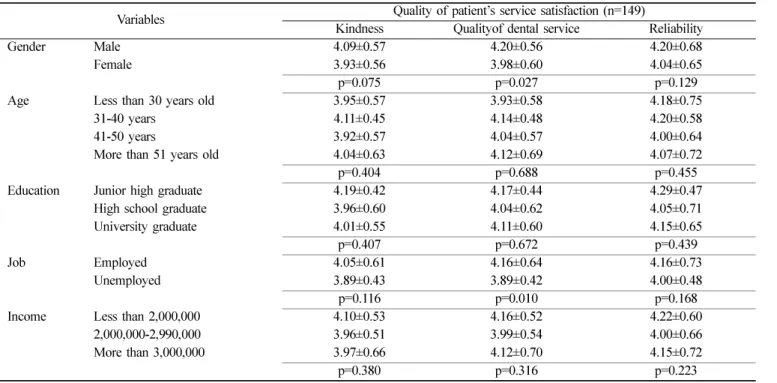
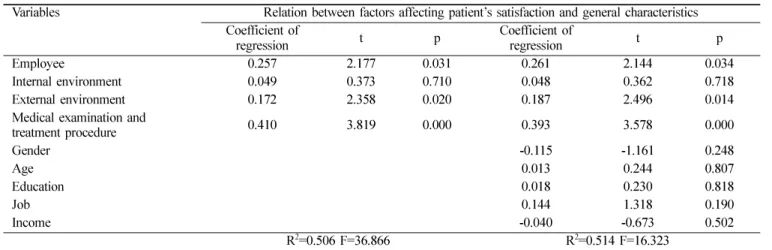
Abstract In order to meet the medical demand according to the changing medical environment and to provide patients with quality dental treatment and improve treating environment by establishing reasonable management plan, with 149 patients for whom continuous dental health program has been applied, the degree of satisfaction with the dental treatment, and the influence factors on the satisfaction were investigated. Using the SPSS Ver. 13.0, mean value analysis were performed on the satisfactions with dental care service and the quality of dental care service according to general characteristics, and regression analysis were performed on the influence of general characteristics and the degree of satisfaction with dental care service on the satisfaction of dental treatment. The result of the multiple regression analysis revealed the human (staff), environment, and the procedure of treatment as the influence factors of the satisfaction with dental treatment. Systematic management and training should be implemented to improve the quality of dental care service and enhance the satisfaction.

Key words Factors, Patient ’ s service satisfaction

Introduction

Recently, the increased awareness of the general pub- lic towards health, and due to the diverse information provided by the mass media, change in the awareness of the medical service’ satisfaction level took place. Com- pared to the past when the patients could not afford to select medical institutions, the medical market grew externally to the point that the patients can now enjoy a wide selection of medical institutions to choose from. As the general medical insurance is implemented, as the cit- izens’ income and education increased and as the citi- zens’ awareness that they are entitled to medical service to safeguard their health increased due to the improved social welfare, which in turn drastically increased the demand for quality medical service, medical service is now considered a product and the patients are now con-

sidered customers

1)

. Therefore, individual dental institu- tions are trying to provide quality medical service as a strategy for securing competitive advantage, and the patients’ satisfaction level is becoming an important medium that significantly affect the results of providing medical service.

Patients’ satisfaction level is the representative index for evaluating the quality of medical service. It pro- vides information on the overall satisfaction level, mutual relationship, medical technology and dentistry results

2-3)

while contributing to the health results at the same time

4-5)

. Use of the medical service and patients’

satisfaction are considered as the relationship and pro- cess of interaction

6)

. Moreover, as the awareness that the patients’ satisfaction is an important factor that deter- mines quality medical service expands, the American Public Health Association defines quality diagnosis as the patients’ satisfaction and satisfaction of the suppliers

7-8)

. Therefore, activities from the patients’ viewpoint are emphasized when it comes to the series of activities that

Corresponding author Tel: 055-230-1282 Fax: 055-230-1278

E-mail: [email protected]

(2)

guarantees quality of medical service that evaluates and improves the quality of medical service. The awareness is such that increasing patients’ satisfaction level is con- sidered important for ensuring repeat visit by the patients and for motivating them to refer the services to their acquaintances. Kim

9)

Suggested kindness of the medical care is the foremost factor that affects patients’

satisfaction level. Lee

10)

reported that the patients’ satis- faction level is higher when the satisfaction level towards the results of treatment is higher.

While Hong et al.

11)

reported that the awareness on the quality of medical service provided by the dentists and dental sanitation specialists when it comes to the over- all quality of medical service tended to be more posi- tive compared to the awareness on the external factors or on the medical examination and treatment procedure.

The authors said that the role of dental sanitation spe- cialists is important to improve the quality of dental ser- vice, and to increase patients’ satisfaction level, willingness to use the service once again, and to refer the service to others. Chung et al.

12)

suggested factors that directly affect willingness to re-use a hospital are expectation level towards a hospital, reliability of the medical cadre, accessibility to the diagnosis, expenses for diagnosis and patients’ satisfaction level whereas the direct factors that influence willingness to refer are expectation level towards a hospital and reliability of the medical cadre, accessibility to the diagnosis, and patients’ satisfaction level. Kasteler

13)

and Dimatteo

14)

said that the quality medical service significantly affect increase in patients’ satisfaction level. Meanwhile, Zifko- Balig and Krampf

15)

said that no matter how accurate a doctor’s diagnosis and treatment may be, if a patient does not feel the affect or feel some kind of discom- fort, then it cannot be said that quality medical service was provided. Moreover, they reported that the quality of medical service is most affected by the standard that the patients evaluate on their own.

It is possible to know that besides the results of den- tal treatment, satisfaction level on the quality of medi- cal service perceived by the patients is also an important element for evaluating the quality of medical service. To this, increasing patients’ satisfaction level when it comes to the dental service is an issue that requires significant attention for the medical policy and hospital manage- ment. Moreover, it is very important in the sense that it is one of the approaches for understanding the quality of medical service.

To improve the quality of medical service, it is neces- sary to address rapid growth and changes in the value system that are taking place these days at the economic and cultural levels. Furthermore, it is necessary to take an interest in the demands made by the patients and how they perceive hospital services to seek out the root causes of their complaints, in order to review, analyze and to make necessary corrections

16)

.

In other words, research on the dental service that is provided by the dental institutions is urgently called for as a measure for increasing the quality of medical ser- vice and the profit of the dental institutions at the dental institutions’ rational management measure level when it comes to the changes taking place in the logic of the sani- tary and medical environment in order to meet the patients’

demands and to address the waves of libe-ralization

17)

. The purpose of this study was to analyze of factors associated with the patient's satisfaction in Kimhae den- tal hospital and to provide the basic data that may bring about quality medical service and improved diagnosis environment appropriate for the dental institutions’ man- agement environment.

Subjects and methods

1. Subjects

This study surveyed based on the individual self- administered questionnaire survey method when it comes to the questionnaires that were distributed to the patients who came for help at the Hospital N located in Kim- hae from July 15 to August 14, 2007. The study targets are the 160 patient’s of the Hospital N who were regis- tered as the patient’s subject to continual oral cavity management who visited the hospital during the above mentioned period. Total of 149 subjects except for the 11 who did not answer at least one question were included in this study.

2. Method

To identify satisfaction level towards dental service,

past research literature was examined to study general

characteristics, patient’s service satisfaction, satisfaction

level on the quality of dental service, willingness to rec-

ommend the dental service to others afterwards and so

forth. Patient’s service satisfaction is comprised of three

questions on the employee factor, four questions on the

internal environment factors, two questions on the exter-

nal environment factors and three questions on the diag-

(3)

nosis procedure. Quality of patient’s service satisfactions comprised of five questions on kindness, five questions on the quality of dental service, and one question on the reliability. Each survey question used the Likert 5 scale measure to organize the findings into; “not very” (1 point), “not” (2 points), “average” (3 points), “yes” (4 points) and “yes very” (5points). And the research studies the willingness to refer the service to others, which is con- sidered one of the outcomes of the patient’s satisfaction.

3. Data analysis method

SPSS Ver 13.0 was used for data analysis, and fre- quency analysis was conducted for the study targets’

general characteristics. Visiting frequency of dental hospital to general characteristics, type of dental ser- vice, and the willingness to refer the service to oth- ers were subjected to the Chi-square test. Factors affecting patient's service satisfaction to general character- istics, and quality of patient ’ s service satisfaction were analyzed using t-test, and one-way ANOVA was used for the average analysis, and multiple regression analysis was conducted to examine the effect of the general characteris- tics and patient’s service satisfaction.

Results

1. General characteristics of subject

46.3% and 53.7% of the study targets were male and female, respectively with greater number of female tar- gets. As for the age groups, less than 30 years old took up 7.4% while 31-40 years old comprised 23.5%, 41-50

years old comprised 36.9%, and more than 51 years old comprised 32.2%. As for the education, those who are junior high school graduates comprise 9.4%, while high school graduates comprise 49.0% and university gradu- ates comprise 41.6%. Employed targets comprise 69.8%, while unemployed people comprise 30.2%. As for the income, less than 2,000,000 comprise 30.2%, 2,000,000- 2,990,000 comprise 38.3% and more than 3,000,000 comprise 31.5% (Table 1).

2. Visiting Frequency of dental hospital to gen- eral characteristics

As for the experience of visiting dentistry by gender, 43.5% of the male targets visited more than 16 times, while 45.0% of the female targets visited 11~15 times.

Table 1. Subject general characteristics

Variable No %

Gender Male 69 46.3

Female 80 53.7

Age Less than 30 years old 11 7.4

31-40 years old 35 23.5

41-50 years old 55 36.9

More than 51 years old 48 32.2

Education Junior high graduate 14 9.4

High school graduate 73 49.0

University graduate 62 41.6

Job Employed 104 69.8

Unemployed 45 30.2

Income Less than 2,000,000 45 30.2

2,000,000-2,990,000 57 38.3

More than 3,000,000 47 31.5

Total 149 100.0

Table 2. Visiting Frequency of dental hospital to general characteristics

Variables Visiting Frequency of dental hospital

1-5 times 6-10 times 11-15 times More than 16 times Total

Gender Male 3(4.3) 19(27.5) 17(24.6) 30(43.5) 69(100.0)

Female 8(10.0) 15(18.8) 36(45.0) 21(26.3) 80(100.0)

Age Less than 30 years old 3(27.3) 7(63.6) 1(9.1) 11(100.0)

31-40 years old 6(17.1) 19(54.3) 8(22.9) 2(5.7) 35(100.0)

41-50 years old 6(10.9) 35(63.6) 14(25.5) 55(100.0)

More than 51 years old 2(4.2) 2(4.2) 9(18.8) 35(72.9) 48(100.0)

Education Junior high graduate 2(14.3) 1(7.1) 7(50.0) 4(28.6) 14(100.0)

High school graduate 1(1.4) 14(19.2) 32(43.8) 26(35.6) 73(100.0)

University graduate 8(12.9) 19(30.6) 14(22.6) 21(33.9) 62(100.0)

Job Employed 6(5.8) 25(24.0) 33(31.7) 40(38.5) 104(100.0)

Unemployed 5(11.1) 9(20.0) 20(44.4) 11(24.4) 45(100.0)

Income Less than 2,000,000 8(17.8) 13(28.9) 15(33.3) 9(20.0) 45(100.0)

2,000,000-2,990,000 3(5.3) 18(31.6) 27(47.4) 9(15.8) 57(100.0)

More than 3,000,000 3(6.4) 11(23.4) 33(70.2) 47(100.0)

Total 11(7.4) 34(22.8) 53(35.6) 51(34.2) 149(100.0)

(4)

As for the age groups, less than 30 years old visited 6- 10 times, 31-40 years old visited 6-10 times, 41-50 years old visited 11-15 times, and more than 51 years old visited more than 16 times. Likewise, visit to den- tist increased with age. As for the education, junior high graduate visited 11-15 times, high school graduates vis- ited 11-15 times and university graduates visited more than 16 times. Likewise, visit to dentist increased with education. People who are employed visited more than 16 times while unemployed people visited 11-15 times.

As for the income, less than 2,000,000 visited 11-15 times, 2,000,000-2,990,000 visited 11-15 times, and more than 3,000,000 visited more than 16 times. Like- wise, visit to dentist increased with income (Table 2).

3. Type of dental service to general charac- teristics

When the type of dental service depending on gender is examined, male targets sought after surgery implant (36.2%), dental prosthesis (24.6%), and periodontal diag- nosis (10.1%) while female targets sought after dental prosthesis (27.5%), periodontal diagnosis (26.3%) and surgery implant (20.0%). As for the age, less than 30 years old sought mostly after the preservation diagnosis with 36.4% while 30-40 years old pursued after dental

prosthesis, 41-50 years old pursued after dental prosthe- sis, and more than 51 years old pursued after surgery implant with 47.9%. As for the education, junior high graduates pursued after periodontal diagnosis with 42.9%, high school graduates pursued after surgery implant with 35.6% and university graduates pursued after dental prosthesis with 22.6%. Employed targets pursued after surgery implant with 30.8% while unem- ployed targets pursued mostly after dental prosthesis with 28.9%. As for the income, less than 2,000,000 pur- sued mostly after surgery implant with 24.4%, 2,000,000-2,990,000 pursued mostly after dental prosthe- sis with 36.8% and more than 3,000,000 pursued mostly after surgery implant with42.6% (Table 3).

4. Reliability of factors affecting patient s satis- faction

Table 4 demonstrates the results of analyzing reliabil- ity level by factors affecting patient’s satisfaction When each survey component is examined, reliability level was highest for the quality of dental service with 0.890 while reliability level for the external environment factors was the lowest with 0.572. As for the patient's service satis- faction, reliability was the highest with 4.11, followed by the quality of dental service with 4.08 and internal

Table 3. Type of dental service to general characteristics

Variables Type of dental service

Dental pros-

thesis Preservation

diagnosis Infant

diagnosis Periodontal

diagnosis Preventive

diagnosis Surgery

implant Continual

care Total

Gender Male 17(24.6) 6(8.7) 4(5.8) 7(10.1) 6(8.7) 25(36.2) 4(5.8) 69(100.0)

Female 22(27.5) 9(11.3) 6(7.5) 21(26.3) 1(1.3) 16(20.0) 5(6.3) 80(100.0)

Age Less than 30

years old 2(18.2) 4(36.4) 2(18.2) 2(18.2) 1( 9.1) 11(100.0)

31-40 years old 11(31.4) 7(20.0) 7(20.0) 2(5.7) 3(8.6) 3(8.6) 2(5.7) 35(100.0)

41-50 years old 22(40.0) 2(3.6) 14(25.5) 1(1.8) 14(25.5) 2(3.6) 55(100.0)

More than 51

years old 4(8.3) 2(4.2) 1(2.1) 12(25.0) 1(2.1) 23(47.9) 5(10.4) 48(100.0)

Education Junior high grad-

uate 2(14.3) 1(7.1) 6(42.9) 2(14.3) 3(21.4) 14(100.0)

high school

graduate 23(31.5) 6(8.2) 2(2.7) 11(15.1) 2(2.7) 26(35.6) 3(4.1) 73(100.0)

University gradu-

ate 14(22.6) 8(12.9) 8(12.9) 11(17.7) 5(8.1) 13(21.0) 3(4.8) 62(100.0)

Job Employed 26(25.0) 10(9.6) 6(5.8) 18(17.3) 6(5.8) 32(30.8) 6(5.8) 104(100.0)

Unemployed 13(28.9) 5(11.1) 4(8.9) 10(22.2) 1(2.2) 9(20.0) 3(6.7) 45(100.0) Income Less than

2,000,000 8(17.8) 7(15.6) 4(8.9) 9(20.0) 3(6.7) 11(24.4) 3(6.7) 45(100.0)

2,000,000-

2,990,000 21(36.8) 7(12.3) 6(10.5) 10(17.5) 10(17.5) 3(5.3) 57(100.0)

More than

3,000,000 10(21.3) 1(2.1) 9(19.1) 4(8.5) 20(42.6) 3(6.4) 47(100.0)

Total 39(26.2) 15(10.1) 10(6.7) 28(18.8) 7(4.7) 41(27.5) 9(6.0) 149(100.0)

(5)

environment factors with 4.06. Satisfaction level on the medical examination and treatment procedure was the lowest with 3.77.

5. Factors affecting patient s service satisfac- tion to general characteristics

Gender patient’s service satisfaction was manifested the highest among the male targets when it comes to the employee factor, internal environment factors, external environment factors and medical examination and treat- ment procedure. As for the satisfaction level towards employee factor, it was 4.13 in male targets, which is significantly higher than that of the female with 3.86

(p < 0.05). Satisfaction level towards medical examina- tion and treatment procedure was 3.88 when it comes to male targets, which is also statistically significant increase compared to the female targets with 3.68 (p < 0.05). As for the patient’s service satisfaction by age, satisfaction level for the employee factor, internal environment factors, external environment factors, and medical examination and treatment procedure was high for the 31-40 year olds. As for the education, satisfac- tion level for the employee factor, internal environment factors, and medical examination and treatment proce- dure except for the external environment factors when it comes to the low education (junior high graduate) was high. Compared to the unemployed targets, the employed targets manifested higher satisfaction level for the employee factor, internal environment factors, exter- nal environment factors, and medical examination and treatment procedure. As for the employee factor, people who are employed manifested statistically significant dif- ference compared to the unemployed targets (3.83) with 4.05 (p < 0.05). As for the patient’s service satisfaction by income, less than 2,000,000 manifested high satisfac- tion level when it comes to the internal environment factors, external environment factors, and medical exam- ination and treatment procedure except for the employee factor (Table 5).

Table 4. Reliability of factors affecting patient’s satisfaction Components Cronbach’ α Average±standard

deviation

Employee factor 0.810 3.98±0.61

Internal environment

factors 0.837 4.06±0.57

External environ-

ment factors 0.572 3.92±0.67

Medical examination and treatment proce- dure

0.695 3.77±0.60

Kindness 0.819 4.00±0.57

Quality of dental ser-

vice 0.890 4.08±0.59

Reliability 4.11±0.66

Table 5. Factors affecting patient’s service satisfaction to general characteristics Variables

Patient’s service satisfaction (n=149) Employee factor Internal environment

factors External environment

factors Medical examination and treatment

procedure

Gender Male 4.13±0.60 4.15±0.58 3.97±0.71 3.88±0.62

Female 3.86±3.86 3.99±0.56 3.89±0.64 3.68±0.57

p=0.007 p=0.093 p=0.486 p=0.036

Age Less than 30 years old 3.91±0.47 3.93±0.59 3.82±0.68 3.79±0.48

31-40 years 4.09±0.48 4.16±0.43 4.11±0.67 3.86±0.47

41-50 years 3.84±0.65 3.99±0.57 3.90±0.65 3.68±0.64

More than 51 years old 4.08±0.64 4.11±0.66 3.85±0.70 3.82±0.66

p=0.140 p=0.411 p=0.304 p=0.505

Education Junior high graduate 4.19±0.45 4.13±0.44 3.71±0.51 3.83±0.55

High school graduate 3.92±0.65 4.04±0.59 3.96±0.72 3.79±0.66

University graduate 4.01±0.58 4.08±0.58 3.94±0.65 3.74±0.54

p=0.271 p=0.835 p=0.453 p=0.793

Job Employed 4.05±0.65 4.12±0.62 4.00±0.66 3.82±0.64

Unemployed 3.83±0.45 3.94±0.43 3.78±0.69 3.67±0.49

p=0.043 p=0.094 p=0.070 p=0.149

Income Less than 2,000,000 4.01±0.79 4.15±0.49 3.99±0.66 3.84±0.55

2,000,000-2,990,000 3.87±0.59 3.94±0.54 3.88±0.70 3.73±0.60

More than 3,000,000 4.09±0.70 4.13±0.67 3.94±0.66 3.76±0.64

p=0.149 p=0.126 p=0.708 p=0.624

p- value by t-test or ANOVA

(6)

6. Quality of patient s service satisfaction by general characteristics

As for the gender satisfaction level on the quality of dental service, kindness, quality of dental service and reliability were high in the male targets. Quality of den- tal service for the male targets was 4.20, which is sig- nificantly higher than that of the female with 3.98 (p < 0.05). As for the age, satisfaction level for the kind- ness, quality of dental service and reliability was high among 31-40 year olds. As for the education, satisfac- tion level towards kindness, quality of dental service and reliability was highest among junior high graduates com- pared to those from other age groups. Compared with the unemployed, satisfaction level of the people who are employed was relatively higher. As for the quality of dental service, there was statistically significant differ- ence among the people who are employed (4.16) and people who are unemployed (3.89) (p < 0.05). As for the income, satisfaction level towards kindness, quality of dental service and reliability was high among the peo- ple with less than 2,000,000 (Table 6).

7. Recommendation thought to general charac- teristics

As for the percentage of the targets who replied that they willing to refer the service to others after the den- tal care, 46.9% and 53.1% of the male and female tar-

gets, respectively, said yes. As for the age group, 41~50 year olds were the highest with 37.4% while less than 30 year olds took up the lowest with 7.5%. As for the education, high school graduates comprised 49.0%, uni- versity graduates comprised 42.2% and junior high grad- uates comprised 8.8%. People who are employed comprised 70.1%, which is higher than that of the unemployed targets with 29.9%. As for the income, 38.8%, 32.0% and 29.3% of the 2,000,000~2,990,000, more than 3,000,000 and less than 2,000,000 said yes, respectively (Table 7).

8. Relation between factors affecting patient s satisfaction and general characteristics

Multiple regression was conducted to identify the effect of each general characteristics and factors affect- ing patient’s satisfaction and general characteristics.

Patient’s satisfaction was set as a dependant variable while employee factor, internal environment factors, external environment factors and medical examination and treatment procedure were set as independent vari- ables. The independent variables explained 50.6% of the patient's satisfaction. When the satisfaction level for the employee factor is higher, when the satisfaction level for the internal environment factors is higher, when the sat- isfaction level on the external environment factors is higher, and when the satisfaction level for the medical

Table 6. Quality of patient’s service satisfaction to general characteristics

Variables Quality of patient’s service satisfaction (n=149)

Kindness Qualityof dental service Reliability

Gender Male 4.09±0.57 4.20±0.56 4.20±0.68

Female 3.93±0.56 3.98±0.60 4.04±0.65

p=0.075 p=0.027 p=0.129

Age Less than 30 years old 3.95±0.57 3.93±0.58 4.18±0.75

31-40 years 4.11±0.45 4.14±0.48 4.20±0.58

41-50 years 3.92±0.57 4.04±0.57 4.00±0.64

More than 51 years old 4.04±0.63 4.12±0.69 4.07±0.72

p=0.404 p=0.688 p=0.455

Education Junior high graduate 4.19±0.42 4.17±0.44 4.29±0.47

High school graduate 3.96±0.60 4.04±0.62 4.05±0.71

University graduate 4.01±0.55 4.11±0.60 4.15±0.65

p=0.407 p=0.672 p=0.439

Job Employed 4.05±0.61 4.16±0.64 4.16±0.73

Unemployed 3.89±0.43 3.89±0.42 4.00±0.48

p=0.116 p=0.010 p=0.168

Income Less than 2,000,000 4.10±0.53 4.16±0.52 4.22±0.60

2,000,000-2,990,000 3.96±0.51 3.99±0.54 4.00±0.66

More than 3,000,000 3.97±0.66 4.12±0.70 4.15±0.72

p=0.380 p=0.316 p=0.223

p- value by t-test or ANOVA

(7)

examination and treatment procedure is higher, satisfac- tion level towards dental service was higher. Employee factor, external environment factors, and medical exami- nation and treatment procedure were the variables that significantly affected patient’s satisfaction (p < 0.05).

When the general characteristics were added on as inde- pendent variables, the model’s ability to explain was 51.4%. When the satisfaction level for the employee fac- tor, internal environment factors, external environment factors, and medical examination and treatment proce- dure was higher, patient’s satisfaction was higher in male, employedand lower income. As for the employee

factor, external environment factors, and medical exami- nation and treatment procedure, they were variables that affected patient's satisfaction (p < 0.05)(Table 8).

Discussion

The Korean medical institutions entered into the age of unlimited competition due to the large companies’

entry into the hospital business, allowance of hospi- tals’pursuit of profit, introduction of private medical insurance, and the WHO’s pressure on the liberalization of the medical industry

18)

. In the past, medical service

Table 7. Recommendation thought to general characteristics

Variables Recommendation thought

Yes No Total

Gender Male 69(46.9) 69(46.3)

Female 78(53.1) 2(100.0) 80(53.7)

p=0.186

Age Less than 30 years old 11( 7.5) 11( 7.4)

31-40 years 34(23.1) 1(50.0) 35(23.5)

41-50 years 55(37.4) 55(36.9)

More than 51 years old 47(32.0) 1(50.0) 48(32.2)

p=0.636

Education Junior high graduate 13( 8.8) 1(50.0) 14( 9.4)

High school graduate 72(49.0) 1(50.0) 73(49.0)

University graduate 62(42.2) 62(41.6)

p=0.111

Job Employed 103(70.1) 1(50.0) 104(69.8)

Unemployed 44(29.9) 1(50.0) 45(30.2)

p=0.539

Income Less than 2,000,000 43(29.3) 2(100.0) 45(30.2)

Level 2,000,000-2,990,000 57(38.8) 57(38.3)

More than 3,000,000 47(32.0) 47(31.5)

p=0.096

Total 147(100.0) 2(100.0) 149(100.0)

p- value by t-test or ANOVA

Table 8. Relation between factors affecting patient’s satisfaction and general characteristics

Variables Relation between factors affecting patient’s satisfaction and general characteristics Coefficient of

regression t p Coefficient of

regression t p

Employee 0.257 2.177 0.031 0.261 2.144 0.034

Internal environment 0.049 0.373 0.710 0.048 0.362 0.718

External environment 0.172 2.358 0.020 0.187 2.496 0.014

Medical examination and

treatment procedure 0.410 3.819 0.000 0.393 3.578 0.000

Gender -0.115 -1.161 0.248

Age 0.013 0.244 0.807

Education 0.018 0.230 0.818

Job 0.144 1.318 0.190

Income -0.040 -0.673 0.502

R

2

=0.506 F=36.866 R

2

=0.514 F=16.323

(8)

was centered on the suppliers. Today, however, the ser- vice is centered on the consumers’ viewpoint as the con- sumer demands became increasingly diverse and high end as the competition among the medical institutions increased. Moreover, as the quality of the medical ser- vice perceived by the patients became the center of attention, there is a need to determine how the quality of medical service affects the satisfaction level and repeat use from the strategic point of view.

This study targeted 149 patients who continue to use a dentist located in Kimhae. The proven survey questions were re-configured to suit this study.

When the visiting Frequency of dental hospital to gen- eral characteristics is examined, visiting Frequency of dental hospital increased with higher age, education and income. As for the type of the dental service, male tar- gets pursued mostly after surgery implant diagnosis while female targets pursued mostly after dental prosthe- sis diagnosis. As for the age group, surgery implant was highest among the targets that are more than 51 years old. Employed targets and those with higher education tended to purse after surgery implant and dental prosthe- sis diagnosis. As for the income, more than 3,000,000 pursued the surgery implant diagnosis the most. As for the reliability level for each factors affecting patient’s satisfaction and general characteristics, more than 0.5 results, which indicates that the reliability level is high.

As for the quality of the dental service, Cronbach’ a coefficient was the highest with 0.890, followed by internal environment factor and kindness, in this order, and the external environment factor was the lowest with 0.572. As for the satisfaction level for the dental ser- vice, satisfaction level for the employee factor mani- fested significant difference in the male targets who are employed (p < 0.05)and the satisfaction level of the male targets was higher than that of the female targets when it comes to the medical examination and treatment pro- cedure (p < 0.05). This is similar to the factors showed in a study

19)

that studied the factors that affect patients’satisfaction level, which showed dentist factor, medical examination and treatment procedure and standby time factor and internal environment factorsin this order, which is somewhat different from the Kim’s study

20)

that showed the factors as the internal environ- ment factor, medical examination and treatment proce- dure, standby time and dentist factor. In this study, maletargets manifested significant difference (p < 0.05) in the order of the employee factor, quality of medical ser-

vice, and medical examination and treatment procedure, which shows that they are more sensitive to the employee attitude, quality of medical service, and medi- cal examination and treatment procedure. Moreover, the fact that the satisfaction level among the people who are employed is high in the order of the quality of medical service and employee factor shows that the people who paid higher price for diagnosis want better service.

When the satisfaction level and the willingness to refer to others are examined, there is a relationship between satisfaction level and revisting and recommendation thought when the age, education and income are higher both for the male and female, and they are employed.

Because of the concept that involves the relationship and value pertaining to the quality of medical service and satisfaction level, and repeat use was mostly focused on the relationship among service quality and satisfac- tion level (service quality-satisfaction level), service quality and repeat use (service quality-repeat use), qual- ity of medical service and satisfaction level, and repeat use (service quality-satisfaction level-repeat use), there are reported made that the expenses paid out to acquire service need to factored in as well

21)

.

Lee

22)

reported that the dental patients’ satisfaction level affects referral by the willingness to use the ser- vice again, and reported that the level of specialty and the kindness directly influence satisfaction level. Choi et al.

23)

suggested that the quality of medical service influ- ences satisfaction level, service value, and the willing- ness to use the service again, and the quality of the medical service perceived by patients directly affects willingness to use the service again. Sohn et al.

24)

sug- gested that the satisfaction level is high when the qual- ity of medical service, accessibility, pain control, and trust on the cost are high. Kim

20)

reported that the inter- nal environment factor is the index that is useful for forecasting patients’ satisfaction leveland value of ser- vice. As for the most useful indices for forecasting ser- vice value are the medical examination and treatment procedure and standby time, according to him. This study too concluded that the quality of medical service directly affects the willingness to use the service again, and the willingness to refer the service to others.

When the multiple regression was conducted to iden-

tify relation between factors affecting patient's satisfac-

tion and general characteristics, patient’s satisfaction was

high when the satisfaction level towards the employee

factor, external environment factors and medical exami-

(9)

nation and treatment procedure was high (p < 0.05).

Hong

11)

showed dental service, medical examination and treatment procedure and internal environment as the fac- tors that significantly affected the willingness to use the service again, while Song

25)

citied dentists, dental sanita- tion specialists, medical examination and treatment pro- cedure and diagnosis cost as the factors that affect satisfaction level after receiving dental service. This is in line with a finding of this study that the employee fac- tor, and medical examination and treatment procedure significantly affect patient's satisfaction.

This study may be limited compared to other previ- ous studies conducted that studied various regions, and various medical institutions when it comes to the sur- vey on the overall satisfaction level of the people who use dental service, their willingness to use the service again and their willingness to refer the service to oth- ers. Meanwhile, this study limits the study at one partic- ular hospital, which prevents application of the findings to other medical institutions. Because survey was con- ducted on the patients who are receiving dental care, evaluation may be higher than other general public.

Despite these limitations, however, this study is signifi- cant in the sense that it analyzed the factors that are related to the patient’s satisfaction level for the medical service improvement and change in the revisting and recommendation thought to provide basic data that would enable evaluate the patient’s satisfaction of the oral cavity management targets continuously. Therefore, other researches that evaluate dental diagnosis satisfac- tion level and service quality are needed.

Summary

The purpose of this study is to provide basic data for the provision of quality dental service that suits the hos- pital management environment and for the improvement of the diagnosis environment by studying the factors that affect diagnosis satisfaction level after receiving dental service when it comes to the patients who are continu- ing to receive oral cavity management and by studying the willingness to refer the service to others. Therefore, the study was conducted for the 149 patients of a den- tal hospital in Kimhae who are receiving oral cavity management from July 15 to August 14, 2007.

1. In the patient’s service satisfaction, employee fac- tor, internal environment factors, external environ- ment factors, and medical examination and

treatment procedure were manifested higher in male than female, and the employee factor and medical examination and treatment procedure mani- fested increasingly significant difference in male than female (p < 0.05), and significant increase was manifested in the employed compared to the unem- ployed (p < 0.05).

2. As for the satisfaction level on the quality of den- tal service, satisfaction level was higher in male than female, and in the employed than unem- ployed (p < 0.05).

3. As result of conducting multiple regression analy- sis with the diagnosis satisfaction level as the dependant variable, satisfaction level towards den- tal service was higher when the satisfaction level for the employee factor is higher, when the satis- faction level for the external environment is higher, and when the satisfaction level for the medical examination and treatment procedure is higher (p < 0.05).

In conclusion, structured employee management and training are required to improve quality of medical ser- vice, patients’ satisfaction level and their willingness to refer the service to others, and there is a need to pur- sue after the direction that can provide greater conve- niences to the patient diagnosis, and to minimize inconveniences.

요 약

보건의료환경 변화에 따른 환자들의 의료수요에 부응하 고 합리적인 경영대책을 마련하여 환자들에게 양질의 치 과의료서비스를 제공하고 진료환경을 개선시킬 목적으로 계속구강건강관리 환자 149 명을 대상으로 치과의료서비 스를 제공 받은 후의 진료 만족도와 진료만족도에 영향을 미치는 요인을 파악하였다 . SPSS Ver 13.0 을 이용하여 일반적 특성에 따른 치과의료서비스 만족도 , 치과의료서 비스의 질에 대한 만족도는 평균분석을 하였고 , 일반적 특성 및 치과의료서비스 만족도가 치과진료 만족도에 미 치는 영향은 회귀분석을 하였다 . 다중회귀분석에서 치과 진료 만족도에 영향을 미치는 요인은 직원요인 , 외부환경 요인 , 진료절차였다 . 치과의료 서비스의 질을 향상시키고 환자의 만족도를 높이기 위해서는 직원들의 체계적인 관 리 및 교육이 이루어져야 할 것이다 .

References

1. Yu SU: Theory and Actuality of Hospital Management.

Sumunsa, pp.15-20, 1998.

(10)

2. Donabedian A: The quality of care - How can it be assessed.

JAMA, 260(12): 1743-1748, 1988.

3. Donabedian A: The role of outcome in quality assessment and assurance. Quality Rev Bull 18(11): 356-360, 1992.

4. Ford RC, Bach SA, Fottler MD: Methods of measuring patient satisfaction in health-care organization. Health Care Manage Rev 22(2): 74-89, 1997.

5. Corah NL, O' Shea RM, Pace LF, Seyrek SK: Developmalet of a patient measure of satisfaction with the dentist - the dental visit satisfaction scale. J Behar Med 7(3): 367-373, 1984.

6. Zastowny TR, Roghmann KL, Henst A: A satisfaction with medical care: Replications and theoretic reevaluation. Med Care 21: 294-322, 1983.

7. Vuori HV: Quality assurance of health service: Concepts and methodology. : WHO, 1982.

8. Steiber SR: How consumer perceive health care quality.

Hospitals 5: 84, 1988.

9. Kim BJ: Factors that Determine Patients’ Satisfaction Level towards the Medical Services Provided at the Asian Medicine Hospital. Daegu Haany University, Graduate School of Public Health, Master’s Thesis, 1995.

10. Lee SH: Factors that Affect Dental Patients’ Satisfaction Level. Injae University, Graduate School of Public Health, Master’s Thesis, 1998.

11. Hong YS, Choi YH, Ji YG, Lee SG, Kwon HJ: Influence of the Quality of the Dental Sanitation Specialists’ Medical Service on the Patients’ Satisfaction Level. J Korean Acad Dent Health 30(2): 130-140, 2006.

12. Chung SH, Kim JY, Lee WG, Sohn EY, Choi YH, Song GB:

Changes in the Characteristics and Satisfaction Level of the Patients at the Kyungpook National University’s Dentistry. J Korean Acad Dent Health 28(2): 235-247, 2004.

13. Kasteler H: Issues underlying prevalence of doctor-shopping behavior. J Health Soc Behav 17(4): 328-329, 1976.

14. Dimatt MR, Prince LM, Haranta A: Patient perceptions of physicians’ behavior, determinants of patient commitmalet to the therapeutic relationship. J Community Health 16(4): 280- 290, 1979.

15. Zifko-Baling GM, Krampf RF: Managing perceptions of hospital quality: negative emotional evaluations can

undermine even the best clinical quality. Mark Health Serv 17(1): 28-35, 1997.

16. Jang HS: Analysis hospital service for elderly inpatients. J of oriental Medicine 7(1): 18-31, 2000.

17. Lee ES, Park JR, Choi MS: Factors that Affect Patients’s Satisfaction Level towards Dental Service. J Dent Hyg Edu 5(2): 247-260, 2005.

18. Chung GT: Medical Market Liberalization and Need for Active Measures to Embrance the Changes. Journal of Preventive Medicine 37(1): 1-5, 2004.

19. Han SJ: Study of the patients’ satisfaction level for the dental clinic’s dental service. Dankook University Graduate School of Administration , Master’s Thesis, 1999.

20. Kim JS: Influence of the dental service quality for each factor on the patients’ satisfaction level and service value. Interview result. Health Care Manage Rev 23(4): 81-96, 1998.

21. Lee HS, Kim Y: Service quality and service value. Journal of Korean Marketing 1(2): 77-99, 1999.

22. Lee MS: Influence of the dental service’s quality on the patients’ satisfaction level, and the relationship of the patients’ satisfaction level and willingness to use the service again, and to refer by the word of the mouth. Kyunghee University Graduate School of Management, Master’s Thesis, 2005.

23. Choi GS, Cho WH, Lee SH, Nam JM: Analysis of the Structure among the quality of medical service perceived by patients, satisfaction level, service value, and the willingness to use the service again. Journal of Preventive Medicine 33(4): 426-435, 2000.

24. Sohn JL, Kwon HG: Research on the patients’ satisfaction level at the Yonsei University Dentistry: Reliability Level and Viability Level of the Dental Satisfaction Questionnaire(DSQ).

J Korean Acad Dent Health 25(2): 123-138, 2001.

25. Song GS: Research on the patients’ satisfaction level for the dental service in northern Jeonra Province. Wonkwang University Graduate School of Public Health and Environment Master’s Thesis, 2002.

(Received July 21, 2008; Accepted November 2, 2008)

수치

Table 2.  Visiting Frequency of dental hospital to general characteristics
Table 4 demonstrates the results of analyzing reliabil- reliabil-ity level by factors affecting patient’s satisfaction When each survey component is examined, reliability level was highest for the quality of dental service with 0.890 while reliability leve
Table 4.  Reliability of factors affecting patient’s satisfaction Components Cronbach’  α Average±standard
Table 6.  Quality of patient’s service satisfaction to general characteristics
+2

참조

관련 문서

Further studies should be performed to identity the related factors with the quality of home care service and educational program should be developed to

Sixth, the influence of sports confidence and s chool satisfaction according to participation showed significant differences i n satisfaction, class

The purpose of this study is to identify how the Customer Satisfaction (CS) policy affects the employees'level of stress and satisfaction, and to minimize the

Objective: The purpose of this study was to investigate the effect of clinical practice satisfaction on professional self-concept among dental hygiene students.. Methods:

Sixth, the analysis of differences in living satisfaction according to the frequency of exercise of participants through living sports showed that there

The purpose of this study is to analyze the effects of service quality on customer satisfaction and revisit intention perceived by Chinese golf range

Measurement of proximal contact tightness between the left first molar and second molar(dental implant) in the mandible... Clinical dental anatomy, histology,

This study is an analysis of distribution of patient who installed Endopore Ⓡ at maxilla in Chosun University Dental hospital and types of implant for about 4