Ⅰ. Introduction
In this paper, we will discuss image recognition by applying the MNIST handwritten digits dataset.
When we begin to learn Deep Learning, we realize that one of the most powerful supervised deep learning techniques is the Convolutional Neural Networks (CNNs), which have demonstrated significant improvements over traditional approaches in many pattern recognition tasks [1]. When we utilize CNNs for classification by MNIST, the accuracy is mostly high between 99.1% and 99.6%
on the validation in uncomplicated network architectures. Because MNIST is easy to train, it
* corresponding author
has one channel or the background of MNIST is only black color, lastly, the main cause is the digits are located on the center. However, when digits are shifted from the center, the results become worse.
This issue is also an intricacy for CNNs. To deal with that issue, we transformed spatial images into frequency images. To create frequency images, we used the Fast Fourier Transform (FFT). The reason why we used FFT in our work is that FFT produces mostly the same frequency images, that means if digits in MNIST dataset are not placed center or digits are shifted from the center, this will not be an issue for FFT. Unfortunately, using frequency dataset couldn't provide the best results in character recognition. To compare spatial and frequency image datasets, we shifted digits from the
문자인식을 위한 공간 및 주파수 도메인 영상의 비교
Abduraimjonov Abdurakhmon · 최현영 · 고재필
* 금오공과대학교Comparison of Spatial and Frequency Images for Character Recognition
Abduraimjonov Abdurakhmon · Hyeon-yeong Choi · Jaepil Ko
* Kumoh National Institute of TechnologyE-mail : [email protected] / [email protected] / [email protected]
요 약
딥러닝은 객체인식 분야에서에서 강력하고, 강건한 학습 알고리즘이다. 딥러닝에서 자주 활용되고, 객체인식 분야에서 최고의 성능을 보여주는 네트워크는 Convolutional Neural Network(CNN) 이다. 숫자 필기 인식을 위한 MNIST 데이터셋를 CNN으로 학습하면 성능이 매우 뛰어나다. 이는 MNIST 데이터 셋의 숫자들이 중앙에 잘 정렬되어 있기 때문이다. 하지만, 실제 데이터들은 중앙에 정렬이 잘 되어있 지 않다. 이러한 경우에 CNN은 이전과 같이 우수한 성능을 보여주지 못한다. 이를 해결하기 위해, 우 리는 FFT를 활용하여 이미지를 주파수 공간으로 변환하여 입력으로 주는 방법을 제안한다.
ABSTRACT
Deep learning has become a powerful and robust algorithm in Artificial Intelligence. One of the most impressive forms of Deep learning tools is that of the Convolutional Neural Networks (CNN). CNN is a state-of-the-art solution for object recognition. For instance when we utilize CNN with MNIST handwritten digital dataset, mostly the result is well. Because, in MNIST dataset, all digits are centralized. Unfortunately, the real world is different from our imagination. If digits are shifted from the center, it becomes a big issue for CNN to recognize and provide result like before. To solve that issue, we have created frequency images from spatial images by a Fast Fourier Transform (FFT).
키워드
Deep Learning, Image Recognition, Convolutional Neural Network, Fast Fourier Transform
439
한국정보통신학회 2019년 춘계 종합학술대회 논문집 center for 9 different positions, (shown Figure 1).
Figure 1. Ten kinds of conditions of Spatial and Frequency images. Spatial images are on the top side, and Frequency is on the bottom side.
x is horizontal and y is veritical shifting values.
Ⅱ. Theory
This section, you will be informed about pre-processing the dataset and how to build a network model.
Pre-processing: After called MNIST handwritten digits dataset[2], it was divided training (60000 examples) and testing (10000), then, the data type of them were converted to float32 type. Next, we changed the position of digits in the images for 9 areas. Shortly, we shifted digits from the center (shown the top of Figure 1), by using Numpy and OpenCV libraries. Table 1 and Table 2 show shifting values, x is horizontal shifting and y is vertical shifting. Fast Fourier Transform generates spatial (original) images into frequency images by numpy.fft.fft2() which computes the 2-dimensional Discrete Fourier Transform[3] or transforms 2-dimensional spatial image to 2-dimensional frequency image. By using FFT, we found 10 kinds of frequency images (shown bottom of Figure 1) from 10 kinds of spatial images.
Network model: We established the same network model for spatial and frequency image datasets. We used the Keras framework by Tensorflow backend to build network model. We created a model by Sequential. After that, Conv2D, MaxPool2D, Dropout, Flatten and Dense are applied for model layers. Built network architecture is shown below Figure 2:
Figure 2. The Network architecture. In a), input is spatial image and in b) frequency image is input to network model.
Adamax(lr=0.002) was applied as an optimization method, and the loss function was categorical_cross entropy to compile the model.
Ⅲ. Experiments
The total of 75 epochs was used for the train by the network model. We mention that this paper is t he competition between spatial and frequency image datasets, we compared the accuracy result and loss result of them for 10 different conditions are shown (Table 1 and Table 2). We provided the results of Validation Accuracy and Validation Loss on these t ables. Because of Validation result is more importan t rather than Training result.
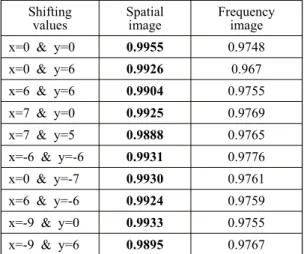
Table 1. Validation (Test) accuracy of Spatial and Frequency images.
Shifting
values Spatial
image Frequency image x=0 & y=0 0.9955 0.9748 x=0 & y=6 0.9926 0.967 x=6 & y=6 0.9904 0.9755 x=7 & y=0 0.9925 0.9769 x=7 & y=5 0.9888 0.9765 x=-6 & y=-6 0.9931 0.9776 x=0 & y=-7 0.9930 0.9761 x=6 & y=-6 0.9924 0.9759 x=-9 & y=0 0.9933 0.9755 x=-9 & y=6 0.9895 0.9767
By viewing again Table 1, you may realize that the spatial images dataset reached 100% better accu racy rather than frequency images dataset.
Table 2. Validation (Test) accuracy of Spatial and F requency images.
Shifting
values Spatial
image Frequency image
x=0 & y=0 0.0191 0.0795
x=0 & y=6 0.0340 0.114
x=6 & y=6 0.0411 0.0828
x=7 & y=0 0.0307 0.0757
x=7 & y=5 0.046 0.0766
x=-6 & y=-6 0.0262 0.0796
x=0 & y=-7 0.0270 0.0791
x=6 & y=-6 0.0343 0.0798
x=-9 & y=0 0.0315 0.0777
x=-9 & y=6 0.0426 0.0761
440
한국정보통신학회 2019년 춘계 종합학술대회 논문집
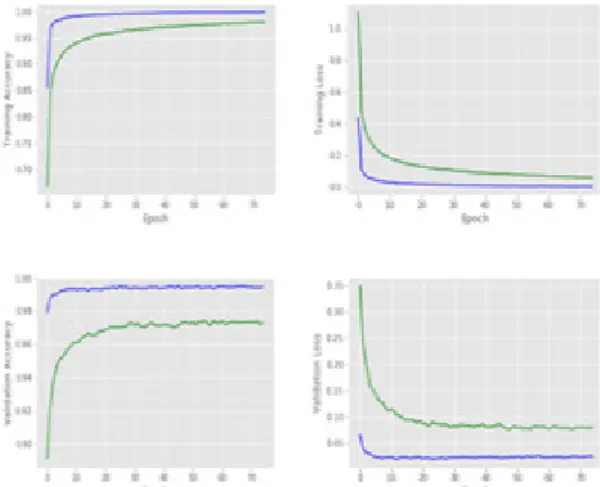
In Figure 3, you may perceive clearly differences between Spatial (blue line) and frequency (green lin e) image datasets. Horizontal and vertical shifting v alues are x=7 and y=5 respectively in Figure 3. For x=7 and y=5 conditions, doubtless, the spatial imag es dataset succeeded efficient results than frequency images dataset on Accuracy and Loss of Training a nd Validation. Lastly, by seeing Table 2, you comp rehend that spatial images dataset achieved lower lo ss on Validation than frequency images dataset.
Figure 3. Accuracy and Loss result of Training and Validation for the condition of x=7 and y=5.
100% best results of Spatial images dataset.
Ⅳ. Conclusion
To sum up, we wanted to present a new method which transforming spatial images to frequency ima ges for decentralized digits in the MNIST dataset.
We utilized Fast Fourier Transform (FFT) for transf orming spatial images to frequency images. Because FFT can produce almost the same frequency images for centralized and decentralized digits in the MNIS T dataset. We changed the location of digits for 9 different conditions. You have seen frequency image s are the same for 10 kinds of views at the bottom of Figure 1. Therefore, we expected that frequency images dataset can give more efficient accuracy and loss result than spatial images dataset, unfortunately, results of frequency images dataset were unsatisfacto ry. So, When these datasets are compared for 10 di fferent conditions (by shifting digits from the cente r), the spatial images dataset achieved 100% robust result on Training and Validation rather than freque ncy images dataset. In future work, we will concate nate the spatial and frequency image to achieve bett er results for these 10 different conditions. We will
hope, the method of concatenation will give us high er accuracy and lower loss rather than spatial and f requency methods.
References
[1] Y. LeCun, Y. Bengio, and G. Hinton. Deep learning. Nature, 521(7553):436-444, 2015.
[2] H. Wu, “CNN-Based Recognition of Handwritten Digits in MNIST Database”, 2015.
[3] A. V. Anand, “A brief study of discrete and fast fourier transforms,” p. 11, 1965.