Comparison of Visceral Fat and Liver Fat as Risk Factors of Metabolic Syndrome
The principal objective of this study was to determine whether visceral fat or liver fat is a more relevant risk factor for metabolic syndrome. A total of 98 subjects aged 18-65 yr, who visited a health promotion center in a university hospital, were enrolled in this study.
Metabolic syndrome was diagnosed based on the modified National Cholesterol Education Program’s Adult Treatment Panel III report (NCEP-ATPIII) criteria. We defined the visceral obesity as a visceral fat area of ≥ 100 cm2 which was acquired by CT at the L4-5 level. To evaluate fatty liver, we applied a liver-to-spleen attenuation ratio ≤ 1.1 as measured by CT at the T12 level. We employed binary logistic regression models that used the presence or absence of metabolic syndrome as a dependent variable and age, sex, and the presence or absence of visceral obesity and fatty liver as independent variables. Visceral obesity was not found to be an independent variable as a risk factor of metabolic syndrome (odds ratio 2.7;
95% confidence interval 0.55-13.30), but fatty liver was found to be significant in this model (odds ratio 71.3; 95% CI 13.04-389.53). Our study suggests that liver fat may be a more important risk factor than visceral fat in terms of its association with metabolic syndrome.
Key Words: Metabolic Syndrome; Visceral Fat; Liver Fat Jeongseob Lee*, Dae-Sung Chung,
Jee-Hyun Kang, and Byung-Yeon Yu Department of Family Medicine, Konyang University Hospital, Daejeon, Korea
*Current address: Department of Family Medicine, Eulji University Hospital, Daejeon, Korea Received: 20 May 2011
Accepted: 7 November 2011 Address for Correspondence:
Jee-Hyun Kang, MD
Department of Family Medicine, Konyang University Hospital, 158 Gwanjeodong-gil, Seo-gu, Daejeon 302-801, Korea Tel: +82.42-600-9240, Fax: +82.42-600-9095 E-mail: [email protected]
http://dx.doi.org/10.3346/jkms.2012.27.2.184 • J Korean Med Sci 2012; 27: 184-189
INTRODUCTION
Non-alcoholic fatty liver disease (NAFLD) has been recognized as a feature of insulin resistance. Recent evidence supports the notion that NAFLD is associated with a number of systemic dis- eases, including visceral obesity, cardiovascular disease, type 2 diabetes, and metabolic syndrome. This association has been attributed to increased cardiovascular mortality and morbidity (1-3). On the basis of liver biopsy results, Marchesini et al. (4) re- ported that nondiabetic patients with metabolic syndrome ex- hibited more severe fibrosis and inflammation in the liver, re- gardless of age, sex and body mass index (BMI), than those pa- tients without metabolic syndrome. The diagnosis of NAFLD was rendered on the basis of liver biopsy, but computed tomog- raphy (CT) has been reported to provide a more objective eval- uation, which is reproducible and correlated more closely with fat accumulation in the liver (5, 6).
Visceral fat is independently related to morbidity and mortal- ity of the coronary heart disease and associated with metabolic syndrome, diabetes, and cardiovascular disease. Because of this, visceral fat has been employed as a clinical measure of risk for obesity (7, 8). Recently, Kantartzis et al. (9) reported that liver fat was a more relevant independent factor for glucose metabolism than visceral fat. Thus far, the impact of liver fat versus visceral
fat in determining metabolic syndrome has not been investigat- ed in any detail. Therefore, in this study we attempted to deter- mine which of these fats as measured by CT was more closely associated with metabolic syndrome.
MATERIALS AND METHODS Participants
We conducted a retrospective analysis using medical records. A total of 98 subjects (34 males, 64 females) aged 18-65 yr, who vis- ited a health promotion center in a university hospital for regu- lar health check-up and underwent visceral fat CT from Septem- ber 2007 to June 2010 were enrolled in this study. According to the questionnaire responses, those with a history of consuming more than 40 g alcohol per week, or chronic liver disease were excluded. Additionally, those who were positive to the superfi- cial antigen of hepatitis B (HBsAg) or hepatitis C antibody were also excluded.
Anthropometry
Height and weight were measured with the subject wearing only a gown, and having fasted for more than 12 hr. We measured up to 0.1 kg, 0.1 cm automatically (HM-170, Fanics, Korea) and con- ducted a body composition analysis using Inbody720 fat analyzer
(Biospace Co., Seoul, Korea). Waist circumference was mea- sured at the midline between the lowest rib and the upper part of the iliac crest, according to WHO guidelines (10).
The measurement of visceral fat area (VFA)
Visceral fat area was measured by single-slice CT (SOMATOM Plus4, Siemens, Erlangen, Germany) at the 4-5th level of lum- bar vertebrae using an attenuation range of 30 to -190 Hounsfield units (HU). We defined visceral obesity as a visceral fat area of more than 100 cm2 (11).
Measurement of liver fat accumulation
To quantify the accumulation of liver fat, we obtained the mean liver attenuation from an average of 4 selected areas of approxi- mately 200 mm2 each, including the right-anterior lobe, right- posterior lobe, and left-interior lobe of the liver, at the T12 level.
We also obtained the mean spleen attenuation from an average of 2 areas of the spleen (anterior and posterior pole) at the T12 level. Finally, we calculated the liver-to-spleen attenuation ratio (LSR), and fatty liver was defined as an LSR ≤ 1.1 (12, 13) (Fig. 1).
Evaluation of metabolic risk factors
All subjects underwent blood sampling after fasting for 12 hr.
Using an automatic blood pressure monitor (FT500-R, Jawon medical Co. LTD., Kyoungsan-City, Kyongsang Buk-do, Korea), we measured blood pressure in sitting position in the left arm, after the patient had rested for at least 5 min. Blood glucose, total cholesterol, triglyceride, high-density lipoprotein (HDL) and low- density lipoprotein (LDL) cholesterol were determined using a chemistry immunoanalyzer (Olympus Au5400 Olympus Opti- cal, Tokyo, Japan). Serum insulin was measured using a human insulin specific radioimmunoassay kit (Linco Research Inc., St.
Charles, MO, USA). Insulin sensitivity was evaluated by calcu- lating the Homeostasis model assessment for insulin resistance (HOMA–IR) index {(fasting insulin [μU/mL] × fasting blood glu-
cose mM)/22.5}. Smoking status was defined as a current smok- er or a non-smoker who had stopped smoking within the last 6 months.
Diagnosis of metabolic syndrome
Diagnosis of metabolic syndrome was rendered in accordance with the National Cholesterol Education Program’s Adult Treat- ment Panel III report (NCEP-ATPIII) criteria with the exception of waist circumference (14). Diagnosis of metabolic syndrome required at least two of the following: triglyceride ≥ 150 mg/dL (1.7 mM), HDL-cholesterol < 40 mg/dL (1.03 mM) in men, < 50 mg/dL (1.29 mM) in women, blood pressure systolic ≥ 130 mmHg or diastolic ≥ 85 mmHg, fasting blood glucose ≥ 100 mg/dL (5.6 mM).
Statistical analysis
Data were expressed as means ± standard deviation. Consider- ing the characteristics of the variables, independent t-tests and Pearson chi-square tests were carried out in order to evaluate the differences between the metabolic syndrome group and the non-metabolic syndrome group. To determine the predictive effects of visceral fat and liver fat as risk factors for metabolic syndrome, binary logistic regression analyses were carried out.
In this model, the presence of metabolic syndrome was a depen- dent variable, and age, sex, the presence of visceral obesity and the presence of fatty liver as measured by LSR were independent variables. P values of less than 0.05 were considered significant.
PASW Statistics 18 statistical software (SPSS Inc., Chicago, IL, USA) was used for the analysis.
Ethics statement
This study protocol was reviewed and approved by institutional review board of Konyang University Hospital (research number:
11-32). Written informed consent was obtained from subjected patients.
RESULTS
Demographic and clinical characteristics according to the presence of metabolic syndrome
The 98 participants in this study, 34 men and 64 women, had a mean age of 39.4 ± 13.6 yr (men, 41 ± 13.1 yr; women, 38.4 ± 13.8 yr). The prevalence of metabolic syndrome was 33.7% over- all. Average age of the subjects with metabolic syndrome (45.1 ± 12.1 yr) was significantly higher than that of the subjects with- out metabolic syndrome (36.9 ± 13.6 yr) (P = 0.004) (Table 1).
BMI was significantly higher in the metabolic syndrome group (P = 0.021), but body fat percentage (body fat %) did not differ significantly between the two groups (31.0% ± 6.0%, 31.4% ± 6.7%, respectively). Visceral adipose tissue (VAT) was significant- ly higher in the metabolic syndrome group (113.4 ± 39.5 cm2) Fig. 1. Abdominal fat CT for measurement of liver and spleen attenuation (in Houn-
sfield units).
than the non-metabolic syndrome group (76.5 ± 26.9 cm2) (P <
0.001). CT attenuations values of each liver and spleen varied sig- nificantly, and LSR also showed significant difference between the two groups (P < 0.001). The two groups differed significant- ly in terms of blood pressure, fasting blood glucose, triglyceride, HDL-cholesterol, and LDL-cholesterol, but not in total choles- terol (P = 0.125). HOMA-IR was 3.6 ± 1.4 in the metabolic syn- drome group, and 2.5 ± 1.2 in the non-metabolic syndrome group, and this difference reached significance (P < 0.001). No differences in liver enzymes (aspartate aminotransferase, ala- nine aminotransferase and γ-glutamyltransferase) were detect- ed between the two groups. The smoking rate was significantly higher in the subjects with metabolic syndrome (36.4%, 12/33) than in the subjects without metabolic syndrome (9.2%, 6/65) (P = 0.01) (Table 1).
Prevalence of metabolic risk factors
The prevalence of hypertriglyceridemia was 27.6% (men 44.1%, women 18.8%). 30.6% of total subjects (men, 20.6%; women,
35.9%) had low HDL-cholesterol. High blood pressure and hy- perglycemia were noted in 26.5% (men, 50.0%; women, 14.1%) and 27.6% (men, 41.2%; females, 20.3%) respectively. The prev- alence of metabolic syndrome defined as a cluster of at least two metabolic risk factors was 33.7% of the total subjects (men, 47.1%;
women, 26.6%) (Table 2).
Comparison of the metabolic risk factors according to the liver to spleen ratio and the visceral fat area
Subjects with fatty liver (defined as LSR ≤ 1.1) exhibited signifi- cantly higher waist circumference (P < 0.001), systolic blood pressure (P = 0.002), diastolic blood pressure (P < 0.001), fast- ing blood glucose (P = 0.029), triglycerides (P < 0.001) and HOMA-IR (P < 0.001) than subjects without fatty liver. HDL- cholesterol levels were significantly lower in the subjects with fatty liver (P < 0.001) (Fig. 2). Subjects with visceral abdominal obesity (defined as VFA ≥ 100 cm2) also had significantly higher waist circumference (P < 0.001), systolic blood pressure (P = 0.018), diastolic blood pressure (P = 0.002), fasting blood glu- cose (P = 0.042), and triglycerides (P < 0.001) than subjects without visceral obesity. HDL-cholesterol levels were lower in the group with visceral obesity (P = 0.006). However, HOMA-IR did not differ significantly regardless of presence of visceral obesity (P = 0.077) (Fig. 2).
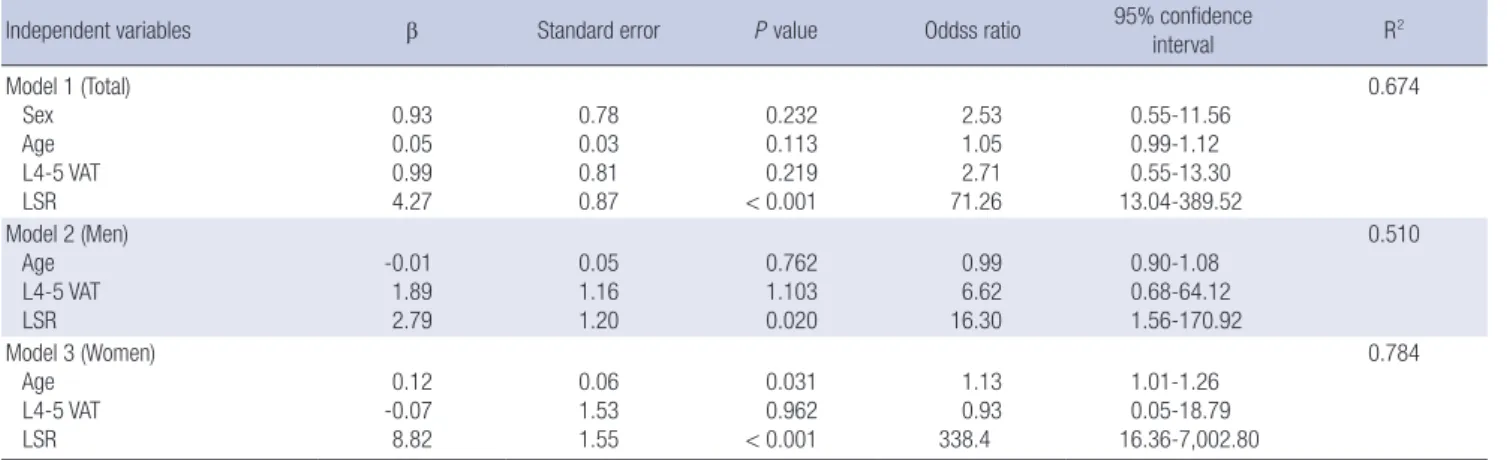
Comparison between visceral fat and liver fat as risk factors of metabolic syndrome
Binary logistic regression analyses were carried out to compare visceral obesity (VFA ≥ 100 cm2) and fatty liver (LSR ≤ 1.1) as risk factors of metabolic syndrome. In these models, the presence or absence of metabolic syndrome was used as a dependent vari- able and age, sex, and the presence or absence of visceral obesity and fatty liver as independent variables. There was no multi-col- linearity problem among these explanatory variables (Table 3).
In the total subjects, fatty liver (defined as LSR ≤ 1.1) adjusted for age and sex was found to be a significant independent vari- able as a risk factor for metabolic syndrome (odds ratio 71.3; 95%
confidence interval 13.04-389.53; P < 0.001), but visceral obesity was not (odds ratio 2.7; 95% CI 0.55-13.30; P = 0.219) (Model 1).
Table 1. Demographic and clinical characteristics according to presence of metabolic syndrome
Parameters Overall
(n = 98)
No MS (n = 65)
MS
(n = 33) P value Demographics
Age (yr)
Sex, men, No. (%) 39.4 (13.6)
34 (34.7) 36.9 (13.6)
18 (27.7) 45.1 (12.1) 16 (48.5) 0.004
0.04*
Body composition Height (cm) Weight (kg) Waist circumference (cm)
BMI (kg/m2) Body fat (%) L4-5 VAT (cm2) Liver attenuation (HU) Spleen attenuation (HU) Liver/Spleen attenuation ratio
162.0 (8.3) 66.8 (12.6) 83.6 (8.0) 25.3 (3.4) 31.4 (6.4) 88.7 (36.2) 58.0 (8.4) 53.9 (6.5) 1.09 (0.17)
161.4 (7.9) 64.7 (11.6) 81.5 (7.9) 24.7 (3.3) 31.1 (6.7) 76.5 (26.9) 59.3 (7.2) 51.9 (6.1) 1.15 (0.14)
169.2 (8.9) 70.7 (13.6) 87.7 (6.4) 26.4 (3.3) 31.0 (6.0) 113.4 (39.5)
55.7 (10.1) 57.8 (5.3) 0.97 (0.17)
0.3 0.024
< 0.001 0.021 0.96
< 0.001 0.047
< 0.001
< 0.001 Metabolic characteristics
Systolic BP (mmHg) Diastolic BP (mmHg) Fasting plasma glucose (mg/dL)
Total cholesterol (mg/dL) Triglyceride (mg/dL) HDL cholesterol (mg/dL) LDL cholesterol (mg/dL) Insulin (IU/L) HOMA-IR AST (U/L) ALT (U/L) γ-GT (U/L) Smoking (%)
114.8 (13.5) 76.8 (10.8) 96.6 (14.1) 197.3 (38.7) 131.0 (69.8) 52.9 (12.7) 124.3 (28.5) 12.2 (5.3)
2.9 (1.4) 23.8 (10.2) 25.5 (17.7) 23.8 (31.1)
18.4
111.3 (11.9) 73.7 (9.4) 93.3 (7.1) 193.5 (41.0) 101.6 (46.7) 57.3 (12.4) 119.3 (29.6) 10.8 (4.5)
2.5 (1.2) 23.3 (11.6) 23.8 (19.0) 21.7 (36.6)
9.2
121.8 (13.7) 83.2 (10.7) 103.3 (20.8) 206.2 (32.9) 188.9 (71.2) 44.2 (7.6) 134.9 (23.4)
14.8 (5.1) 3.6 (1.4) 24.9 (6.4) 28.8 (14.3) 28.2 (14.1)
36.4
< 0.001
< 0.001 0.011 0.125
< 0.001
< 0.001 0.01
< 0.001
< 0.001 0.476 0.184 0.207 0.01*
Data are expressed as means (SD; standard deviation), independent t-test or chi- square test*. BMI, body mass index; L4-5 VAT, visceral adipose tissue area at the 4th- 5th lumbar vertebral level; HU, Hounsfield unit; BP, blood pressure; HDL, high density lipoprotein; LDL, low density lipoprotein; HOMA-IR, homeostasis model assessment of insulin resistance; AST, aspartate aminotransferase; ALT, alanine aminotransferase;
γ-GT, gamma-glutamyltransferase.
Table 2. Prevalence of metabolic risk factors
Risk factors Total (n = 98) Men (n = 34) Women (n = 64) Hypertriglyceridemia* 27 (27.6%) 15 (44.1%) 12 (18.8%)
Low HDL† 30 (30.6%) 7 (20.6%) 23 (35.9%)
High BP‡ 26 (26.5%) 17 (50.0%) 9 (14.1%)
Hyperglycemia§ 27 (27.6%) 14 (41.2%) 13 (20.3%)
Metabolic syndrome
(risk factors ≥ 2) 33 (33.7%) 16 (47.1%) 17 (26.6%)
*Hypertriglyceridemia defined as triglycerides ≥ 150 mg/dL; †Low HDL defined as HDL cholesterol < 40 mg/dL in men, < 50 mg/dL in women; ‡High BP defined as systolic BP ≥ 130 mmHg or diastolic BP ≥ 85 mmHg; §Hyperglycemia defined as fasting plas- ma glucose ≥ 100 mg/dL or previously diagnosed type 2 diabetes. HDL, high-density lipoprotein cholesterol; BP, blood pressure.
Fig. 2. Comparison of the risk factor of metabolic syndrome according to the liver to spleen ratio (LSR) and the L4-5 visceral adipose tissue (VAT). P value from t-test. VAT, vis- ceral adipose tissue area at the 4-5th lumbar vertebral level (cm2); LSR, Liver to spleen attenuation ratio.
mmHg mmHg
Systolic blood pressure Diastolic blood pressure
111.2
73.5 112.7
76.6 P = 0.002
P < 0.001 P = 0.018
P = 0.002 120.1
81.7 120.0
82.1
LSR > 1.1 LSR ≤ 1.1 VAT < 100 VAT ≥ 100 LSR > 1.1 LSR ≤ 1.1 VAT < 100 VAT ≥ 100 150
100 50 0
150 100 50 0
mg/dL mg/dL
Triglyceride High density lipoprotein
99.9
56.9 113.4
54.9
P < 0.001 P < 0.001 P < 0.001 P = 0.006
176.1
47.1 172.9
48.1
LSR > 1.1 LSR ≤ 1.1 VAT < 100 VAT ≥ 100 LSR > 1.1 LSR ≤ 1.1 VAT < 100 VAT ≥ 100 300
200 100 0
80 60 40 20 0
mg/dL mg/dL
Fasting plasma glucose HOMA-IR
93.7
2.4
94.0 2.7
P = 0.029 P = 0.042 P < 0.001 P = 0.077
101.0 102.8 3.5
3.2
LSR > 1.1 LSR ≤ 1.1 VAT < 100 VAT ≥ 100 LSR > 1.1 LSR ≤ 1.1 VAT < 100 VAT ≥ 100 150
100 50 0
6 4 2 0
Table 3. Binary logistic regression analysis for the presence of metabolic syndrome in the study subjects
Independent variables β Standard error P value Oddss ratio 95% confidence
interval R2
Model 1 (Total) Sex Age L4-5 VAT LSR
0.93 0.05 0.99 4.27
0.78 0.03 0.81 0.87
0.232 0.113 0.219
< 0.001
2.53 1.05 2.71 71.26
0.55-11.56 0.99-1.12 0.55-13.30 13.04-389.52
0.674
Model 2 (Men) Age L4-5 VAT LSR
-0.01 1.89 2.79
0.05 1.16 1.20
0.762 1.103 0.020
0.99 6.62 16.30
0.90-1.08 0.68-64.12 1.56-170.92
0.510
Model 3 (Women) Age L4-5 VAT LSR
0.12 -0.07 8.82
0.06 1.53 1.55
0.031 0.962
< 0.001
1.13 0.93 338.4
1.01-1.26 0.05-18.79 16.36-7,002.80
0.784
Dependent variable: presence or absence of metabolic syndrome. Independent variables: sex, age, presence of visceral obesity with visceral adipose tissue area (VAT) ≥ 100 cm2, presence of fatty liver (LSR ≤ 1.1). L4-5 VAT, visceral adipose tissue area at the 4-5th lumbar vertebral level (cm2); LSR, Liver to spleen attenuation ratio.
We observed the same results in the sex-sorted data: fatty liver was the only significant independent variable to explain meta-
bolic syndrome (Model 2 and 3).
DISCUSSION
Recent studies have shown that although obesity is strongly as- sociated with metabolic disorder, the site of fat accumulation is a more important risk factor for the metabolic disorder than obe- sity itself. In this study, using the data of 98 participants who vis- ited the health promotion center in a university hospital, we at- tempted to determine whether visceral fat or liver fat was a more relevant risk factor for metabolic syndrome. The number of wom- en participant in our study was almost double to that of men participants because much more number of men had history of alcohol which was one of the exclusion criteria. With regard to the smoking history, the group with metabolic syndrome con- tained a significantly higher proportion of smokers than the group without metabolic syndrome (36.4% vs 9.2%, respectively; P = 0.01). The effects of smoking on metabolic syndrome have been previously reported that smoking is the one of risk factors for insulin resistance (15-17). However, in our total study popula- tion, significant independent variables to metabolic syndrome did not change after adjustment of smoking history during the logistic regression analysis.
It has been shown that the prevalence of cardiovascular dis- ease increases after the age of 40 in men and 50 in women, but the average age of the participants in this study was 39.4; this may be the reason that the men in this study had a higher prevalence of metabolic risk factors than the women in this study (Table 2).
In the present study, fatty liver (defined as LSR ≤ 1.1) adjusted for age and sex was found to be a significant independent vari- able as a risk factor for metabolic syndrome, but visceral obesity (defined as VFA ≥ 100 cm2) was not. We obtained the same re- sults in the sex-sorted data: fatty liver was the only significant independent variable. These findings are consistent with the recently reported data of Fan et al. (18), who determined that NAFLD was more relevant than obesity itself in determining metabolic syndrome. Despite the fact that liver fat or the pres- ence of fatty liver was found to be closely associated with meta- bolic disorders (prediabetes, diabetes, and hypertension) in many studies (9, 19-21), there have been no studies conducted specifically to compare the relevance of visceral fat and liver fat to metabolic syndrome as far as we know. Thus, our study may provide new insights into this issue.
Ryysy et al. (22) reported previously that variations in hepatic fat content may affect insulin requirements via an effect on the sensitivity of endogenous glucose production to insulin in type 2 diabetic patients with insulin therapy. Moreover, they demon- strated that as more liver fat accumulates, it becomes more close- ly associated with the insulin-resistance conditions, including hyperinsulinemia, hypertriglyceridemia, low HDL-cholesterol, and high systolic blood pressure. Seppälä-Lindroos et al. (23) reported that the accumulation of fat in the liver is, independent of body mass index and visceral obesity, characterized by sev-
eral features of insulin resistance in moderately overweight and normal-weight subjects. Although abdominal visceral fat was a correlate of increased systemic and splanchnic rates of lipolysis, upper body nonsplanchnic tissue was definitively shown to be the principal contributor to whole body lipolysis in a previous study examining the relationship among deep abdominal sub- cutaneous fat, visceral fat, and glucose disappearance using the portal vein catheterization technique of Basu et al. (24). Despite the known association between visceral fat and insulin resis- tance and metabolic disorders, our findings demonstrate that fat accumulation in insulin-sensitive tissues may be a more im- portant determinant of insulin sensitivity than visceral fat itself.
On the other hand, visceral fat levels tend to be lower in women than in men, and lower in young people than in older individu- als. In this regard, because the proportion of women in the total subject population was high, the average patient age was 39.4 yr, and the average VFA was 88.7 cm2, we are unable to exclude the possibility that our dataset had some effect on this result.
This study suffered from several limitations. First of all, the cross-sectional nature of the study did not allow definitive con- clusions about causal relationships to be drawn. Second, as men- tioned earlier, because we enrolled only a total of 98 subjects and there was a sex-ratio imbalance in the subject population, these may have been influenced the outcome. Third, the results of the present study cannot be directly applied to general popu- lations, because the study was designed for, and performed in, a limited population. Finally, the diagnostic criterion of fatty liver which was used in this study has its own limitation as a refer- ence of standard.
In conclusion, we found that liver fat was more associated with metabolic syndrome than visceral fat. Thus, NAFLD may be a more relevant risk factor for metabolic syndrome than is visceral obesity.
REFERENCES
1. Isomaa B, Almgren P, Tuomi T, Forsén B, Lahti K, Nissén M, Taskinen MR, Groop L. Cardiovascular morbidity and mortality associated with the metabolic syndrome. Diabetes Care 2001; 24: 683-9.
2. Stefan N, Kantartzis K, Haring HU. Causes and metabolic consequences of fatty liver. Endocr Rev 2008; 29: 939-60.
3. Adams LA, Lymp JF, St Sauver J, Sanderson SO, Lindor KD, Feldstein A, Angulo P. The natural history of nonalcoholic fatty liver disease: a popu- lation based cohort study. Gastroenterology 2005; 129: 113-21.
4. Marchesini G, Bugianesi E, Forlani G, Cerrelli F, Lenzi M, Manini R, Natale S, Vanni E, Villanova N, Melchionda N, Rizzetto M. Nonalcoholic fatty liver, steatohepatitis, and the metabolic syndrome. Hepatology 2003;
37: 917-23.
5. Saadeh S, Younossi ZM, Remer EM, Gramlich T, Ong JP, Hurley M, Mul- len KD, Cooper JN, Sheridan MJ. The utility of radiological imaging in nonalcoholic fatty liver disease. Gastroenterology 2002; 123: 745-50.
6. Schwenzer NF, Springer F, Schraml C, Stefan N, Machann J, Schick F.
Non-invasive assessment and quantification of liver steatosis by ultra- sound, computed tomography and magnetic resonance. J Hepatol 2009;
51: 433-45.
7. Després JP. Is visceral obesity the cause of the metabolic syndrome? Ann Med 2006; 38: 52-63.
8. Carr DB, Utzschneider KM, Hull RL, Kodama K, Retzlaff BM, Brunzell JD, Shofer JB, Fish BE, Knopp RH, Kahn SE. Intra-abdominal fat is a major determinant of the National Cholesterol Education Program Adult Treatment Panel III criteria for the metabolic syndrome. Diabetes 2004;
53: 2087-94.
9. Kantartzis K, Machann J, Schick F, Fritsche A, Häring HU, Stefan N. The impact of liver fat vs visceral fat in determining categories of prediabetes.
Diabetologia 2010; 53: 882-9.
10. World Health Organization. Obesity: preventing and managing the global epidemic. Report of a WHO consultation. Geneva: World Health Orga- nization, 2000.
11. Examination Committee of Criteria for ‘Obesity Disease’ in Japan; Japan Society for the Study of Obesity. New criteria for ‘obesity disease’ in Japan.
Circ J 2002; 66: 987-92.
12. Iwasaki M, Takada Y, Hayashi M, Minamiguchi S, Haga H, Maetani Y, Fujii K, Kiuchi T, Tanaka K. Noninvasive evaluation of graft steatosis in living donor liver transplantation. Transplantation 2004; 78: 1501-5.
13. Boyce CJ, Pickhardt PJ, Kim DH, Taylor AJ, Winter TC, Bruce RJ, Lind- strom MJ, Hinshaw JL. Hepatic steatosis (fatty liver disease) in asymp- tomatic adults identified by unenhanced low-dose CT. AJR Am J Roent- genol 2010; 194: 623-8.
14. National Cholesterol Education Program (NCEP) Expert Panel on De- tection, Evaluation, and Treatment of High Blood Cholesterol in Adults (Adult Treatment Panel III). Third report of the National Cholesterol Ed- ucation Program (NCEP) Expert Panel on Detection, Evaluation, and Treatment of High Blood Cholesterol in Adults (Adult Treatment Panel III) final report. Circulation 2002; 106: 3143-421.
15. Chen CC, Li TC, Chang PC, Liu CS, Lin WY, Wu MT, Li CI, Lai MM, Lin CC. Association among cigarette smoking, metabolic syndrome, and its
individual components: the metabolic syndrome study in Taiwan. Me- tabolism 2008; 57: 544-8.
16. Li Y, Yatsuya H, Iso H, Tamakoshi K, Toyoshima H. Incidence of meta- bolic syndrome according to combinations of lifestyle factors among mid- dle-aged Japanese male workers. Prev Med 2010; 51: 118-22.
17. Facchini FS, Hollenbeck CB, Jeppesen J, Chen YD, Reaven GM. Insulin resistance and cigarette smoking. Lancet 1992; 339: 1128-30.
18. Fan JG, Li F, Cai XB, Peng YD, Ao QH, Gao Y. Effects of nonalcoholic fatty liver disease on the development of metabolic disorders. J Gastroenterol Hepatol 2007; 22: 1086-91.
19. Shibata M, Kihara Y, Taguchi M, Tashiro M, Otsuki M. Nonalcoholic fatty liver disease is a risk factor for type 2 diabetes in middle-aged Japanese men. Diabetes Care 2007; 30: 2940-4.
20. Friis-Liby I, Aldenborg F, Jerlstad P, Rundström K, Björnsson E. High prevalence of metabolic complications in patients with non-alcoholic fatty liver disease. Scand J Gastroenterol 2004; 39: 864-9.
21. Speliotes EK, Massaro JM, Hoffmann U, Vasan RS, Meigs JB, Sahani DV, Hirschhorn JN, O’Donnell CJ, Fox CS. Fatty liver is associated with dys- lipidemia and dysglycemia independent of visceral fat: the Framingham Heart Study. Hepatology 2010; 51: 1979-87.
22. Ryysy L, Häkkinen AM, Goto T, Vehkavaara S, Westerbacka J, Halavaara J, Yki-Järvinen H. Hepatic fat content and insulin action on free fatty ac- ids and glucose metabolism rather than insulin absorption are associat- ed with insulin requirements during insulin therapy in type 2 diabetic patients. Diabetes 2000; 49: 749-58.
23. Seppälä-Lindroos A, Vehkavaara S, Häkkinen AM, Goto T, Westerbacka J, Sovijärvi A, Halavaara J, Yki-Järvinen H. Fat accumulation in the liver is associated with defects in insulin suppression of glucose production and serum free fatty acids independent of obesity in normal men. J Clin Endocrinol Metab 2002; 87: 3023-8.
24. Basu A, Basu R, Shah P, Vella A, Rizza RA, Jensen MD. Systemic and re- gional free fatty acid metabolism in type 2 diabetes. Am J Physiol Endo- crinol Metab 2001; 280: E1000-6.