D I A B E T E S & M E T A B O L I S M J O U R N A L
This is an Open Access article distributed under the terms of the Creative Commons At- tribution Non-Commercial License (http://creativecommons.org/licenses/by-nc/3.0/) which permits unrestricted non-commercial use, distribution, and reproduction in any medium, provided the original work is properly cited.
A Cross-Sectional Study of the Phenotypes of Obesity and Insulin Resistance in Adults with Down Syndrome
Diego Real de Asua, Pedro Parra, Ramón Costa, Fernando Moldenhauer, Carmen Suarez
Adult Down Syndrome Outpatient Clinic, Department of Internal Medicine, Fundación de Investigación Biomédica, Hospital Universitario de La Princesa, Madrid, Spain
Background: Despite the confluence of multiple cardiovascular risk factors, subclinical atherosclerotic damage and cardiovascu- lar events remain extremely rare in adults with Down syndrome (DS). We aim to determine the prevalence of obesity and meta- bolic disorders in an adult cohort with DS and to compare our findings with adults without DS.
Methods: Cross-sectional study of 51 consecutively selected adults with DS living in the community and 51 healthy controls in an outpatient clinic of a tertiary care hospital in Madrid, Spain. Epidemiological data (age and gender), anthropometric data (body mass index and waist-to-height ratio), coexisting clinical conditions, and laboratory data (fasting glucose, insulin, glycated hemoglobin, creatinine, thyroid hormones, vitamins, and lipid profile) were measured and compared between the groups.
Results: Adults with DS were significantly younger and more often men with a higher prevalence of overweight and obesity than controls. Their waist-to-height ratio was higher, and they more frequently had abdominal obesity. The results of an analysis ad- justed for age and gender revealed no differences in fasting insulin levels, homeostatic model assessment indexes, or lipid profile between adults with DS and controls.
Conclusion: Adults with DS presented a high prevalence of overweight and obesity. However, we found no differences in lipid profile, prevalence of insulin resistance, or metabolic syndrome between adults with DS and controls.
Keywords: Down syndrome; Hypothyroidism; Insulin resistance; Metabolic syndrome; Obesity, abdominal
Corresponding author: Diego Real de Asua
Department of Internal Medicine, Hospital Universitario de La Princesa, C/Diego de León 62, 28006 Madrid, Spain
E-mail: [email protected]
INTRODUCTION
Atherosclerosis is the main pathophysiological substrate of car- diovascular disease (CVD), which is the leading cause of mor- bidity and mortality in Western countries [1]. The prevalence of CVD increases not only with age but also with the presence of multiple concomitant risk factors, such as arterial hyperten- sion, diabetes mellitus, dyslipidemia, obesity, and sedentary lifestyle [2]. When present together, high blood pressure and metabolic risk factors interact to produce the metabolic syn- drome, which leads to a greater total CVD risk than the sum of its individual components [3]. Obesity and insulin resistance play a central role in the pathogenesis of metabolic syndrome
[4]. The prevalence of obesity is high in all age groups and con- tinues to rise in most Western countries. Of particular concern is the rising prevalence of weight-related disorders in children and adolescents, which can increase their risk of CVD in later life [5,6]. The economic burden of CVD, including healthcare and nonhealthcare-related costs, is increasing in most devel- oped countries, thus highlighting the importance of these dis- eases in our milieu [7].
Since the 1980s, the improved survival of children with Down syndrome (DS) has resulted in dramatically improved life ex- pectancy for a growing population of adults [8]. A population- based study in the United States revealed an increase in median age at death of adults with DS from 25 years in 1983 to 49 years http://dx.doi.org/10.4093/dmj.2014.38.6.464
pISSN 2233-6079 · eISSN 2233-6087
in 1997 [9]. This “new” population of adults with DS raises unique clinical issues, which differ from those of the pediatric population with DS or the general population [10]. Obesity and dyslipidemia appear to be more prevalent in both children and adults with DS [11-13]. Murdoch et al. [14] found no signifi- cant differences in mean total cholesterol and triglyceride levels between adults with and without DS; however, other studies have observed a more atherogenic lipid profile in individuals with DS than in the general population [11,13]. Furthermore, a higher incidence of type 1 diabetes mellitus has also been ob- served in individuals with DS [15].
Despite the confluence of multiple risk factors for CVD, sub- clinical atherosclerotic damage, and cardiovascular events re- main extremely rare in adults with DS [16-18]. In 1977, DS was reported to be an “atheroma-free model”; atheroma was com- pletely absent at autopsy in five institutionalized adults with DS, while atheroma was present in institutionalized adults without DS [14]. Subsequent studies both supported [16] and contra- dicted this finding [19-21]. Based on carotid intima-media thickness or pulse wave velocity, recent studies found no in- crease in subclinical vascular damage in adults with DS com- pared to healthy controls, even though both groups had a simi- larly elevated risk of CVD [17,18]. However, most previous studies were cross-sectional evaluations of single CVD risk fac- tors in small samples and insufficiently powered to generate any hypothesis for this relevant clinical discrepancy, which could have implications for protection from atherosclerosis in the general population. We present a cross-sectional study with a comprehensive assessment of multiple CVD risk factors, focus- ing on carbohydrate metabolism, lipids, and adiposity in a co- hort of adults with DS. Our working hypothesis was that adults with DS would have a higher prevalence of obesity and subse- quent metabolic disorders than adults without DS. Our objec- tives were to study the prevalence of weight-related and meta- bolic disorders (states of glycemic dysregulation such as im- paired fasting glucose, diabetes mellitus, dyslipidemia, and metabolic syndrome) in adults with DS and to describe any dif- ferences with a cohort of healthy controls.
METHODS
Study design
Ours was a cross-sectional study of 51 adults with DS and 51 control participants. The former were consecutively selected from all patients at the Adult Down Syndrome Outpatient Clin-
ic of the Department of Internal Medicine, Hospital Universita- rio de La Princesa in Madrid, Spain. The recruitment period ran from January 2012 to March 2013. The study was conducted in accordance with the provisions of the Declaration of Helsinki and Good Clinical Practice Guidelines, and the local Institu- tional Review Board approved the study protocol. All partici- pants and family members were extensively informed by two of three investigators (DRA, PP, and RC) before the initial evalua- tion and provided their written informed consent before under- going any study procedure. All data were treated in the strictest confidence, according to the most recent Spanish legislation on data protection.
Patients
The inclusion criteria were age over 18 years and presence of DS documented by karyotype. All adults with DS included in the study had a full trisomy 21 (we found no adults with Rob- ertsonian translocations or mosaics). Control participants were race-matched healthy individuals. Family members and legal guardians of adults with DS were invited to participate volun- tarily in this study. Siblings of adults with DS were used as con- trols in 44 cases (44/51, 86%); as for the remainder, two were parents of adults with DS and five were unrelated healthy indi- viduals. The exclusion criteria were as follows: severe congeni- tal heart disease not treated with surgery, severe sensory im- pairment, inability to provide consent, pregnancy, and a known diagnosis of diabetes mellitus or metabolic syndrome.
Measurements
The variables collected in all study participants were as fol- lows.
Epidemiological variables Age and gender.
Anthropometric variables
Height, weight, body mass index (BMI), waist-to-height ratio, and total body fat percentage. Height was measured to the near- est 0.5 cm using a stadiometer, and weight was measured on a calibrated balance scale to the nearest 0.5 kg. Body weight cate- gories (normal weight, overweight, and obesity) were defined using internationally accepted BMI cutoff values [22]. Waist-to- height ratio was calculated, and a cutoff value of 0.5 was consid- ered diagnostic of abdominal obesity [23,24]. We favored the waist-to-height ratio to assess abdominal obesity, since this in-
dex is superior to waist circumference for the diagnosis of ab- dominal obesity in the general population and is presumed to more truly reflect fat distribution in individuals with a short stature [24].
Clinical variables
Clinical variables were obtained through systematic review of medical records, as follows: family history of early CVD events, presence of arterial hypertension, dyslipidemia, diabetes melli- tus, smoking, other coexisting conditions (thyroid disorders, obstructive sleep apnea, Alzheimer’s disease), relevant medica- tions (including antihypertensive agents, lipid-lowering agents, antidiabetic drugs, anxiolytics, antidepressants, antipsychotics, antiepileptics, nonsteroidal anti-inflammatory drugs, levothy- roxine, glucocorticoids, vitamin B or D supplements, and oral contraceptives/estrogen replacement therapy), office blood pressure, resting heart rate, and fat/fruit/fiber intake. Blood pressure was determined using a validated oscillometric device (OMRON M-6 comfort or OMRON 711 models; OMRON Healthcare, Vernon Hills, IL, USA). Office blood pressure was taken with the participant seated after a minimum 3- to 5-min- ute rest. Three consecutive measurements were made, with a 1- to 2-minute interval between them, and their mean was con- sidered the final office blood pressure, in accordance with the European Society of Hypertension guidelines [25]. Fat/fruit/fi- ber consumption was assessed using Block screening question- naires [26].
Blood testing
All participants underwent a fasting blood test after a mini- mum 10-hour overnight fast. Fasting glucose, fasting insulin, glycated hemoglobin, creatinine, thyroid hormones (thyroid stimulating hormone [TSH] and free thyroxine [FT4]), vita- mins (25-OH-vitamin D, vitamin B12, and folic acid), total cholesterol, high density lipoprotein cholesterol (HDL-C), low density lipoprotein cholesterol, and triglyceride levels were de- termined in a Roche/Hitachi modular-D analyzer (Roche Di- agnostics GmbH, Mannheim, Germany). Homeostatic model assessment-insulin resistance (HOMA-IR) values were esti- mated as follows: [glucose (mg/dL)×insulin (mcU/mL)]/405.
HOMA-β cell function (HOMA-β) values were calculated as follows: [360×insulin (mcU/mL)]/[glucose (mg/dL)–63] [27].
We used a HOMA-IR cutoff value of 3.8 (90th percentile), ow- ing to its high specificity for the diagnosis of IR [28]. The defi- nitions used for diagnosis of impaired fasting glucose or diabe-
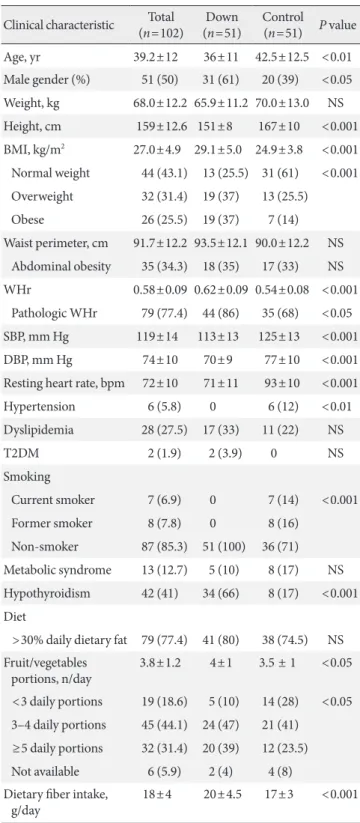
Table 1. Anthropometric and clinical characteristics of the study sample
Clinical characteristic Total
(n=102) Down
(n=51) Control (n=51) P value Age, yr 39.2±12 36±11 42.5±12.5 <0.01 Male gender (%) 51 (50) 31 (61) 20 (39) <0.05 Weight, kg 68.0±12.2 65.9±11.2 70.0±13.0 NS Height, cm 159±12.6 151±8 167±10 <0.001 BMI, kg/m2 27.0±4.9 29.1±5.0 24.9±3.8 <0.001 Normal weight 44 (43.1) 13 (25.5) 31 (61) <0.001 Overweight 32 (31.4) 19 (37) 13 (25.5)
Obese 26 (25.5) 19 (37) 7 (14)
Waist perimeter, cm 91.7±12.2 93.5±12.1 90.0±12.2 NS Abdominal obesity 35 (34.3) 18 (35) 17 (33) NS WHr 0.58±0.09 0.62±0.09 0.54±0.08 <0.001 Pathologic WHr 79 (77.4) 44 (86) 35 (68) <0.05 SBP, mm Hg 119±14 113±13 125±13 <0.001
DBP, mm Hg 74±10 70±9 77±10 <0.001
Resting heart rate, bpm 72±10 71±11 93±10 <0.001
Hypertension 6 (5.8) 0 6 (12) <0.01
Dyslipidemia 28 (27.5) 17 (33) 11 (22) NS
T2DM 2 (1.9) 2 (3.9) 0 NS
Smoking
Current smoker 7 (6.9) 0 7 (14) <0.001
Former smoker 8 (7.8) 0 8 (16)
Non-smoker 87 (85.3) 51 (100) 36 (71) Metabolic syndrome 13 (12.7) 5 (10) 8 (17) NS Hypothyroidism 42 (41) 34 (66) 8 (17) <0.001 Diet
>30% daily dietary fat 79 (77.4) 41 (80) 38 (74.5) NS Fruit/vegetables
portions, n/day 3.8±1.2 4±1 3.5 ± 1 <0.05 <3 daily portions 19 (18.6) 5 (10) 14 (28) <0.05 3–4 daily portions 45 (44.1) 24 (47) 21 (41)
≥5 daily portions 32 (31.4) 20 (39) 12 (23.5) Not available 6 (5.9) 2 (4) 4 (8) Dietary fiber intake,
g/day 18±4 20±4.5 17±3 <0.001
Values are presented as mean±standard deviation or number (%).
NS, not significant; BMI, body mass index; WHr, waist-to-height ra- tio; SBP, systolic blood pressure; DBP, diastolic blood pressure;
T2DM, type 2 diabetes mellitus.
tes mellitus were those of the most recent American Diabetes Association criteria [29]. Dyslipidemia and metabolic syndrome were defined according to modified National Cholesterol Edu- cation Program-Adult Treatment Panel III criteria [4].
Statistical analysis
All data were processed using SPSS version 20.0 (IBM Co., Ar- monk, NY, USA). We compared the prevalence of obesity and overweight, impaired fasting glucose, diabetes, dyslipidemia, and metabolic syndrome between adults with DS and controls, as well as the distribution of the values for blood sugar, adiposity (weight, BMI, waist circumference, and total body fat percent- age), and lipids. Qualitative results are presented as absolute fre- quencies (percentages), whereas quantitative results are pre- sented as means±standard deviations. A chi-square test (with Yates correction when applicable) was used to evaluate statisti- cal significance in the comparison of categorical variables. All analyses were adjusted for age and gender. A multiple logistic regression analysis with all significant variables from the uni- variate comparison between groups (which included age, gen- der, BMI, waist-to-height ratio, abdominal fat percentage, TSH levels, and daily fruit and fiber intake), was performed in order to identify possible determinants of IR in adults with DS.
RESULTS
The study population comprised 102 participants (51 adults with DS and 51 controls). All participants were included in the analysis of clinical and anthropometric variables. Three adults
with DS and 18 controls refused to provide a blood sample.
Therefore, the laboratory results correspond to 48 adults with DS and 33 controls.
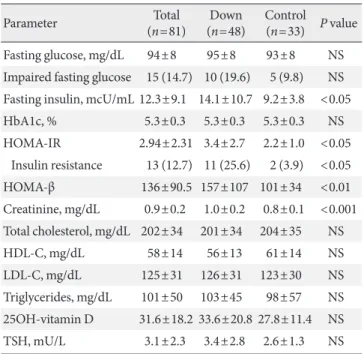
Table 2. Description of laboratory parameters in the study sample
Parameter Total
(n=81) Down
(n=48) Control (n=33) P value Fasting glucose, mg/dL 94±8 95±8 93±8 NS Impaired fasting glucose 15 (14.7) 10 (19.6) 5 (9.8) NS Fasting insulin, mcU/mL 12.3±9.1 14.1±10.7 9.2±3.8 <0.05
HbA1c, % 5.3±0.3 5.3±0.3 5.3±0.3 NS
HOMA-IR 2.94±2.31 3.4±2.7 2.2±1.0 <0.05 Insulin resistance 13 (12.7) 11 (25.6) 2 (3.9) <0.05 HOMA-β 136±90.5 157±107 101±34 <0.01 Creatinine, mg/dL 0.9±0.2 1.0±0.2 0.8±0.1 <0.001 Total cholesterol, mg/dL 202±34 201±34 204±35 NS
HDL-C, mg/dL 58±14 56±13 61±14 NS
LDL-C, mg/dL 125±31 126±31 123±30 NS
Triglycerides, mg/dL 101±50 103±45 98±57 NS 25OH-vitamin D 31.6±18.2 33.6±20.8 27.8±11.4 NS
TSH, mU/L 3.1±2.3 3.4±2.8 2.6±1.3 NS
Values are presented as mean±standard deviation or number (%).
NS, not significant; HbA1c, glycated hemoglobin; HOMA-IR, ho- meostasis model assessment-insulin resistance index; HOMA-β, ho- meostasis model assessment-β cell function index; HDL-C, high density lipoprotein cholesterol; LDL-C, low density lipoprotein cho- lesterol; TSH, thyroid stimulating hormone.
Fig. 1. Distribution of thyroid disorders in the study sample. (A) Prevalence of thyroid disorders in adults with Down syndrome (n=51). (B) Prevalence of thyroid disorders in control subjects (n=51).
Euthyroid Hypothyroid Hyperthyroid
A
Situation at evaluation
Euthyroid Hypothyroid Hyperthyroid Prior diagnosis
15 17
14 3
2
B
Situation at evaluation
Euthyroid Hypothyroid Prior diagnosis
43
4 3 1
Anthropometric differences in adults with DS
The baseline characteristics of the participants are presented in Table 1. Adults with DS were significantly younger (36±11 years vs. 42.5±12.5 years; difference in means –6.5 years; 95%
confidence interval [CI], –11.1 to –1.9; P<0.01), more frequent- ly men (31 men with DS [61%] vs. 20 controls [39%]; P<0.05), and showed a higher prevalence of overweight and obesity than controls (normal weight, 13 adults with DS [25.5%] vs. 31 con- trols [61%]; overweight, 19 adults with DS [37%] vs. 13 controls [25.5%]; obesity, 19 adults with DS [37%] vs. 7 controls [14%];
P<0.001 for the distribution). Adults with DS had a higher waist-to-height ratio (0.62±0.09 vs. 0.54±0.08, difference in means 0.08; 95% CI, 0.05 to 0.11; P<0.001) and were more prevalently classified as having abdominal obesity with this in- dex (44 adults with DS [86%] vs. 35 controls [68%]; P<0.05).
These differences remained unchanged after adjusting the anal- ysis for age and gender.
Clinical differences in adults with DS
Coexisting conditions and dietary habits are also listed in Ta- ble 1. None of the adults with DS presented arterial hyperten- sion or had ever smoked (P<0.01 for both comparisons with controls). Two adults with DS were newly diagnosed with dia- betes mellitus during the study; and a new diagnosis of meta- bolic syndrome was reached in five adults with DS. Although most participants in both groups presented a high daily fat in- take, regular use of olive oil in cooking accounted for most of the excess observed in both groups. Thyroid-related disorders were more frequent in adults with DS, and their distribution in the study groups is depicted in Fig. 1. Out of 34 adults with DS and a prior diagnosis of hypothyroidism, 14 presented subclinical hypothyroidism (average TSH, 6.2±3.3 mU/L),
and three more presented iatrogenic subclinical hyperthyroid- ism at evaluation. Only one participant had low FT4 levels. A prior diagnosis of hypothyroidism was detected in eight con- trols, of whom three presented subclinical hypothyroidism at the time of the evaluation. Average TSH levels were similar in adults with DS and controls (Table 2).
Regarding the use of medication, adults with DS more often received antidepressants (14 adults with DS vs. 2 controls;
P<0.01), neuroleptic drugs (5 adults with DS vs. 0 controls;
P<0.05), vitamin D supplements (21 adults with DS vs. 0 con- trols; P<0.001), and levothyroxine (26 adults with DS vs. 5 con- trols; P<0.001). All antidepressants were selective serotonin up- take inhibitors, and all were prescribed at doses equivalent to sertraline 100 mg once daily or lower. Antihypertensive agents were more frequently taken by controls (0 adults with DS vs. 6 controls; P<0.05). Statins were taken by six adults with DS and three controls (P=not significant). No other relevant differences in medication were found between the groups.
Evaluation of biochemical parameters of insulin resistance and lipid metabolism
Mean laboratory values are reported in Table 2. Adults with DS had higher fasting insulin levels and a higher prevalence of im- paired fasting glucose, although this difference did not reach statistical significance. Both HOMA indexes were also higher in adults with DS, who presented a higher prevalence of insulin resistance than controls, according to HOMA-IR values. How- ever, this statistically significant difference in HOMA indexes did not remain after adjusting the analysis for age and gender (HOMA-IR preadjustment P<0.05, postadjustment P=0.22 [95% CI, –0.5 to 2.2]; and HOMA-β preadjustment P<0.01, postadjustment P=0.1 [95% CI, –9.1 to 95]). A multiple logis-
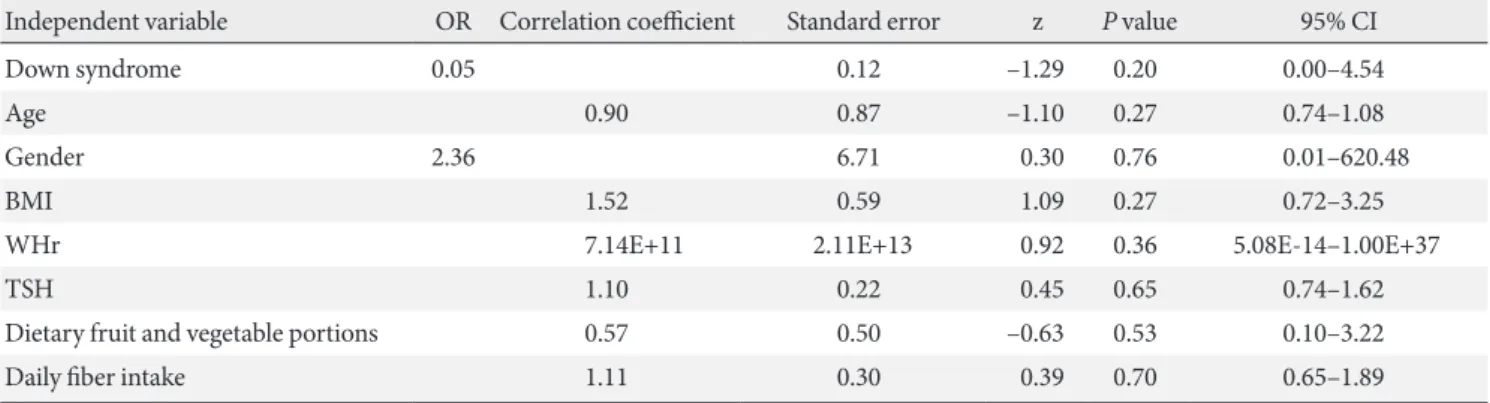
Table 3. Multivariate analysis of possible predictors of insulin resistance in a cohort of adults with Down syndrome Independent variable OR Correlation coefficient Standard error z P value 95% CI
Down syndrome 0.05 0.12 –1.29 0.20 0.00–4.54
Age 0.90 0.87 –1.10 0.27 0.74–1.08
Gender 2.36 6.71 0.30 0.76 0.01–620.48
BMI 1.52 0.59 1.09 0.27 0.72–3.25
WHr 7.14E+11 2.11E+13 0.92 0.36 5.08E-14–1.00E+37
TSH 1.10 0.22 0.45 0.65 0.74–1.62
Dietary fruit and vegetable portions 0.57 0.50 –0.63 0.53 0.10–3.22
Daily fiber intake 1.11 0.30 0.39 0.70 0.65–1.89
OR, odds ratio; CI, confidence interval; BMI, body mass index; WHr, waist-to-height ratio; TSH, thyroid stimulating hormone.
tic regression analysis was performed to identify possible de- terminants of IR in adults with DS. All variables with a statisti- cally significant difference between groups were selected for the final analysis, which included age, gender, BMI, waist-to- height ratio, abdominal fat percentage, TSH levels, and daily fruit and fiber intake. However, none of the variables present- ed a significant correlation with the degree of IR in this popu- lation (Table 3).
DISCUSSION
Abdominal obesity was highly prevalent among adults with DS in our study. Eight out of 10 adults with DS in our sample had a waist-to-height ratio greater than 0.5, and over two-thirds pre- sented overweight or obesity according to their BMI. However, impaired glucose tolerance and insulin resistance were not more frequent among individuals with DS, and no relevant differenc- es in lipid profile were found between the groups.
The proportion of weight-related disorders in our sample is somewhat lower than previously reported. Prasher [12] and Fujiura et al. [30] observed higher rates of obesity among adults with DS (47% of women and 48% of men and 43% of women and 25% of men respectively). Rubin et al. [31] found a higher rate of overweight individuals in this population (56% of wom- en and 45% of men), whereas Melville et al. [11] reported a lower prevalence of obesity. However, direct comparisons with prior series are cumbersome owing to the use of different diag- nostic BMI cutoff points. To our knowledge, this is the first re- port of weight-related disorders in adults with DS living in the community in a Mediterranean setting. In our study, adults with DS ate more daily fruit and vegetables and dietary fiber than controls. Regular use of olive oil in cooking accounted for the excess in dietary fat observed in both groups. These differ- ences could have partially accounted for the lower prevalence of overweight and obesity compared with cohorts in which a Mediterranean diet was not followed [32].
Surprisingly, differences were not observed in insulin resis- tance parameters or in the lipid profile between groups, even though adults with DS presented higher rates of subclinical hy- pothyroidism and more regular use of medications which are known to predispose to metabolic disorders, such as selective serotonin uptake inhibitors or neuroleptics [33,34]. These find- ings contrast with those of prior studies, where lower HDL-C and higher triglyceride levels were consistently documented in children and adults with DS [12,13]. Nevertheless, when care-
fully evaluated, the mean differences in lipid levels observed in those studies, although statistically significant, were not clini- cally relevant. Furthermore, despite a higher prevalence of ab- dominal obesity, previous studies were unable to demonstrate a predominance of metabolic syndrome in adults with DS when compared to persons with other types of intellectual disability or healthy controls [35]. Moreover, the role of subclinical hypo- thyroidism in lipid metabolism when TSH levels are only mod- erately elevated (as in our cohort) remains open to debate [36].
Since TSH levels were not related to insulin resistance in our multivariate analysis, we believe that these factors did not play a major role in explaining present results. Moreover, other drugs, such as antipsychotics, were prescribed at a low dose.
We agree with Adelekan et al. [13] that a possible explanation for these surprising findings could be the peculiar balance be- tween leptin and adiponectin in individuals with DS. Corsi et al. [37] described relative leptin resistance and higher levels of adiponectin in individuals with DS. Surprisingly, Corsi et al.
[37] found that leptin levels decreased with age, whereas adipo- nectin levels were higher in adults and elderly persons with DS.
This pathogenic pathway has yet to be explored. The possible effect of a Mediterranean diet in our population could also ex- plain their improved lipid profile [38].
Our study has several strengths. Biological siblings were used as controls, thus reducing the effect of potential genetic and environmental factors. We collected relevant metabolic and anthropometric variables and performed a multivariate analysis to correct our results for possible confounders. Our in- clusion criteria were broad, enabling our results to be general- ized to most adults with DS. Our study is also subject to a num- ber of limitations. The loss of data related to the refusal to give a blood sample, especially in the control group, left a small sam- ple for laboratory analysis, thus minimizing potential differ- ences in insulin resistance indexes or in the lipid profile. Fur- thermore, families willing to participate in our study may have siblings with more complex medical needs.
In this study, the prevalence of weight-related disorders (ab- dominal obesity, overweight, and global obesity) was very high in adults with DS. However, the lipid profile and the prevalence of insulin resistance and metabolic syndrome in this group was very similar to that of controls. The effect of the Mediterranean diet and the role of the leptin-adiponectin pathway warrant further investigation.
CONFLICTS OF INTEREST
No potential conflict of interest relevant to this article was re- ported.
ACKNOWLEDGMENTS
DRA and PP contributed equally to the completion of the study and to drafting the manuscript. DRA, PP, and RC participated in the study design, recruited the participants, reviewed the medical records, and performed the study procedures. DRA and PP performed the statistical analysis and drafted the manu- script. CS and FM conceived the study, helped with its design, and coordinated the recruitment of participants. CS collaborat- ed in the final draft of the manuscript. All authors have read and approved the final version of the manuscript. The authors would like to thank Mr. T. O’Boyle for his kind review of the fi- nal draft of the manuscript and Mr. F. Rodriguez for his help with the statistical analysis.
REFERENCES
1. World Health Organization. Global health risks: mortality and burden of disease attributable to selected major risks. Geneva:
World Health Organization; 2009.
2. Multiple Risk Factor Intervention Trial Research Group. Rela- tionship between baseline risk factors and coronary heart dis- ease and total mortality in the Multiple Risk Factor Interven- tion Trial. Prev Med 1986;15:254-73.
3. Kassi E, Pervanidou P, Kaltsas G, Chrousos G. Metabolic syn- drome: definitions and controversies. BMC Med 2011;9:48.
4. Expert Panel on Detection E, Treatment of High Blood Choles- terol in A. Executive summary of the third report of the Nation- al Cholesterol Education Program (NCEP) expert panel on de- tection, evaluation, and treatment of high blood cholesterol in adults (Adult Treatment Panel III). JAMA 2001;285: 2486-97.
5. Ervin RB. Prevalence of metabolic syndrome among adults 20 years of age and over, by sex, age, race and ethnicity, and body mass index: United States, 2003-2006. Natl Health Stat Report 2009:1-7.
6. Duncan GE, Li SM, Zhou XH. Prevalence and trends of a meta- bolic syndrome phenotype among U.S. adolescents, 1999-2000.
Diabetes Care 2004;27:2438-43.
7. Leal J, Luengo-Fernandez R, Gray A, Petersen S, Rayner M.
Economic burden of cardiovascular diseases in the enlarged Eu-
ropean Union. Eur Heart J 2006;27:1610-9.
8. Irving C, Basu A, Richmond S, Burn J, Wren C. Twenty-year trends in prevalence and survival of Down syndrome. Eur J Hum Genet 2008;16:1336-40.
9. Yang Q, Rasmussen SA, Friedman JM. Mortality associated with Down’s syndrome in the USA from 1983 to 1997: a population- based study. Lancet 2002;359:1019-25.
10. Kerins G, Petrovic K, Bruder MB, Gruman C. Medical condi- tions and medication use in adults with Down syndrome: a de- scriptive analysis. Downs Syndr Res Pract 2008;12:141-7.
11. Melville CA, Cooper SA, McGrother CW, Thorp CF, Collacott R. Obesity in adults with Down syndrome: a case-control study.
J Intellect Disabil Res 2005;49(Pt 2):125-33.
12. Prasher VP. Overweight and obesity amongst Down’s syndrome adults. J Intellect Disabil Res 1995;39(Pt 5):437-41.
13. Adelekan T, Magge S, Shults J, Stallings V, Stettler N. Lipid pro- files of children with Down syndrome compared with their sib- lings. Pediatrics 2012;129:e1382-7.
14. Murdoch JC, Rodger JC, Rao SS, Fletcher CD, Dunnigan MG.
Down’s syndrome: an atheroma-free model? Br Med J 1977;2:
226-8.
15. Bergholdt R, Eising S, Nerup J, Pociot F. Increased prevalence of Down’s syndrome in individuals with type 1 diabetes in Den- mark: a nationwide population-based study. Diabetologia 2006;
49:1179-82.
16. Yla-Herttuala S, Luoma J, Nikkari T, Kivimaki T. Down’s syn- drome and atherosclerosis. Atherosclerosis 1989;76:269-72.
17. Draheim CC, Geijer JR, Dengel DR. Comparison of intima- media thickness of the carotid artery and cardiovascular disease risk factors in adults with versus without the Down syndrome.
Am J Cardiol 2010;106:1512-6.
18. Rodrigues AN, Coelho LC, Goncalves WL, Gouvea SA, Vascon- cellos MJ, Cunha RS, Abreu GR. Stiffness of the large arteries in individuals with and without Down syndrome. Vasc Health Risk Manag 2011;7:375-81.
19. Moss TJ, Austin GE. Pre-atherosclerotic lesions in Down syn- drome. J Ment Defic Res 1980;24:137-41.
20. Hill DA, Gridley G, Cnattingius S, Mellemkjaer L, Linet M, Ad- ami HO, Olsen JH, Nyren O, Fraumeni JF Jr. Mortality and can- cer incidence among individuals with Down syndrome. Arch Intern Med 2003;163:705-11.
21. Day SM, Strauss DJ, Shavelle RM, Reynolds RJ. Mortality and causes of death in persons with Down syndrome in California.
Dev Med Child Neurol 2005;47:171-6.
22. Tsigos C, Hainer V, Basdevant A, Finer N, Fried M, Mathus-
Vliegen E, Micic D, Maislos M, Roman G, Schutz Y, Toplak H, Zahorska-Markiewicz B; Obesity Management Task Force of the European Association for the Study of Obesity. Manage- ment of obesity in adults: European clinical practice guide- lines. Obes Facts 2008;1:106-16.
23. Ashwell M, Gunn P, Gibson S. Waist-to-height ratio is a better screening tool than waist circumference and BMI for adult car- diometabolic risk factors: systematic review and meta-analysis.
Obes Rev 2012;13:275-86.
24. Browning LM, Hsieh SD, Ashwell M. A systematic review of waist-to-height ratio as a screening tool for the prediction of cardiovascular disease and diabetes: 0.5 could be a suitable global boundary value. Nutr Res Rev 2010;23:247-69.
25. Mancia G, De Backer G, Dominiczak A, Cifkova R, Fagard R, Germano G, Grassi G, Heagerty AM, Kjeldsen SE, Laurent S, Narkiewicz K, Ruilope L, Rynkiewicz A, Schmieder RE, Boudi- er HA, Zanchetti A, Vahanian A, Camm J, De Caterina R, Dean V, Dickstein K, Filippatos G, Funck-Brentano C, Hellemans I, Kristensen SD, McGregor K, Sechtem U, Silber S, Tendera M, Widimsky P, Zamorano JL, Erdine S, Kiowski W, Agabiti-Rosei E, Ambrosioni E, Lindholm LH, Viigimaa M, Adamopoulos S, Agabiti-Rosei E, Ambrosioni E, Bertomeu V, Clement D, Er- dine S, Farsang C, Gaita D, Lip G, Mallion JM, Manolis AJ, Nilsson PM, O’Brien E, Ponikowski P, Redon J, Ruschitzka F, Tamargo J, van Zwieten P, Waeber B, Williams B; Management of Arterial Hypertension of the European Society of Hyperten- sion; European Society of Cardiology. 2007 Guidelines for the management of arterial hypertension: the task force for the management of arterial hypertension of the European Society of Hypertension (ESH) and of the European Society of Cardiol- ogy (ESC). J Hypertens 2007;25:1105-87.
26. Block G, Gillespie C, Rosenbaum EH, Jenson C. A rapid food screener to assess fat and fruit and vegetable intake. Am J Prev Med 2000;18:284-8.
27. Matthews DR, Hosker JP, Rudenski AS, Naylor BA, Treacher DF, Turner RC. Homeostasis model assessment: insulin resis- tance and beta-cell function from fasting plasma glucose and insulin concentrations in man. Diabetologia 1985;28:412-9.
28. Ascaso JF, Romero P, Real JT, Priego A, Valdecabres C, Carme- na R. Insulin resistance quantification by fasting insulin plasma
values and HOMA index in a non-diabetic population. Med Clin (Barc) 2001;117:530-3.
29. American Diabetes Association. Diagnosis and classification of diabetes mellitus. Diabetes Care 2012;35(Suppl 1):S64-71.
30. Fujiura GT, Fitzsimons N, Marks B, Chicoine B. Predictors of BMI among adults with Down syndrome: the social context of health promotion. Res Dev Disabil 1997;18:261-74.
31. Rubin SS, Rimmer JH, Chicoine B, Braddock D, McGuire DE.
Overweight prevalence in persons with Down syndrome. Ment Retard 1998;36:175-81.
32. Bullo M, Garcia-Aloy M, Martinez-Gonzalez MA, Corella D, Fernandez-Ballart JD, Fiol M, Gomez-Gracia E, Estruch R, Ortega-Calvo M, Francisco S, Flores-Mateo G, Serra-Majem L, Pinto X, Covas MI, Ros E, Lamuela-Raventos R, Salas-Salvado J. Association between a healthy lifestyle and general obesity and abdominal obesity in an elderly population at high cardio- vascular risk. Prev Med 2011;53:155-61.
33. Colotto M, Vinci F, Vo Hong N, Raimo O, Castello A, Carnova- le A, Paciaroni A, Coletta P. Effect of treatment with selective serotonin reuptake inhibitors on lipid profile: state of the art.
Clin Ter 2012;163:e41-5.
34. Newcomer JW. Second-generation (atypical) antipsychotics and metabolic effects: a comprehensive literature review. CNS Drugs 2005;19 Suppl 1:1-93.
35. Draheim CC, McCubbin JA, Williams DP. Differences in car- diovascular disease risk between nondiabetic adults with men- tal retardation with and without Down syndrome. Am J Ment Retard 2002;107:201-11.
36. Pearce EN. Update in lipid alterations in subclinical hypothy- roidism. J Clin Endocrinol Metab 2012;97:326-33.
37. Corsi MM, Dogliotti G, Pedroni F, Galliera E, Malavazos AE, Villa R, Chiappelli M, Licastro F. Adipocytokines in Down’s syndrome, an atheroma-free model: role of adiponectin. Arch Gerontol Geriatr 2009;48:106-9.
38. Estruch R, Ros E, Salas-Salvado J, Covas MI, Corella D, Aros F, Gomez-Gracia E, Ruiz-Gutierrez V, Fiol M, Lapetra J, Lamuela- Raventos RM, Serra-Majem L, Pinto X, Basora J, Munoz MA, Sorli JV, Martinez JA, Martinez-Gonzalez MA; PREDIMED Study Investigators. Primary prevention of cardiovascular dis- ease with a Mediterranean diet. N Engl J Med 2013;368:1279-90.