Endocrinol Metab 2015;30:280-287
http://dx.doi.org/10.3803/EnM.2015.30.3.280 pISSN 2093-596X · eISSN 2093-5978
Original Article
Helicobacter pylori Stool Antigen Levels and Serological Biomarkers of Gastric Inflammation are Associated with Cardio-Metabolic Risk Factors in Type 2 Diabetic Patients
Zahra Bahadoran1, Parvin Mirmiran2, Maryam Zarif-yeaganeh1, Homayoun Zojaji3, Fereidoun Azizi4
1Nutrition and Endocrine Research Center and Obesity Research Center, Research Institute for Endocrine Sciences, 2Department of Clinical Nutrition and Diet Therapy, Faculty of Nutrition Sciences and Food Technology, National Nutrition and Food Technology Research Institute, 3Research Center for Gastroenterology and Liver Disease, Department of Gastroenterology and Liver Diseases, 4Endocrine Research Center, Research Institute for Endocrine Sciences, Shahid Beheshti University of Medical Sciences, Tehran, Iran
Background: Helicobacter pylori infection and subsequent gastric inflammation have been proposed as risk factors for the de- velopment of insulin resistance and cardiovascular disease. In this study we assessed the possible association of H. pylori bacteri- al load, and serum biomarker of gastric inflammation with cardiometabolic risk factors in diabetic patients.
Methods: In this cross-sectional study, 84 H. pylori-infected type 2 diabetic patients were assessed for anthropometrics, bio- chemical and clinical measurements. Pearson correlation test, linear, and logarithmic regression curve estimation models were used to assess the association of H. pylori stool antigen (HpSAg) levels, and pepsinogen I (PGI) to pepsinogen II (PGII) ratio with fasting serum glucose, insulin, serum lipid and lipoprotein parameters, malondialdehyde, high-sensitive C-reactive protein (hs-CRP), systolic and diastolic blood pressure, body weight, waist circumference and lipid accumulation product (LAP) index.
Results: The mean age of participants was 54±10 years, and 44% were men. Mean HpSAg levels and PGI/PGII ratio were 0.24±0.23 μg/mL and 9.9±9.0, respectively. Higher HpSAg as well as lower PGI/PGII was correlated with higher anthropomet- ric measures and LAP. A significant negative correlation between PGI/PGII ratio and blood pressure (r=–0.21 and r=–0.22, sys- tolic and diastolic, respectively, P<0.05), serum insulin (r=–0.17, P=0.05), and hs-CRP (r=–0.17, P=0.05) was observed. A significant linear association between PGI/PGII ratio with serum triglycerides (β=–0.24, P<0.05), serum high density lipopro- tein cholesterol (HDL-C; β=0.43, P<0.01), and triglycerides/HDL-C ratio (β=–0.28, P<0.05) were observed.
Conclusion: Higher H. pylori bacterial load and lower PGI/PGII ratio was associated with higher levels of cardiometabolic risk factors in H. pylori infected type 2 diabetic patients.
Keywords: Helicobacter pylori infection; Diabetes mellitus, type 2; Pepsinogens; Gastric inflammation; Cardiometabolic risk factors
Received: 15 June 2014, Revised: 26 October 2014, Accepted: 13 November 2014
Corresponding author: Parvin Mirmiran
Department of Clinical Nutrition and Diet Therapy, Faculty of Nutrition Sciences and Food Technology, National Nutrition and Food Technology Research Institute, Shahid Beheshti University of Medical Sciences, No. 46 Arghavan-e-gharbi St, Farahzadi Blv, Shahrak-e-Ghods, Tehran 19395-4741, Iran
Tel: +98-21-224-32-500, Fax: +98-21-224-16-264, E-mail: [email protected]
Copyright © 2015 Korean Endocrine Society
This is an Open Access article distributed under the terms of the Creative Com- mons Attribution Non-Commercial License (http://creativecommons.org/
licenses/by-nc/3.0/) which permits unrestricted non-commercial use, distribu- tion, and reproduction in any medium, provided the original work is properly cited.
INTRODUCTION
Helicobacter pylori infection is a common worldwide infec- tious disease affecting more than half of the world’s population [1]. Current data indicate that the prevalence of H. pylori infec- tion in type 2 diabetic patients is higher than the nondiabetics, suggesting a possible association between H. pylori infection and development of type 2 diabetes [2,3]. Furthermore, some investigations propose that H. pylori infection may be a major contributing factor for development of insulin resistance, sub- clinical inflammation, long-term diabetes complications, and cardiovascular risk factors, but there is limited data supporting this controversial association [4-6]. H. pylori infection may af- fect pancreatic β-cell function and insulin metabolism through induction of proinflammatory cytokines and oxidative stress [7]; H. pylori infection could also disturb lipid and lipoprotein metabolism and lead to increase serum levels of triglycerides, total cholesterol, low density lipoprotein cholesterol (LDL-C), apolipoprotein B (apo B), as well as decrease in apolipoprotein A and high density lipoprotein cholesterol (HDL-C) levels [8- 10]. Although it is suggested that these undesirable abnormali- ties induced by H. pylori may increase the risk of cardiovascu- lar disease especially in diabetic patients, but data available on this hypothesis are controversial [11,12]. Whereas it seems to be important, far too little attention has been paid to the quanti- tative association between H. pylori bacterial load and cardio- metabolic risk factors.
Abnormal levels of pepsinogen I (PGI) and pepsinogen II (PGII; two zymogen forms of pepsin originated from mucosal cell of stomach) observed in H. pylori infection and chronic gastric inflammation, have been also observed in relation to some metabolic disorders [13-15]; however, any potential as- sociations of these biomarkers of H. pylori-induced chronic gastritis, especially PGI to PGII ratio, with glucose homeosta- sis parameters and cardiometabolic risk factors in diabetic pa- tients have been less investigated.
In this cross-sectional study we aimed to investigate the as- sociation of the severity of active H. pylori infection (H. pylori stool antigen [HpSAg] levels), PGI to PGII ratio with insulin resistance, subclinical inflammation, lipids and lipid peroxida- tion, blood pressure (BP), anthropometric measurements and lipid accumulation product (LAP) in H. pylori infected type 2 diabetic patients.
METHODS
Study population
This study was conducted from April 2012 to January 2013.
Men and women, aged 25 to 60 years, clinically diagnosed with type 2 diabetes for at least the past 1 year were recruited from the Iran Diabetes Society and the Endocrine Clinic of Taleghani Medical Center. Three hundred sixty-two type 2 dia- betic patients were assessed for eligibility, and some potential participants were deemed ineligible if they had been treated in the past for H. pylori, consumed proton pump inhibitors, H2 re- ceptor antagonists, bismuth compounds or antibiotics during the previous 4 weeks, had previous gastric surgery, had severe illness, gestation, or lactation and if they used estrogen, or any other supplements. Finally, 191 patients delivered stool sam- ples for assessment of H. pylori infection.
Informed written consents were obtained from all partici- pants. Ethics approval for the trial was obtained from Ethical Committee of the Research Institute for Endocrine Sciences of the Shahid Beheshti University of Medical Sciences.
H. pylori stool antigen test
Stool specimens were taken and tested using the HpSAg en- zyme-linked immunosorbent assay (ELISA) kits (ACON labo- ratories Inc., San Diego, CA, USA), according to the manufac- turers’ instructions. H. pylori infection status of the participants was determined as follows: HpSAg ≥0.055 μg/mL as positive, 0.045≤HpSAg<0.055 μg/mL as borderline, and HpSAg
<0.045 μg/mL as negative. The inter- and intra-assay coeffi- cients of variation of the assay were both <5%.
Demographics, anthropometrics, and clinical measurement
Trained interviewers collected information using pretested questionnaires. Information on age, educational levels, medical history and medications, duration of diabetes, and oral antidia- betic drugs, were collected.
Anthropometric measurements were assessed by trained staff. Weight was measured to the nearest 100 g using digital scales, while the subjects were minimally clothed, without shoes. Height was measured to the nearest 0.5 cm, in a stand- ing position without shoes, using a tape meter. Waist circum- ference (WC) was measured to the nearest 0.1 cm, midway be- tween the lower border of the ribs and the iliac crest at the wid- est portion, over light clothing, using a soft measuring tape, without any pressure to the body. Body mass index was calcu-
lated as weight (kg) divided by square of the height (m2).
For BP measurements, after a 15-minute rest in the sitting position, two measurements of BP were taken, on the right arm, using a standardized mercury sphygmomanometer; the mean of the two measurements was considered as the participant’s BP.
Biochemical measurement
For all biochemical measurements, 12-hour fasting blood sam- ples were collected into tubes containing 0.1% ethylenediami- netetraacetic acid and were centrifuged at 4°C and 500 g for 10 minutes to separate plasma. PGI/PGII ratio was measured as a reliable serological biomarker of H. pylori-induced gastric in- flammation; PGI/PGII ratio <3 was considered as atrophic gastritis [13]. To determine PGI and PGII concentrations, ELI- SA kits (Cusabio Biotech, Wuhan, China) were used. Inter- and intra-assay coefficients of variation of the assays were both 5.8%.
Fasting serum glucose was measured by the enzymatic colo- rimetric method using a glucose oxidation kit (Pars Azmun Co., Tehran, Iran). Serum insulin concentrations were mea- sured using ELISA kit (Mercodia, Uppsala, Sweden). The in- ter- and intra-assay coefficients of variation of the assay were both <5%. Insulin resistance was estimated using the homeo- stasis model assessment of insulin resistance (HOMA-IR) in- dex, which is defined as fasting plasma insulin (mU/L) times the fasting plasma glucose (mmol/L) divided by 22.5.
Serum total cholesterol and triglyceride levels were mea- sured by enzymatic colorimetric analysis with cholesterol es- terase and cholesterol oxidase and glycerol phosphate oxidase, respectively (Pars Azmun Co.). HDL-C was measured by the immunoturbidimetry method after precipitation of apo B con- taining lipoproteins with phosphotungstic acid (Pars Azmun Co.). LDL-C was calculated from serum total cholesterol, tri- glycerides, and HDL-C, according to the Friedewald equation.
Serum high-sensitive C-reactive protein (hs-CRP) (pg/mL) concentration was measured by using ELISA kit (Diagnostics Biochem Canada Inc., Dorchester, ON, Canada). Serum malo- ndialdehyde (MAD) was measured spectrophotometrically by the thiobarbituric acid assay kit (Cayman Chemical Inc., Ann Arbor, MI, USA). Inter- and intra-assay coefficients of varia- tions of all assays were <5%. LAP index, a novel central lipid accumulation and predictor of metabolic syndrome, cardiovas- cular disease, was calculated as follows: in men [WC (cm)–
65]×[triglycerides (mmol/L)], and in women [WC (cm)–58]×
[triglycerides (mmol/L)] [15,16].
Statistical methods
The Kolmogorov-Smirnov test was used to test for normal dis- tribution; if the variable was not normally distributed, loga- rithm of the skewed variable was entered in the models. The PGI/PGII ratio were categorized into quartiles; cardiometabolic risk factors of the patients were compared across the quartile categories using the general linear models with adjustment of age, gender, antidiabetic and antilipidemic drugs, and duration of diabetes. To clarify the association of HpSAg levels, pepsin- ogen levels, and PGI/PGII ratio with cardiometabolic risk fac- tors, the two-tailed Pearson correlation test was used. To better estimate the association of PGI/PGII ratio and cardiometabolic risk factors, linear or logarithmic regression curve estimation models were also conducted and significant associations were presented as plots. Statistical analysis was performed with SPSS version 16.0 (SPSS Inc., Chicago, IL, USA). A P<0.05 was considered significant.
RESU LTS
Among 191 type 2 diabetic patients assessed for H. pylori in- fection, using the stool antigen test, 56.6% (108) were diag- nosed as H. pylori positive, 5.2% were borderline and 38.2%
were negative. Of the 108 H. pylori positive patients, 84 pa- tients agreed to complete the study for biochemical assessment, clinical and anthropometric measurements. The mean age of participants was 54±10 years, and 44% were men. Mean Hp- SAg levels and PGI/PGII ratio were 0.24±0.23 μg/mL and 9.9±9.0, respectively. The range of PGI/PGII ratio was <3.08, 3.08 to 5.94, 5.95 to 15.55, and >15.55 in the 1st, 2nd, 3rd, and 4th, respectively; the range of PGI/PGII ratio in the first quar- tile was accordant with the cutoff point of gastric atrophy. Ta- ble 1 presents the characteristics, and the biochemical measure- ments, BP and anthropometric values of the participants across quartile categories of PGI/PGII ratio. A significant decreasing trend of HpSAg levels was observed across increasing PGI/
PGII ratio. Participants in the lowest, compared to the highest, quartile category of PGI/PGII ratio had higher weight (85±3.5 kg vs. 78±4.5 kg) and WC (105±3 cm vs. 98±3 cm); systolic and diastolic BP also was nonsignificantly higher in patients with lower PGI/PGII ratio. No significant differences were ob- served in serum fasting glucose, insulin and HOMA-IR across quartile categories of PGI/PGII ratio. Serum triglyceride levels decreased (135±15 mg/dL vs. 92±20 mg/dL, in first and fourth quartiles respectively, P=0.06) and HDL-C levels sig- nificantly increased (28.6±0.7 mg/dL vs. 32.0±0.9 mg/dL, in
first and fourth quartiles respectively, P=0.01) across increas- ing trend of PGI/PGII ratio. Triglycerides/HDL-C ratio also significantly decreased (4.7±0.6 mg/dL vs. 2.9±0.7 mg/dL, in first and fourth quartiles respectively, P=0.01) across quartile categories of PGI/PGII ratio. Serum levels of MAD and hs- CRP statistically were similar across quartile categories of PGI/
PGII ratio.
A significant correlation between HpSAg levels with PGI (r=0.24, P<0.05) was observed. Person correlation coeffi- cients of HpSAg levels, serum pepsinogens and PGI/PGII ratio with cardiometabolic risk factors are presented in Table 2.
Weight and WC were positively correlated with HpSAg levels and PGII, and were negatively correlated with PGI/PGII ratio.
Serum PGI and PGI/PGII ratio were negatively correlated with both systolic and diastolic BP, fasting serum insulin, and hs- CRP. A significant positive association between PGI and PGI/
PGII ratio with HDL-C, and a negative association between PGII and HDL-C were observed. Serum triglyceride levels were significantly correlated with PGII (r=0.27, P<0.01) and PGI/PGII ratio (r=–0.26, P<0.01). Triglyceride to HDL-C ra- tio also was positively correlated with PGII and negatively cor- related PGI/PGII ratio. There is a considerable association be- tween LAP index and HpSAg levels (r=0.21, P<0.05), PGII (r=0.34, P<0.01), and PGI/PGII ratio (r=–0.29, P<0.01).
Curve estimation plots are presented in Fig. 1. A significant linear association of PGI/PGII ratio with serum triglycerides Table 1. Demographics, Anthropometric Measurements, and Cardiometabolic Risk Factors of the Patients by Categories of Serologi- cal Marker of Gastric Inflammation
Characteristic PGI/PGII ratio
<3.08 (n=21) 3.08–5.94 (n=21) 5.94–15.55 (n=21) >15.55 (n=21) P valuea
Age, yr 55.6±8.9 53.5±10.7 55.0±11.4 53.4±9.2 0.64
Male sex, % 71.4 33.3 28.6 42.9 0.06
Antidiabetic drugs, n 17 22 18 21 0.44
Antilipidemic drugs, n 19 15 14 16 0.65
HpSAg levels, μg/mL 0.31±0.05 0.26±0.05 0.21±0.6 0.14±0.07 0.05
PGI, ng/mL 28.8±3.1 31.0±3.1 41.9±3.2 66.0±4.1 0.01
PGII, ng/mL 15.1±1.6 7.6±1.6 4.5±1.6 2.8±2.1 0.01
PGI/PGII ratio 2.1±0.9 4.2±0.9 9.9±0.9 24.8±1.1 0.01
Weight, kg 85±3.5 78±3.5 78±3.6 78±4.5 0.35
Waist circumference, cm 105±3 96±3 98±3 98±3 0.05
Systolic blood pressure, mm Hg 134±9 111±10 111±10 112±11 0.23
Diastolic blood pressure, mm Hg 86±6 74±7 70±7 72±8 0.60
Fasting serum glucose, mg/dL 156±13 163±13 159±13 171±13 0.13
Fasting serum insulin, mU/L 8.8±1.0 8.1±1.0 7.5±1.1 8.3±1.3 0.27
HOMA-IR 3.1±0.5 3.3±0.5 3.2±0.5 3.6±0.6 0.89
Total cholesterol, mg/dL 169±8 163±0.8 148±8 154±9 0.17
Triglycerides, mg/dL 135±15 123±15 111±17 92±20 0.06
HDL-C, mg/dL 28.6±0.7 28.4±0.7 28.8±0.7 32.0±0.9 0.01
LDL-C, mg/dL 114±6 117±6 100±6 109±8 0.15
Triglycerides/HDL-C ratio 4.7±0.6 4.4±0.6 3.9±0.6 2.9±0.7 0.01
Lipid accumulation index 68.8±8.4 48.2±8.9 46.8±8.4 40.9±10.1 0.17
Malondialdehyde, μmol/L 7.3±0.6 6.0±0.6 6.7±0.6 6.7±0.7 0.59
hs-CRP, ng/mL 2.8±0.5 3.5±0.5 2.4±0.6 2.8±0.7 0.35
Values are expressed as age-adjusted mean±SEM unless otherwise indicated.
HpSAg, Helicobacter pylori stool antigen; PGI, pepsinogen I; PGII, pepsinogen II; HOMA-IR, homeostasis model assessment of insulin resistance;
HDL-C, high density lipoprotein cholesterol; LDL-C, low density lipoprotein cholesterol; hs-CRP, high-sensitive C-reactive protein.
aP values compared the mean values across quartile categories of PGI/PGII ratio using analysis of covariance (with adjustments for age, sex, antidia- betic and antilipidemic drugs, duration of diabetes) or Jonckheere-Terpstra test.
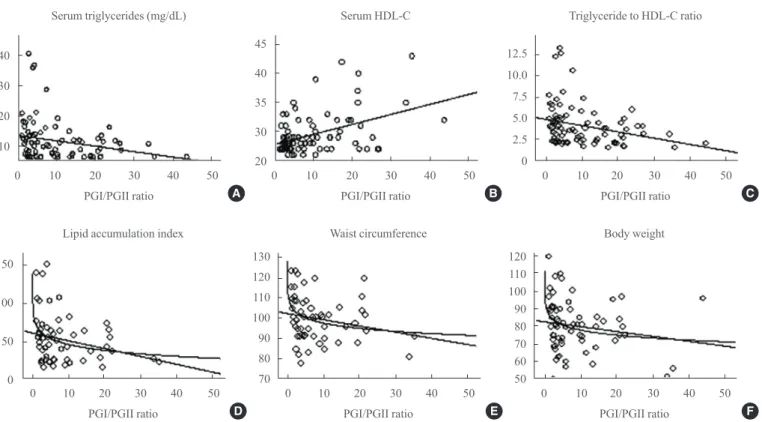
(β=–0.24, P<0.05), serum HDL-C (β=0.43, P<0.01), and tri- glycerides/HDL-C ratio (β=–0.28, P<0.05) was observed. A significant logarithmic association was also observed between the PGI/PGII ratio and LAP (β=–0.31, P<0.05), WC (β=–0.30, P<0.05), and body weight (β=–0.26, P<0.05).
DISCUSSION
The results of this cross-sectional study on type 2 diabetic pa- tients with active H. pylori infection provided some evidence for possible association of HpSAg levels, serological biomark- ers of gastric inflammation and cardiometabolic risk factors.
In this study, HpSAg levels were negatively correlated with PGI/PGII ratio, body weight and WC (Table 2). Serum levels of PGI were negatively associated with systolic and diastolic BP, fasting serum insulin, hs-CRP, and positively correlated with HDL-C levels. Higher levels of serum PGII were related to higher weight and WC, fasting serum glucose, triglyceride levels, triglycerides to HDL-C ratio, and lower levels of HDL- C (Table 2). Moreover, PGI/PGII ratio was negatively correlat- ed with anthropometric measures, BP, glucose homeostasis pa- rameters as well as atherosclerotic lipid and lipoprotein param-
eters and subclinical systemic inflammation (Table 2, Fig. 1).
Among both the invasive and non-invasive methods that have been developed to confirm H. pylori infection, stool anti- gen test is considered as an accurate, noninvasive, and cost-ef- fective method to diagnose active infection [17-19]; moreover, the levels of HpSAg quantitatively has been correlated with the bacterial load of H. pylori in the stomach, mucosal inflamma- tion and severity of gastritis [20]. However there is evidence that H. pylori infection is associated with cardiometabolic risk factors and development of insulin resistance and cardiovascu- lar disease [21,22], but it is unclear whether severity of H. py- lori bacterial load could quantitatively affect glucose and lipid homeostasis, systemic inflammation or oxidative stress. In the current study, H. pylori infection was quantitatively associated with higher weight and WC. The association between H. pylori infection and anthropometric measures is not yet well estab- lished and both weight loss and weight gain outcomes were re- ported after H. pylori eradication [23,24]. Recent investigations have been proposed that circulating ghrelin (a peptide originat- ed from stomach and regulator of food intake, body fat, and in- sulin secretion) may be a possible link between H. pylori and body weight [25,26]. There is no consensus in this regard;
Table 2. The Association of Helicobacter pylori Stool Antigen Levels, Serological Marker of Gastric Inflammation, and Cardiometa- bolic Risk Factors in Diabetic Patients
Variable HpSAg levels, μg/mL PGI, ng/mL PGII, ng/mL PGI/PGII ratio
Coefficient r P value Coefficient r P value Coefficient r P value Coefficient r P value
Weight, kg 0.26 0.02 –0.05 0.35 0.28 0.01 –0.24 0.02
Waist circumference, cm 0.24 0.03 –0.04 0.39 0.35 0.01 –0.29 0.01
Systolic blood pressure, mm Hg 0.06 0.31 –0.20 0.05 0.14 0.14 –0.21 0.04
Diastolic blood pressure, mm Hg 0.07 0.29 –0.24 0.03 0.11 0.19 –0.22 0.04
Fasting serum glucose, mg/dL –0.15 0.08 0.06 0.29 0.19 0.04 0.18 0.06
Fasting serum insulin, mU/L –0.30 0.39 –0.18 0.05 0.10 0.17 –0.17 0.05
HOMA-IR –0.11 0.16 –0.13 0.12 –0.01 0.47 –0.06 0.29
Total cholesterol, mg/dL 0.15 0.08 –0.12 0.14 0.07 0.26 –0.12 0.14
Triglycerides, mg/dL 0.07 0.26 –0.11 0.15 0.27 0.01 –0.26 0.01
HDL-C, mg/dL –0.08 0.22 0.36 0.01 –0.27 0.01 0.40 0.01
LDL-C, mg/dL 0.13 0.12 –0.16 0.08 –0.06 0.29 –0.03 0.38
Triglycerides/HDL-C ratio 0.04 0.34 –0.12 0.14 0.29 0.01 –0.29 0.01
Lipid accumulation index 0.21 0.05 –0.03 0.41 0.34 0.01 –0.29 0.01
Malondialdehyde, μmol/L 0.06 0.29 0.02 0.42 0.02 0.43 –0.05 0.48
hs-CRP, ng/mL 0.03 0.39 –0.18 0.05 0.10 0.17 –0.17 0.05
Pearson correlation test was used.
HpSAg, Helicobacter pylori stool antigen; PGI, pepsinogen I; PGII, pepsinogen II; HOMA-IR, homeostasis model assessment of insulin resistance;
HDL-C, high density lipoprotein cholesterol; LDL-C, low density lipoprotein cholesterol; hs-CRP, high-sensitive C-reactive protein.
however a systematic review and meta-analysis of the current data recently showed that H. pylori infected subjects compared to noninfected had lower levels of circulating ghrelin [27]. On the other hand, there is evidence showing that acylated ghrelin (active ghrelin)/total ghrelin levels had higher in patients with chronic atrophic gastritis [28]; acylated ghrelin could induce food intake, increase adiposity and fat gain, as well as insulin resistance [29]. Higher levels of acylated and lower levels of deacylated ghrelin have been reported in obese and diabetic patients, and fasting levels of acylated ghrelin was positively correlated with fat mass [30]. Based on this evidence, the asso- ciation of HpSAg levels and anthropometric measures ob- served in the current study could partly be explained. Another important finding of this study was a positive correlation of HpSAg levels and LAP index; this index is a simple and accu- rate clinical indicator of metabolic syndrome and insulin resis- tance as well as predictor of cardiovascular disease [16,31].
Our finding are in agreement with investigations reporting that chronic H. pylori infection could induce insulin resistance, and
disturb both glucose and lipid homeostasis, and metabolism of adipocytokines [22,32].
Recently, serum PG levels have been more considered as noninvasive biomarkers of H. pylori-induced gastric inflamma- tion, and decreased serum PGI to PGII ratio has been used as an indicator of gastric mucosal atrophy [13]; moreover, a cor- relation between PGs levels and PGI to PGII ratio with meta- bolic parameters has been shown [14,15]. In this study, patients with higher levels of HpSAg also had higher levels of PGII, lower levels of PGI to PGII ratio. Previously, comparison be- tween H. pylori positive and negative patients showed that the levels of PGI and PGI/II ratio were lower and PGII was higher in H. pylori infected patients [33].
In the current study, higher levels of triglycerides, triglycer- ides/HDL-C ratio, central lipid accumulation, and lower HDL- C level were observed in patients categorized as atrophic gas- tritis (PGI/PGII ratio <3). PGI/PGII ratio had also considerable correlation with cardiometabolic parameters and systemic in- flammatory markers. Another important finding of this study
Serum triglycerides (mg/dL)
PGI/PGII ratio 40
30 20 10
0 10 20 30 40 50
PGI/PGII ratio 45
40 35 30 20
Serum HDL-C
0 10 20 30 40 50
Triglyceride to HDL-C ratio
PGI/PGII ratio 12.5
10.0 7.5 5.0 2.5
0 0 10 20 30 40 50
A B C
Lipid accumulation index
PGI/PGII ratio 150
100
50
0 0 10 20 30 40 50
Waist circumference
PGI/PGII ratio 130
120 110 100 90 80
70 0 10 20 30 40 50
Body weight
PGI/PGII ratio 120
110 100 90 80 70 60
50 0 10 20 30 40 50
D E F
Fig. 1. Linear or logarithmic association of pepsinogen I to pepsinogen II ratio and cardiometabolic risk factors (regression curve estima- tion models were used). (A) A significant linear association of pepsinogen I (PGI)/pepsinogen II (PGII) ratio with serum triglycerides (β=–0.24, P<0.05). (B) A significant linear association of PGI/PGII ratio with serum high density lipoprotein cholesterol (HDL-C;
β=0.43, P<0.01). (C) A significant linear association of PGI/PGII ratio triglycerides/HDL-C ratio (β=–0.28, P<0.05). (D) A significant logarithmic association between the PGI/PGII ratio and lipid accumulation product (β=–0.31, P<0.05). (E) A significant logarithmic as- sociation between the PGI/PGII ratio and waist circumference (β=–0.30, P<0.05). (F) A significant logarithmic association between the PGI/PGII ratio and body weight (β=–0.26, P<0.05).
was a negative correlation of two independent predictors of cardiovascular disease, triglyceride to HDL-C ratio and lipid accumulation index, with PGI/PGII ratio. Data regarding the association of PGI/PGII ratio and metabolic and anthropomet- ric parameters are limited; contrary to with our results, two previous studies reported that PGI to PGII ratio was positively correlated with glucose, triacylglycerol, and uric acid levels in healthy subjects, as well as urinary albumin excretion in dia- betic patients [14,15]. Surprisingly, in a recent cross-sectional analysis of 819 apparently healthy men, PGI/PGII ratio were related to both low body weight and obesity [34]; considering this point of view, it is thought that the association of PG levels with cardiometabolic risk factors is more complicated, and may affected bysome conditions such as active H. pylori infec- tion, obesity, or diabetes.
To the best of our knowledge this study is the first investiga- tion on the correlation of H. pylori bacterial load and serologi- cal bacterial load with cardiometabolic risk factor in diabetic patients. Some limitations that should be considered in the cur- rent study are the cross-sectional setting and low sample sizes.
Moreover, some important variables including cardiovascular complications in diabetic patients have not been evaluated in this study. Further studies with large sample size and the as- sessment of other cardiovascular risk factors are needed to con- firm the relationship observed and related mechanisms.
In conclusion, the results of this study showed that higher H.
pylori bacterial load was associated with higher body weight and abdominal fat accumulation, and lower PGI/PGII ratio, as indicator of H. pylori-induced gastric inflammation, was asso- ciated with higher levels of cardiometabolic risk factors in H.
pylori infected type 2 diabetic patients.
CONFLICTS OF INTEREST
No potential conflict of interest relevant to this article was re- ported.
ACKNOWLEDGMENTS
This study was funded by the Research Institute of Endocrine Sciences, Shahid Beheshti University of Medical Sciences, Tehran, Iran. The authors express appreciation to the partici- pants of this study. The authors wish to thank Ms N. Shiva for critical editing of English grammar and syntax of the manu- script.
REFERENCES
1. Noto JM, Peek RM Jr. Helicobacter pylori: an overview.
Methods Mol Biol 2012;921:7-10.
2. Zhou X, Zhang C, Wu J, Zhang G. Association between He- licobacter pylori infection and diabetes mellitus: a meta- analysis of observational studies. Diabetes Res Clin Pract 2013;99:200-8.
3. Devrajani BR, Shah SZ, Soomro AA, Devrajani T. Type 2 diabetes mellitus: a risk factor for Helicobacter pylori in- fection: a hospital based case-control study. Int J Diabetes Dev Ctries 2010;30:22-6.
4. Ojetti V, Pellicano R, Fagoonee S, Migneco A, Berrutti M, Gasbarrini A. Helicobacter pylori infection and diabetes.
Minerva Med 2010;101:115-9.
5. Rossi C, Quadri R, Caval lo Perin P. Helicobacter pylori infection and diabetic complications. Diabetes Nutr Metab 2004;17:65-8.
6. de Luis DA, Lahera M, Canton R, Boixeda D, San Roman AL, Aller R, et al. Association of Helicobacter pylori infec- tion with cardiovascular and cerebrovascular disease in dia- betic patients. Diabetes Care 1998;21:1129-32.
7. He C, Yang Z, Lu NH. Helicobacter pylori infection and di- abetes: is it a myth or fact? World J Gastroenterol 2014;20:
4607-17.
8. Gen R, Demir M, Ataseven H. Effect of Helicobacter pylori eradication on insulin resistance, serum lipids and low-grade inflammation. South Med J 2010;103:190-6.
9. Laurila A, Bloigu A, Nayha S, Hassi J, Leinonen M, Saikku P. Association of Helicobacter pylori infection with elevat- ed serum lipids. Atherosclerosis 1999;142:207-10.
10. Chimienti G, Russo F, Lamanuzzi BL, Nardulli M, Messa C, Di Leo A, et al. Helicobacter pylori is associated with modi- fied lipid profile: impact on Lipoprotein(a). Clin Biochem 2003;36:359-65.
11. Danesh J, Peto R. Risk factors for coronary heart disease and infection with Helicobacter pylori: meta-analysis of 18 studies. BMJ 1998;316:1130-2.
12. Niemela S, Karttunen T, Korhonen T, Laara E, Karttunen R, Ikaheimo M, et al. Could Helicobacter pylori infection in- crease the risk of coronary heart disease by modifying se- rum lipid concentrations? Heart 1996;75:573-5.
13. Arinton IG. Serum gastrin level and pepsinogen I/II ratio as biomarker of Helicobacter pylori chronic gastritis. Acta Med Indones 2010;42:142-6.
14. Tanaka M, Fukui M, Kuroda M, Yamazaki M, Hasegawa G,
Oda Y, et al. Pepsinogen I/II ratio is related to glucose, tria- cylglycerol, and uric acid levels. Nutrition 2012;28:418-21.
15. Senmaru T, Fukui M, Kuroda M, Tanaka M, Ushigome E, Sakabe K, et al. Serum pepsinogen I/II ratio is correlated with albuminuria in patients with type 2 diabetes. Endocr J 2013;60:161-6.
16. Chiang JK, Koo M. Lipid accumulation product: a simple and accurate index for predicting metabolic syndrome in Tai- wanese people aged 50 and over. BMC Cardiovasc Disord 2012;12:78.
17. Gisbert JP, Pajares JM. Diagnosis of Helicobacter pylori infection by stool antigen determination: a systematic re- view. Am J Gastroenterol 2001;96:2829-38.
18. Gisbert JP, Pajares JM. Stool antigen test for the diagnosis of Helicobacter pylori infection: a systematic review. Heli- cobacter 2004;9:347-68.
19. Kazemi S, Tavakkoli H, Habizadeh MR, Emami MH. Diag- nostic values of Helicobacter pylori diagnostic tests: stool antigen test, urea breath test, rapid urease test, serology and histology. J Res Med Sci 2011;16:1097-104.
20. Chang MC, Chang YT, Sun CT, Wu MS, Wang HP, Lin JT.
Quantitative correlation of Helicobacter pylori stool anti- gen (HpSA) test with 13C-urea breath test (13C-UBT) by the updated Sydney grading system of gastritis. Hepatogas- troenterology 2002;49:576-9.
21. Gunji T, Matsuhashi N, Sato H, Fujibayashi K, Okumura M, Sasabe N, et al. Helicobacter pylori infection is significant- ly associated with metabolic syndrome in the Japanese population. Am J Gastroenterol 2008;103:3005-10.
22. Gunji T, Matsuhashi N, Sato H, Fujibayashi K, Okumura M, Sasabe N, et al. Helicobacter pylori infection significantly increases insulin resistance in the asymptomatic Japanese population. Helicobacter 2009;14:144-50.
23. Jalalzadeh M, Ghadiani MH, Mousavinasab N. Association between helicobacter pylori infection and body mass index, before and after eradication of infection in hemodialysis ba- tients. J Nephropathol 2012;1:170-6.
24. Osawa H, Kita H, Ohnishi H, Nakazato M, Date Y, Bowlus CL, et al. Changes in plasma ghrelin levels, gastric ghrelin
production, and body weight after Helicobacter pylori cure.
J Gastroenterol 2006;41:954-61.
25. Isomoto H, Ueno H, Saenko VA, Mondal MS, Nishi Y, Kawano N, et al. Impact of Helicobacter pylori infection on gastric and plasma ghrelin dynamics in humans. Am J Gas- troenterol 2005;100:1711-20.
26. Boltin D, Niv Y. Ghrelin, Helicobacter pylori and body mass:
is there an association? Isr Med Assoc J 2012;14:130-2.
27. Nweneka CV, Prentice AM. Helicobacter pylori infection and circulating ghrelin levels: a systematic review. BMC Gastroenterol 2011;11:7.
28. Campana D, Nori F, Pagotto U, De Iasio R, Morselli-Labate AM, Pasquali R, et al. Plasma acylated ghrelin levels are higher in patients with chronic atrophic gastritis. Clin Endo- crinol (Oxf) 2007;67:761-6.
29. Andrich DE, Cianflone K, Comtois AS, Lalonde S, St-Pierre DH. The endocrine effects of acylated and des-acylated ghrelin. Res Rep Endocr Disord 2012;2012:31-40.
30. Zwirska-Korczala K, Konturek SJ, Sodowski M, Wylezol M, Kuka D, Sowa P, et al. Basal and postprandial plasma levels of PYY, ghrelin, cholecystokinin, gastrin and insulin in women with moderate and morbid obesity and metabolic syndrome. J Physiol Pharmacol 2007;58 Suppl 1:13-35.
31. Kahn HS. The “lipid accumulation product” performs bet- ter than the body mass index for recognizing cardiovascular risk: a population-based comparison. BMC Cardiovasc Disord 2005;5:26.
32. Li M, Shen Z, Li YM. Potential role of Helicobacter pylori infection in nonalcoholic fatty liver disease. World J Gas- troenterol 2013;19:7024-31.
33. Bolukbas C, Bolukbas FF, Ovunc O, Kilic G, Dalay R, Gu- ven H, et al. Relationship between Helicobacter pylori sta- tus and serum pepsinogens as serologic markers in atrophic gastritis. Turk J Gastroenterol 2006;17:172-6.
34. Kutsuma A, Oshida H, Suwa K, Nakajima K. A possible as- sociation of low pepsinogen I and pepsinogen I/II with low and high body weight in Japanese men. Clin Biochem 2014;
47:126-8.