Clin Nutr Res 2014;3:126-133
http://dx.doi.org/10.7762/cnr.2014.3.2.126 pISSN 2287-3732 ∙ eISSN 2287-3740
This is an Open Access article distributed under the terms of the Creative Commons Attribution Non-Commercial License (http://creativecommons.org/licenses/by-nc/3.0/) which permits unrestricted non-commercial use, distribution, and reproduction in any medium, provided the original work is properly cited.
© 2014 The Korean Society of Clinical Nutrition
*Corresponding author Hyun-Jin Kim
Address Department of Food and Nutrition, Kongju National Univer- sity, 54 Daehak-ro, Yesan 340-702, Korea
Tel +82-41-330-1460 Fax +82-41-330-1469 E-mail [email protected]
Received June 9, 2014 Revised June 23, 2014 Accepted June 24, 2014
Introduction
South Korea has shown a widespread dine-out culture and a westernized dietary style, accompanied by the avoidance of vegetable intake by the youth and a rising obesity rate every year, emerging a serious issue of lifestyle diseases [1]. Lifestyle diseases such as obesity, diabetes and cardiovascular diseases are reported to possibly occur due to dietary habits and eating habits of the teenage period [2,3].
The adolescent period is a transient time from childhood to adulthood. It is the 2nd rapid growth period following the infancy. Also, in this period, adolescents experience dynamic physical, mental and emotional changes and build the concept of ego. The eating habit formed in this period consistently af-
Evaluation of Fruit Intake and its Relation to Body Mass Index of Adolescents
Eunah Ham
1, Hyun-Jin Kim
2*
1Major in Nutrition Education, Graduate School of Education, Kongju National University, Yesan 340-702, South Korea
2Department of Food and Nutrition, Kongju National University, Yesan 340-702, South Korea
Diets high in fruits and vegetables are recommended to maintain health. However, accurate fruit intake evaluation is hard and high sugar content in most of the fruits suggest possible negative relationships with health indices. The purpose of the pres- ent study was to evaluate the fruit intake status of adolescents and to examine the relationship between fruit intake and body mass index (BMI). For this, 400 middle and high school students were surveyed for their fruit eating attitude, preference, and intake level for fruit along with the evaluation of their relationship with anthropometric measures. As for fruit preference, the most frequent answer was ‘like very much’ (60.0%) and the preference of fruit was significantly higher in females than in males (p
< 0.01). The highest answer to the reason to like fruits was ‘delicious’ (67.0%). The highest proportion of subjects replied that the amount of fruit intake was similar in both school meals and at home (39.3%) and unlikable feeling of fruits was ‘sour’ (47.0%).
The favorite fruit was the apple followed by oriental melon, grape, Korean cherry, cherry, tangerine/orange, hallabong, plum, mango, persimmon, peach, pear/kiwi, apricot, Japanese apricot, and fig in order. As for the number of serving sizes per person were 2.9 times/day for male students and 3.0 times/day for female students showing no significant difference. The frequency of eating fruits in the evening showed a significant positive correlation with body weight (p < 0.05) and BMI (p < 0.01), respec- tively. In summary of these study findings, it was found that the fruit preference of adolescents was relatively high and their fruit intake level satisfied the recommended number of intake. The number of evening fruit intake had a significantly positive correlation with body weight and BMI. Further studies are required to examine the relationship between fruit intake and health indicators.
Key Words: Fruits, Body mass index, Adolescent
fect the adulthood and thus, the dietary life and eating habit of teenagers are important [4-6].
Fruits and vegetables help to buffer body fluid balancing the alkalinity originated from carbohydrate and meat intake [6,7].
Moreover, they help to lower blood glucose and cholesterol level, reducing the risk of lifestyle diseases such as diabetes, cardiovascular diseases and some cancers [6,8-10]. As such aspects are known, multiple studies and research efforts have continued to assess and increase the intake of plant foods.
However, sugar contents and energy content are greatly differ- ent in different plant foods. For this reason, in the 2005 Dietary Reference intakes (DRI) for Koreans, one single group of fruits and vegetables was separated into two different groups name- ly, the vegetable group and the fruit group. Also, the intake pattern of fruits and vegetables is different [11]. Vegetables are part of meals and fruits are independent of meals as a dessert or a refreshment. When the preference of food groups was analyzed in teenagers receiving school meals, it was reported that they tended not to eat vegetables making more leftovers whereas showed a higher preference for fruits [12].
As such, an evaluation was performed regarding the intake of these two groups which have mutually different charac- teristics. Vegetable group has been at the center of concern, while fruits have been dealt with less emphasis and accurate intake assessment has not been reported. Unlike previous re- ports showing that fruits and vegetables intake can prevent obesity, a larger consumption of fruits may possibly cause weight gain or obesity due to their high sugar content [13,14].
In this aspect, it is deemed necessary to further clarify the re- lationship between fruit intake and obesity.
The purpose of the present study was to evaluate the fruit intake status of adolescents and to examine the relationship between fruit intake and body mass index (BMI) for exploring ways to guide an appropriate fruit intake. To this end, middle and high school students were surveyed for their fruit intake status including fruit eating attitude, preference and intake level along with their correlation with anthropometric measurements.
Materials and Methods
Study subjects and period
The present study examined middle and high school students (60 female middle school students, 60 male middle school stu- dents, 150 female high school students and 150 male middle school students) in Buyeo-gun, Chungnam, South Korea for 4
days from May 2 to 5, 2012 through survey questionnaires. The students were instructed by their teachers to fill in the surveys themselves. A total of 420 sets of questionnaires were distrib- uted and 20 poorly-answered sets were excluded to make a final total of 400 sets (95.3%) which was used for statistical analysis.
Method and contents
The questionnaires were restructured in line with the study purpose based on previous studies [6,15]. The restructured questionnaires were subjected to the pre-test and further amended and complemented. Questionnaire inquiries were constructed according to three different aspects of general matters, eating attitude and preference of fruit and its intake level. General questionnaires included the family type, family member mostly preparing for meals, parents’ academic back- ground, income level, etc. to understand the characteristics of the study subjects. Fruit eating attitude included prefer- ence, reason to like or dislike fruits, comparison of fruit intake between school meals and home meals and the feeling of the fruit they like the least. Seventeen kinds of fruits were pre- sented according to the reference [15] and the DRI for Koreans [11] to compare intake levels. The fruit preference was exam- ined by using the Likert scale from 1 point representing ‘like it very much’ to 5 points, ‘don’t like it very much’. We examined the fruit intake by asking how many serving sizes are con- sumed. If one person ate one serving size, 1 point was given and any amount less than 0.5 gained 0 points. One serving size of fruits was presented either as 100 g or 200 g depend- ing on different fruits [11].
Statistical analysis
The SPSS program (Version 18.0, SPSS Inc., Chicago, IL, USA) was used for the statistical analyses. Term frequency and percentage were calculated to understand the general characteristics of the study subjects. The fruit consumption level by gener was compared by the cross analysis (X²-test) for any non- continuous variable and t-test for any continu- ous variable for follow-up verification. For the correlation between fruit intake and anthropometric measures, Pearson’s correlation coefficient (r) was used. All significance test was performed at the level of p < 0.05.
Results
General characteristics
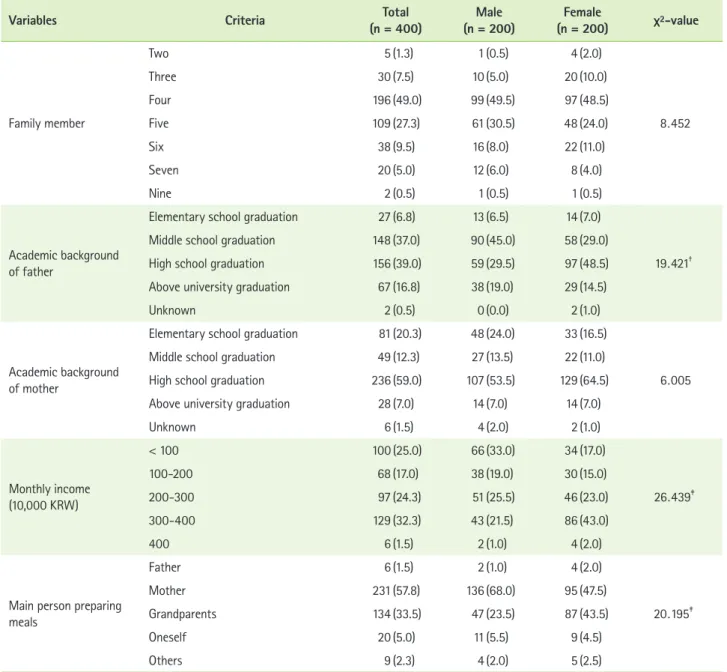
The general characteristics of study subjects are shown in Table 1. The highest proportion of subjects had ‘4’ family mem- bers (49.0%). The most prevalent academic backgrounds of parents were high school graduation for farthers was 39.0%
and 59.0% for mothers. The main person preparing meals was
‘mother’ (57.8%); their health status was ‘good’ (40.0%); and the body shape was ‘slim’ (45.5%). In comparison between male and female students, significant differences were found in father’s academic background, monthly average income,
and main person preparing meals, interests in dietary habits, health status, body shape, weight and height.
Eating attitude of fruits
The fruit eating attitude is shown in Table 2. The most fre- quent answer for fruit preference was ‘like very much’ (60.0%).
The most common answer for a reason to like fruits was ‘deli- cious’ (67.0%). Subjects consumed similar amount of fruits at home and in school meals and the most unlikable feeling of fruits was, ‘sour’ (47.0%). Both male and female participants answered they like fruits very much, although more female
Table 1. General characteristics of the subjects*
Variables Criteria Total
(n = 400) Male
(n = 200) Female
(n = 200) χ²-value
Family member
Two 5 (1.3) 1 (0.5) 4 (2.0)
8 . 452
Three 30 (7.5) 10 (5.0) 20 (10.0)
Four 196 (49.0) 99 (49.5) 97 (48.5)
Five 109 (27.3) 61 (30.5) 48 (24.0)
Six 38 (9.5) 16 (8.0) 22 (11.0)
Seven 20 (5.0) 12 (6.0) 8 (4.0)
Nine 2 (0.5) 1 (0.5) 1 (0.5)
Academic background of father
Elementary school graduation 27 (6.8) 13 (6.5) 14 (7.0)
19 . 421†
Middle school graduation 148 (37.0) 90 (45.0) 58 (29.0)
High school graduation 156 (39.0) 59 (29.5) 97 (48.5)
Above university graduation 67 (16.8) 38 (19.0) 29 (14.5)
Unknown 2 (0.5) 0 (0.0) 2 (1.0)
Academic background of mother
Elementary school graduation 81 (20.3) 48 (24.0) 33 (16.5)
6 . 005
Middle school graduation 49 (12.3) 27 (13.5) 22 (11.0)
High school graduation 236 (59.0) 107 (53.5) 129 (64.5)
Above university graduation 28 (7.0) 14 (7.0) 14 (7.0)
Unknown 6 (1.5) 4 (2.0) 2 (1.0)
Monthly income (10,000 KRW)
< 100 100 (25.0) 66 (33.0) 34 (17.0)
26 . 439‡
100-200 68 (17.0) 38 (19.0) 30 (15.0)
200-300 97 (24.3) 51 (25.5) 46 (23.0)
300-400 129 (32.3) 43 (21.5) 86 (43.0)
400 6 (1.5) 2 (1.0) 4 (2.0)
Main person preparing meals
Father 6 (1.5) 2 (1.0) 4 (2.0)
20 . 195‡
Mother 231 (57.8) 136 (68.0) 95 (47.5)
Grandparents 134 (33.5) 47 (23.5) 87 (43.5)
Oneself 20 (5.0) 11 (5.5) 9 (4.5)
Others 9 (2.3) 4 (2.0) 5 (2.5)
students(67%) gave an answer to "like it very much" than male students (53.0%) (p < 0.01). ‘Delicious’ was most often answered clause as a reason of liking fruits with higher proportion of males (88%) than female (50%) (p < 0.001). As for the fruit intake, male subjects answered they ‘similar amounts at home and in school meals’ (49.0%) and female subjects answered ‘far more at home’ (47.0%) exhibiting a significant difference (p <
0.001). Regarding the unlikable feeling of fruits, both genders said ‘sour’ the most, and it was followed by ‘cumbersome to eat’ (21.0%) in male subjects and ‘too seedy’ (18.0%) in female subjects, demonstrating a significant difference (p < 0.05).
Fruit preference
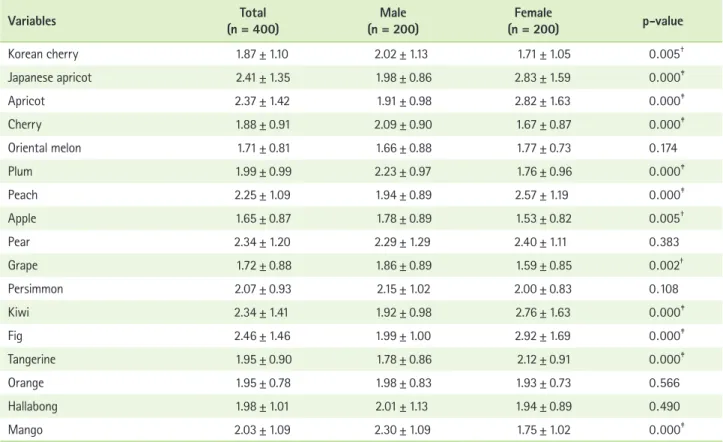
Likert scale from 1 point representing ‘like very much’ to 5 points, ‘dislike very much’ was used to evaluate the prefer- ence for the 17 kinds of fruits. The lower points meant the
higher preference. The findings are shown in Table 3. The most preferred fruit by study subjects was the apple followed by oriental melon, grape, Korean cherry, cherry, tangerine/orange, hallabong, plum, mango, persimmon, peach, pear/kiwi, apricot, Japanese apricot and fig in order. According to gender, tanger- ine, peach, apricot, Japanese apricot, kiwi and fig were found to be preferred by male students (p < 0.001) while grape (p <
0.01), mango (p < 0.001), plum (p < 0.001), cherry (p < 0.001), Korean cherry (p < 0.01) and apple (p < 0.01) were found to be preferred by female students.
Daily fruit intake and its correlation with anthropometric measurements
The findings of daily fruit intake are shown in Table 4. The subjects’ fruit intake frequencies were 1.0, 0.9 and 1.0 times for breakfast, lunch and dinner, respectively, averaging 2.9 Table 1. Continued
Variables Criteria Total
(n = 400) Male
(n = 200) Female
(n = 200) χ²-value
Interests in dietary habits
Very interested 1 (0.3) 1 (0.5) 0 (0.0)
32 . 406‡
Interested 113 (28.3) 38 (19.0) 75 (37.5)
Average 166 (41.5) 104 (52.0) 62 (31.0)
Not interested 92 (23.0) 37 (18.5) 55 (27.5)
Never interested 28 (7.0) 20 (10.0) 8 (4.0)
Health status
Very good 30 (7.5) 14 (7.0) 16 (8.0)
27 . 609‡
Good 160 (40.0) 94 (47.0) 66 (33.0)
Average 124 (31.0) 70 (35.0) 54 (27.0)
Bad 86 (21.5) 22 (11.0) 64 (32.0)
Self-evaluated Body shape
Skinny 35 (8.8) 17 (8.5) 18 (9.0)
67 . 782‡
Slim 182 (45.5) 112 (56.0) 70 (35.0)
Normal 77 (19.3) 37 (18.5) 40 (20.0)
Fat 62 (15.5) 3 (1.5) 59 (29.5)
Very fat 44 (11.0) 31 (15.5) 13 (6.5)
Body weight, kg
< 53 114 (28.5) 20 (10.0) 94 (47.0)
89 . 016‡
53-59 108 (27.0) 51 (25.5) 57 (28.5)
59-65 90 (22.5) 58 (29.0) 32 (16.0)
65 ≤ 88 (22.0) 71 (35.5) 17 (8.5)
Height, cm
< 160 89 (22.3) 21 (10.5) 68 (34.0)
149 . 710‡
160-165 104 (26.0) 27 (13.5) 77 (38.5)
165-170 79 (19.8) 32 (16.0) 47 (23.5)
170 ≤ 128 (32.0) 120 (60.0) 8 (4.0)
*Values are presented as n (%); †p < 0.01; ‡p < 0.001.
times a day. The male frequency was 2.9 times and the female frequency 3.0 times, exhibiting no significant difference. The results of the correlation between fruit intake and anthropo- metric measures are shown in Table 5. The breakfast fruit con- sumption frequency showed a significant correlation with age (p < 0.05) and the dinner fruit consumption frequency with body weight and BMI (p < 0.05, p < 0.01).
Discussion
The present study was conducted to explore a way to be utilized for proper fruit intake guideline by evaluating ado- lescent fruit intake. As fruits were seen mostly together with vegetables different characteristics between fruits and veg- etables are often neglected. Especially fruits have higher sugar
content than vegetables, and therefore may be associated with higher risk of overweight if consumend in excess. The study subjects were found to generally like fruits because they find fruits are delicious. Apple was the most preferred fruit followed by oriental melon and grape. Based on one serving size per person, the frequency of fruit intake in males were 2.9 times a day and that of females 3.0 times, without significant difference. The fruit intake frequency at dinner demonstrated a significant positive correlation both with body weight and BMI.
Children and adolescents were found to have a preference of fruits unlike lower preference for vegetables. A study on middle school students in Chungbuk area reported that 68.0%
of the subjects, tended to eat no vegetables followed by fish (17.6%), milk and dairy products (7.6%) and fruits (5.3%), Table 2. Dietary attitudes towards fruits in study subjects*
Variables Criteria Total
(n = 400) Male
(n = 200) Female
(n = 200) χ²-value
Fruit preference
Like very much 240 (60.0) 106 (53.0) 134 (67.0)
11 . 996‡
Like 33 (8.3) 15 (7.5) 18 (9.0)
Moderate 96 (24.0) 62 (31.0) 34 (17.0)
Dislike 31 (7.8) 17 (8.5) 14 (7.0)
Reason to like fruits
Delicious 183 (67.0) 107 (88.4) 76 (50.0)
50 . 669§
Healthy 73 (26.7) 7 (5.8) 66 (43.4)
Others 15 (5.5) 6 (5.0) 9 (6.0)
Non response 2 (0.8) 1 (0.8) 1 (0.6)
Reason to dislike fruits No flavor 12 (38.7) 6 (35.3) 6 (42.9)
1 . 851
Non response 19 (61.3) 11 (64.7) 8 (57.1)
Fruit intake
Much more at school 17 (4.3) 8 (4.0) 9 (4.5)
40 . 394§
Little more at school 4 (1.0) 1 (0.5) 3 (1.5)
Similar 157 (39.3) 98 (49.0) 59 (29.5)
Little more at home 91 (22.8) 56 (28.0) 35 (17.5)
Much more at home 131 (32.8) 37 (18.5) 94 (47.0)
Dislikable feeling of fruit
Too seedy 73 (18.3) 37 (18.5) 36 (18.0)
14 . 600†
Squashy 22 (5.5) 12 (6.0) 10 (5.0)
Sour 188 (47.0) 78 (39.0) 110 (55.0)
Cumbersome to eat 67 (16.8) 42 (21.0) 25 (12.5)
Cold 13 (3.3) 6 (3.0) 7 (3.5)
Others 37 (9.3) 25 (12.5) 12 (6.0)
*Values are presented as n (%); †p < 0.05; ‡p < 0.01; §p < 0.001.
showing the preferences of adolescents for vegetables and for fruits were different [3]. Also the present study found that
60.0% of the subjects liked fruits showing a general prefer- ence for fruits especially among female students. The highest Table 5. Correlation coefficient between fruit intake and anthropometric measurements of the subjects*
Variables Fruit intake
Breakfast Lunch Dinner Total
Age 0 . 0999† -0 . 0128 0 . 0341 0 . 0738
Height -0 . 0276 0 . 0333 -0 . 0046 -0 . 0012
Body weight 0 . 0174 -0 . 0541 0 . 1252† 0 . 0582
Body mass index 0 . 0293 -0 . 0711 0 . 1309‡ 0 . 0595
*Correlation coefficient determined by Pearson’s correlation test; †p < 0.05; ‡p < 0.01.
Table 4. Daily fruit intake of the subjects*
Variables Male
(n = 200) Female
(n = 200) Total
(n = 400) p-value
Breakfast 0.97 ± 0.85 1.03 ± 0.88 1.00 ± 0.78 0 . 506
Lunch 0.89 ± 0.79 0.91 ± 0.78 0.90 ± 0.78 0 . 823
Dinner 1.01 ± 0.88 1.03 ± 0.90 1.02 ± 0.89 0 . 844
Total 2.87 ± 1.41 2.97 ± 1.48 2.92 ± 1.44 0 . 523
*Values are presented as Mean ± SD. Data indicates the number of serving size, Serving size (the amount of food intake once): 200 g water melon and melon, ten pieces strawberry and 100 g all the rest fruits.
Table 3. Fruit preference of the subjects*
Variables Total
(n = 400) Male
(n = 200) Female
(n = 200) p-value
Korean cherry 1.87 ± 1.10 2.02 ± 1.13 1.71 ± 1.05 0 . 005†
Japanese apricot 2.41 ± 1.35 1.98 ± 0.86 2.83 ± 1.59 0 . 000‡
Apricot 2.37 ± 1.42 1.91 ± 0.98 2.82 ± 1.63 0 . 000‡
Cherry 1.88 ± 0.91 2.09 ± 0.90 1.67 ± 0.87 0 . 000‡
Oriental melon 1.71 ± 0.81 1.66 ± 0.88 1.77 ± 0.73 0 . 174
Plum 1.99 ± 0.99 2.23 ± 0.97 1.76 ± 0.96 0 . 000‡
Peach 2.25 ± 1.09 1.94 ± 0.89 2.57 ± 1.19 0 . 000‡
Apple 1.65 ± 0.87 1.78 ± 0.89 1.53 ± 0.82 0 . 005†
Pear 2.34 ± 1.20 2.29 ± 1.29 2.40 ± 1.11 0 . 383
Grape 1.72 ± 0.88 1.86 ± 0.89 1.59 ± 0.85 0 . 002†
Persimmon 2.07 ± 0.93 2.15 ± 1.02 2.00 ± 0.83 0 . 108
Kiwi 2.34 ± 1.41 1.92 ± 0.98 2.76 ± 1.63 0 . 000‡
Fig 2.46 ± 1.46 1.99 ± 1.00 2.92 ± 1.69 0 . 000‡
Tangerine 1.95 ± 0.90 1.78 ± 0.86 2.12 ± 0.91 0 . 000‡
Orange 1.95 ± 0.78 1.98 ± 0.83 1.93 ± 0.73 0 . 566
Hallabong 1.98 ± 1.01 2.01 ± 1.13 1.94 ± 0.89 0 . 490
Mango 2.03 ± 1.09 2.30 ± 1.09 1.75 ± 1.02 0 . 000‡
*Values are presented as Mean ± SD. Score: very like (1)-entirely dislike (5); †p < 0.01; ‡p < 0.001.
preference of them was found to be for apple followed by ori- ental melon and grape. The more frequently consumed fruits were more preferred.
It is hard to identify the precise fruit intake as fruit intake assessment studies have dealt vegetables together with fruits as a fruits and vegetables group. A study on 234 elementary school students, the frequency of fruits and vegetables intake was 4.2 servings daily per person and of them, fruits and juices accounted for 1.3 times. However, such intake assessments mainly centered on vegetables and as vegetable intake is insuf- ficient, they emphasize to increase the vegetable consumption while an appropriate fruit intake was not discussed [16]. The DRI for Koreans recommends fruits consumption at least 3 times for male students and 2 times for female students in recommended meal patterns of diet plans [11]. Compared with this, guideline, the present study found a similar frequency in male students while female students consumed more than the recommended amount. Results from this study are different from many other previous studies reporting a lower vegetable intake than the guideline, suggesting that the fruit intake of adolescents is not insufficient. This finding is similar to another study which investigated the frequency of fruit consumption among middle school students in summer. It was found that daily intake of watermelon was 0.8; oriental melon was 0.7;
apple was, 0.6; pear/grape/banana were, 0.5 and persimmon/
peach/tangerine were 0.4 in male students. For female stu- dents it was as follows: melon 0; oriental melon, 0.8; banana, 0.5; apples, 0.4 and tangerine/pear/grape/peach, 0.3, in average 3 servings per day.
In a meta-analysis examining the relationship between stroke and fruit and vegetable intake, it was reported that the stroke occurrence dropped by 11-32% for every 200 g con- sumption increase a day [17]. Multiple intervention studies and cohort studies also reported that fruit and vegetable intake not only reduced blood pressure and improved microvessel functions, but also had useful effects against cardiovascular risk factors such as BMI, waist-measurement, total cholesterol, low density cholesterol, inflammation and oxidation stress [18-20]. A possible interpretation include that a high intake of fruits and vegetables increases micronutrients, carbohydrate and fibers and accordingly lowers the fat intake. Such a result is deemed to be because of study subjects had western di- etary style with higher fat intake. Unlike the western countries where fat intake is higher in daily diet and accordingly, exces- sive fat intake is the main cause of obesity, Koreans show excessive carbohydrate intake as a main cause of obesity
[21,22]. Therefore, it is required to consider the difference in sugar between vegetables and fruits. In this recognition, fruits was separated from vegetables in the DRI for Koreans in 2005.
Nevertheless, studies looking at their intake assessment and relationship with health indicators have not separately rec- ognized fruits and vegetables, posing difficulties for scientific attempts to find out any correlation between fruit intake and health statis indicators.
This investigation on the correlation between the intake level of fruits in adolescents and BMI found a significant posi- tive correlation between fruit intake frequency at dinner and body weight as well as BMI. This finding is from many other preceding studies reporting the intake of fruits and vegetables showed a negative correlation with an indication for cardio- vascular risks. However, this study has also its limitations. The level of fruit intake was assessed based on the serving size, which is not the most accurate assessment. Also the research results are presented based on a simple correlation analysis and lacks preceding supportive study results. Therefore, a generalization of this research results may be difficult. How- ever, the present study is meaningful because fruit intake is seperately assessed as an independent food group. Also it presents that fruit intake at dinner had a significantly positive correlation with body weight and BMI. This research is deemed to have enough value to facilitate more follow-up studies and be utilized for a proper fruit intake instruction guidelines for adolescents.
References
1. Ministry of Health and Welfare, Korea Centers for Disease Control and Prevention. Korea Health Statistics 2012: Korea National Health and Nutrition Examination Survey (KNHANES V-3). Cheongwon: Korea Cen- ters for Disease Control and Prevent; 2013.
2. Kim KJ. Teenagers’ degree of preference for and intake realities of fruits and vegetables: survey on high school students of boarding schools [dissertation]. Seoul: Konkuk University; 2009.
3. Oh MH, Kim KN. Preferences, frequency and consumption of veg- etables, fruits & milk, and practices of dietary guidelines among middle school students in Chungbuk area. J Hum Ecol 2012;16:43-54.
4. Rosen JC, Gross J. Prevalence of weight reducing and weight gaining in adolescent girls and boys. Health Psychol 1987;6:131-47.
5. Namgung M. A study on the middle school girls’ interest in weight loss and eating habits in Seoul [dissertation]. Seoul: Dongguk University.
2003.
6. Cho HS, Kim MH, Choi MK. A study on vegetable intakes and dietary habits of middle school students in Chungnam. Korean J Community Nutr 2010;15:525-35.
7. Hung HC, Joshipura KJ, Jiang R, Hu FB, Hunter D, Smith-Warner SA, Colditz GA, Rosner B, Spiegelman D, Willett WC. Fruit and vegetable in- take and risk of major chronic disease. J Natl Cancer Inst 2004;96:1577- 84.
8. Marlett JA. Sites and mechanisms for the hypocholesterolemic actions
of soluble dietary fiber sources. Adv Exp Med Biol 1997;427:109-21.
9. Jenkins DJ, Kendall CW, Axelsen M, Augustin LS, Vuksan V. Viscous and nonviscous fibres, nonabsorbable and low glycaemic index car- bohydrates, blood lipids and coronary heart disease. Curr Opin Lipidol 2000;11:49-56.
10. Lee SH. Research on the nutrient and dietary fiber intake of female middle school students in the Daegu region [dissertation]. Daegu:
Keimyung University; 2008.
11. The Korean Nutrition Society. Dietary reference intakes for Koreans 2010. Seoul: The Korean Nutrition Society; 2010.
12. Jung HK, Jo HJ, Choi MJ. A study on vegetable & fruit eating habits and dietary fiber intake of high school students: focusing on high school students in Daegu. J Korean Soc Sch Health Educ 2011;12:43-64.
13. Kim JH, Kim YS, Kim Y, Kang MS. Fruit and vegetable consumption and factors affecting fruit and vegetable consumption of school children and adolescents: findings from focus-group interviews with school nutrition teachers and nutritionists. Korean J Community Living Sci 2013;24:567-81.
14. Cho S, Kim W. Sugar intakes and metabolic syndrome. Korean J Nutr 2007;40:39-49.
15. Cho HS. A study on body image and vegetable intakes by body mass index of middle school students in Chungnam [dissertation]. Gongju:
Kongju National University; 2010.
16. Na SY, Ko SY, Eom SH, Kim KW. Intakes and beliefs of vegetables and fruits, self-efficacy, nutrition knowledge, eating behavior of el- ementary school students in Kyunggi area. Korean J Community Nutr 2010;15:329-41.
17. Hu D, Huang J, Wang Y, Zhang D, Qu Y. Fruits and vegetables consump- tion and risk of stroke: a meta-analysis of prospective cohort studies.
Stroke 2014;45:1613-9.
18. Steffen LM, Jacobs DR Jr, Stevens J, Shahar E, Carithers T, Folsom AR.
Associations of whole-grain, refined-grain, and fruit and vegetable consumption with risks of all-cause mortality and incident coronary artery disease and ischemic stroke: the Atherosclerosis Risk in Commu- nities (ARIC) Study. Am J Clin Nutr 2003;78:383-90.
19. Mizrahi A, Knekt P, Montonen J, Laaksonen MA, Heliövaara M, Järvinen R. Plant foods and the risk of cerebrovascular diseases: a potential pro- tection of fruit consumption. Br J Nutr 2009;102:1075-83.
20. Van Duyn MA, Pivonka E. Overview of the health benefits of fruit and vegetable consumption for the dietetics professional: selected litera- ture. J Am Diet Assoc 2000;100:1511-21.
21. Kopp W. High-insulinogenic nutrition--an etiologic factor for obesity and the metabolic syndrome? Metabolism 2003;52:840-4.
22. Park YM, Sohn CM, Jang HC. Correlation of carbohydrate intake with obesity in type 2 diabetes mellitus patients. J Korean Diet Assoc 2006;12:254-63.