BONE RESPONSE OF THREE DIFFERENT
SURFACE IMPLANTS : HISTOMORPHOMETRIC, PERIO TEST VALUE AND RESONANCE
FREQUENCY ANALYSIS IN BEAGLE DOGS
Joon-Eon Choi, D.D.S., M.S.D., Ph.D., Kyu-Won Suh, D.D.S., M.S.D., Ph.D., In-Ku Lee, D.D.S., M.S.D., Jae-Jun Ryu, D.D.S., M.S.D., Ph.D.,
Sang-Wan Shin, D.D.S., M.S.D., Ph.D.
Graduate School of Medical science, Korea University
Statement of problem.The intial stability for osseointegration of implant has been an interesting factor. Especially, in the case of poor bone quality or immediately loaded implant, various strategies have been developed focusing on the surface of materials to improve implant fixation to bone. The microscopic properties of implant surfaces play a major role in the osseous healing of dental implants.
Purpose.The aims of this study are to perform a histologic and histomorphometric comparison of the healing characteristics of three different surfaces and the comparison of resonance fre- quency analysis (RFA) values measured by OsstellTMand perio-test values (PTV) measured by Periotest.
Material and methods.A total of 24 screw titanium implants (Dentium Co., Seoul, Korea) with 6mm in length and 3.4mm in diameter, were placed in the mandible of 4 beagle dogs. Implants were divided into three groups following the surface treatment methods: Group I is machined(control group). Group II is anodically oxidized. Group III is coated 500nm in thickness with hydroxyapatite(HA) by ion beam assisted deposition(IBAD) on the anodized oxidization. Bone blocks from 2 dogs were caught after 3 weeks of covered healing and another blocks from 2 dogs after 6 weeks. RFA values and PTV were measured right after inser- tion and at 3 and 6weeks. Histomorphometric analysis was made with Kappa Image Base System to calculate bone-to-implant contact (BIC) and bone area inside the threads. Pearson’s correlation analyses were performed to evaluate the correlation between RFA and PTV, BIC and bone area ratio of three different surfaces at 3 and 6 weeks.
Results.
1) In all surface treatment methods, the RFA values decreased and the PTV values increased until 6 weeks in comparison to initial values.
2) At 3 weeks, no significant difference was found from bone-to-implant contact ratio and bone area ratio of three different surface treatment methods(P>0.05). However, at 6 weeks, different surface treatment methods showed significantly different bone-to- implant contact ratio and bone area ratio(P<0.05).
J Korean Acad Prosthodont : Volume 45, Number 3, 2007
T
he success of implant largely depends on the initial stability during implant surgery and the osseointegration during healing process. Since the initial stability is influenced by bone state, vari- ous implant materials and implant surgeries have been tried with regard to bone quality.According to Jaffin and Berman1, bone type I, II and III of Lekholm and Zarb2 ’s classification showed 3% failure rate while bone type IV had 35% failure rate. The difference of the failure rate was influenced by delay of the initial stability which resulted from the loss of tight contact because of adjacent large bone marrow.
Albrektsson3 found that implant material, design and surface treatment was important for suc- cessful osseointegration. Glauser et al4claimed that in case of relatively poor bone quality, the ini- tial implant stability was affected by implant designs and surface treatments.
To solve the problems of initial stability, inter- est in surface treatment of implant has increased.
Many researchers tried to overcome limits through implant designs or surface treatments, and there- fore implant surface treatment methods have been continuously changing. Machined surface implant without any surface treatment is smooth
on the outside but has minute roughness. After combined with oxygen, machined surface forms an oxide layer, which is considered to be sta- ble. Anodic oxidization surface treatment intends to earn firm fixation through the growth of bone in the pore of the oxide layer, which is formed by anodic oxidization. Song et al5conducted resonance frequency analysis(RFA) and histomorphop- metric analysis to see the bone response of anod- ically roughened surfaces, HA coated surface, and RBM surface implant in beagle dogs. Song’
s study found that the bone-to-implant con- tact(BIC) ratio and the RFA values did not show any significant difference in each group.
Werner Zechner et al6claimed that anodized oxidation and HA coated implants showed high- er BIC ratio than machined surfaces in mini pigs.
Lisa Knobloch et al7placed surface treated implants with machine and anodized oxidation into beagle dogs, and restored them with fixed prosthesis at 2, 4 and 6 weeks, and performed peri- otest analysis. Knobloch’s study8showed that the anodized surface was stabler than the machined one.
HA coating, which is the attachment of hydrox- yapatite(same inorganic material as bone) to machined surfaces, has drawbacks such as uneven 3) In the implants with the IBAD on the anodic oxidization, significant difference was
found between the 3 weeks and the 6 weeks bone area ratio(P<0.05).
4) Correlation was found between the RFA values and the bone area ratio at 3 and 6 weeks with significant difference(P<0.05).
Conclusions.
These results indicate that the implants with the IBAD on the anodic oxidization may have a high influence on the initial stability of implant.
Key Words
IBAD (Ion-beam assisted deposition) method, Initial stability, Histo-morphometric analysis, RFA and PTV
surface or separation from implant surface. To com- plement such drawbacks, many ways of coat- ing8-10have been developed, such as dip coat- ing, hot isostatic pressing11, flame spraying12, plasma spraying13,14, and pulsed laser deposi- tion.15Concerning the plasma spraying, a few of problems were reported such as chemically uneven coating layer, dissolution in saliva and a low rate of bond strength.16,17In an effort to earn thin and even surfaces in HA coating, ion beam- assisted deposition(IBAD) was introduced.18,19 Park et al20showed that the HA coating by the IBAD method demonstrated more favorable results than the aluminum oxide-blasted sur- face in removal torque, bone-to-implant contact (BIC) ratio and bone area ratio. According to Kim et al21, the BIC ratio was the highest in the IBAD treated surface.
The clinical result of implant treatment was mainly evaluated by clinical and radiographi- cal analyses. As a non-destructive method for assessing implant stability and osseointegration, an objective, quantitative and repeatable method was needed, thus the periotest value(PTV, Siemens AG, Benshelm, Germany) and the resonance fre- quency analysis(RFA, Osstell Integration Diagnostic Ltd., Savedalen, Sweden) were used to evalu- ate the stability of implant. Recently, the resonance frequency analysis has been approved as a more effective method for quantitative calculation of implant stability in vivo.22-25It was also reported that the perio-test value was influenced by the length of implant fixture and the length of abut- ment26, implantation site27, location and direc- tion of force.28However, the perio-test value is effec- tive in the aspect of cost and time, and is also reported to have clinical correlation with RFA val- ue.29Most research on the surface treatment of implant30-32have focused on comparison analysis by histomorphometrical analysis or removal torque analysis. However, there has not been much
research about correlation analysis among the RFA values, the PTVs, and histomorphometircal analy- sis of the bone-to-implant contact and bone area ratios according to the surface treatment methods in beagle dogs.
In this study, implants with 3 different sur- face treatment methods were placed in the mandible of 4 beagle dogs. In order to analyze the healing characteristics of the implants, histo- morphometric analysis, RFA and PTV were per- formed and correlations among them were eval- uated. This study intends to provide a theoretical base for clinical stability of a new surface treatment method through examining initial stability with RFA values and PTVs and through evaluating the degrees of bone-to-implant contact with histo- morphometrical analysis.
MATERIAL AND METHODS 1. Animals and materials
Four adult beagle dogs, weighing approxi- mately 10 kg and with permanent teeth fully erupted, were prepared in this study. Screw type implants(Dentium Co., Seoul, Korea) manufactured from pure titanum 3.4 mm in diameter and 6 mm in length were used in this study. The main thread had a pitch of 0.65 mm and the upper part was double threaded. A total of 24 implants were divided into 3 groups according to sur- face treatment methods. Following are 3 different surface treatment methods(Fig. 1):
1) Group 1(MAC) had machined surface.
2) Group 2(ANO) was anodically oxidized with pulse power(Autoelectric Co., Seoul, Korea).
3) Group 3(IBA) was HA(Ca/P=1/1.67) coated with 500 nm in thickness by IBAD on the anodically oxidized surface.
Surface roughness of implants was measured from the upper part of thread by the manufacturer with using Top Scan3D. Properties of group II and III are explained below(Table I):
2. Implant Surgery and Insertion
The dogs were anesthetized with an intra- muscular injection of Hcl Ketamine(Ketamine, Yuhan Co., Seoul, Korea, 2mg/kg body weight), and local anesthesia was injected into each implantation site with 2% Lidocaine 1ml(Lidocaine 1:100,000, Yuhan Co., Seoul, Korea). To make the edentulous state, 4 mandibular premolars were extracted bilaterally from each dog and, after three months of healing, implants were inserted. A guide drill was first used for penetration
into the compact bone and was followed by a drill with 2.0 mm in diameter, a pilot drill with 3.0 mm in diameter and a final drill. With regard to implantation site, the bone quality of anterior and posterior part of mandible was taken into account and three types of implants were insert- ed, while changing the order according to surface treatment methods(Fig. 2). After the insertion of the implants was stabilized, cover screw was connected. Implant sites were sutured with 3-0 resorbable silk. After surgery, the animals received antibiotics(Ganamaicin 50mg/kg, Dong-a, Seoul, Korea) intramuscularly for seven days. The suture materials were removed a week after implant surgery.
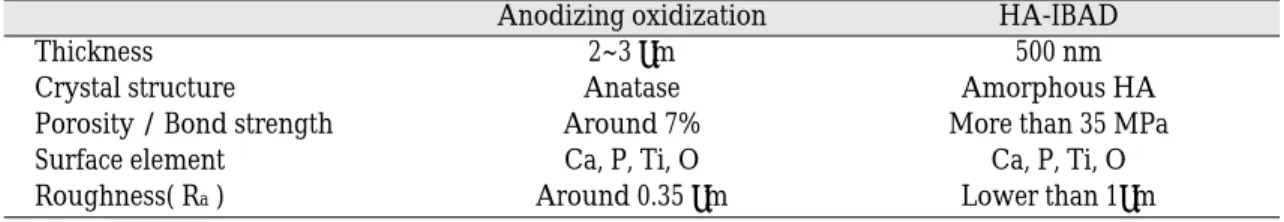
Table I. Comparison of anodized oxidization and HA-IBAD
Anodizing oxidization HA-IBAD
Thickness 2~3 μm 500 nm
Crystal structure Anatase Amorphous HA
Porosity / Bond strength Around 7% More than 35 MPa
Surface element Ca, P, Ti, O Ca, P, Ti, O
Roughness( Ra) Around 0.35 μm Lower than 1μm
Machined Surface (MAC) Anodizing oxidization (ANO) Anodizing oxidization + IBAD (IBA) Fig. 1.SEM ×1000 of Three different surfaces.
3. Research Protocol
RFA values were measured by Osstell(Integration Diagnostic Ltd., Savedalen, Sweden) right after implant surgery and at 3 and 6 weeks. Periotest values were measured with Periotest(Siemens AG, Benshelm, Germany) right after implant surgery and at 3 and 6 weeks. After 3 and 6 weeks, respective animals were euthanized. The specimens of the mandible were divided longi- tudinally with the implant at the center and then fixed in neutral buffered formalin for more than 48 hours. Fixed specimens were then ground to a final thickness of about 5 mm and further dehydrated in an ascending concentration of alcohol rinses from 50 to 100%. After finally being dehydrated with 100% dehydrated alcohol more than three times, the specimens were infil- trated with alcohol and a light-curing resin (Technovit 7200VLC Kulzer GmbH, Kulzerwe- hrheim, Germany) for three to five days and then polymerized under light for 16 hours. After
polymerization, the specimens were cut with a micro-cutting machine(Exakt MG 300, Hamburg, Germany) using a diamond wheel saw and to a thickness of approximately 200㎛. After cutting, they were ground with a micro-grinding machine(Exakt MG4000) using 800, 1200 and 2000 sandpaper and the thickness was approxi- mately 30㎛. Through cutting and grinding, cal- cified specimens were manufactured, stained with hematoxylineosin and observed with a microscope(Olympus BX51, Olympus Co., Tokyo, Japan). Histomorphometric analysis was per- formed with an Olympus BX microscope (Olympus BX51, Olympus Co., Tokyo, Japan) connected to a computer. The image analysis software used was Kappa Image Base Metro (Kappa Opto-electronics, Gleichen, Germany).
The 6 best ratios of both bone-to-implant contact ratios and bone area ratios were selected and the mean value of the six values was used in this study.
Fig. 2.Implantation site of three different surfaces.
left : right left : right
Implantation site 3 weeks
6 weeks 6 weeks
3 weeks
4. Statistical Analysis
Resonance frequency analysis values and peri- otest values were calculated using ANOVA(using SPSS for Windows ver. 12.0, SPSS Inc., Chicago, U.S.A., P<0.05). For histomorphometric analysis on the bone-to-implant contact (BIC) ratio and bone area ratio, Kruskal-Wallis’analysis(using SPSS for Windows ver. 12.0, SPSS Inc., Chicago, U.S.A.) was conducted with a 5% significance level. RFA values and PTVs were compared with using t-test, and BIC ratio and bone area ratio were com- pared with using the Mann-Whitney U-test. To find out the relationship between RFA values and PTVs of 3 and 6 weeks and BIC ratio or bone area ratio, Pearson’s correlation analysis was con- ducted.
RESULTS
1. Resonance Frequency Analysis and Periotest Value
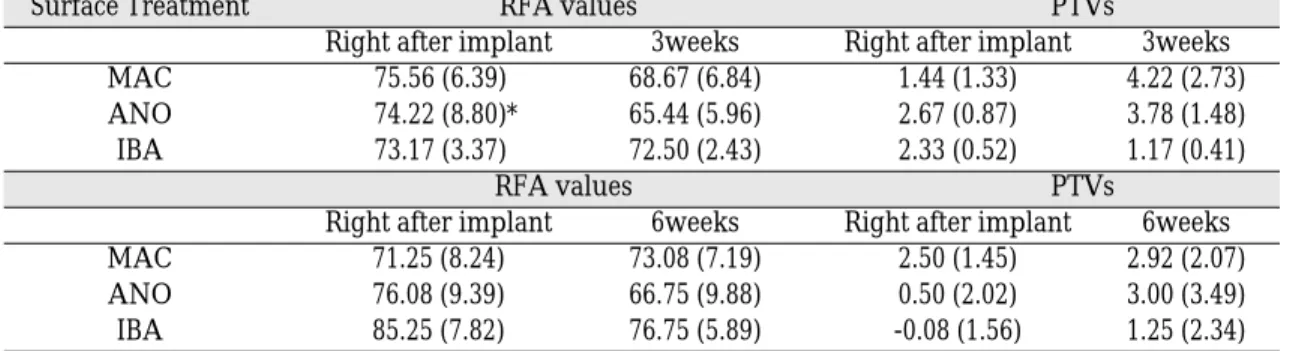
As time passed from day 1 to 3 and 6 weeks, RFA decreased and PTV increased. In the case of 3 weeks, group III had the highest RFA level(72.50
± 2.43) and the lowest PTV(1.17± 0.41). In the case of 6 weeks, RFA was the highest in group III(76.75± 5.89), and PTV was higher in group I(2.92± 2.07) than in group III(1.25± 2.34) with significant difference(p<0.05, Table III, Fig. 3, 4).
2. Histologic and Histomorphometrical Analysis
(1) Histologic finding
With regard to tissue recovery and bone response, noticeable differences were not found in all the
Table II. Surface treatment methods
Code Surface Treatment
MAC(Group I) Machined surface
ANO(Group II) Anodizing oxidization
IBA(Group III) IBAD + Anodizing oxidization
Table III. Resonance frequency analysis(RFA) values and periotest values(PTVs)
Surface Treatment RFA values PTVs
Right after implant 3weeks Right after implant 3weeks
MAC 75.56 (6.39) 68.67 (6.84) 1.44 (1.33) 4.22 (2.73)
ANO 74.22 (8.80)* 65.44 (5.96) 2.67 (0.87) 3.78 (1.48)
IBA 73.17 (3.37) 72.50 (2.43) 2.33 (0.52) 1.17 (0.41)
RFA values PTVs
Right after implant 6weeks Right after implant 6weeks
MAC 71.25 (8.24) 73.08 (7.19) 2.50 (1.45) 2.92 (2.07)
ANO 76.08 (9.39) 66.75 (9.88) 0.50 (2.02) 3.00 (3.49)
IBA 85.25 (7.82) 76.75 (5.89) -0.08 (1.56) 1.25 (2.34)
*: Standard deviation is written in parenthesis.
groups. At 3 weeks, bone remodelling began and several inflammatory and defect areas were observed. At 6 weeks, bone remodelling became very active with abundant Haversian canals and reversal lines being observed. As time passed from 3weeks to 6weeks, newly formed bone derived from old bone gradually changed into compact bone. Minor inflammation in the threads is thought to be caused by heat damage. Minor bone defects were also observed at the upper thread, which are thought to be caused by com- pression during insertion(Fig. 5, 8).
(2) Histomorphometrical Analysis
In general, Bone-to-implant contact (BIC) ratio and bone area ratio increased at 6 weeks compared to 3 weeks. At 3 weeks, no significant difference was found among the three groups. However, in the case of 6 weeks, group III showed the highest BIC ratio (0.38± 0.18)and bone area ratio (0.70±
0.15) with significant difference(p<0.05, Table IV, Fig. 6, 7, 8).
3. Comparison and correlation analysis of RFA values and PTVs, and bone-to-implant contact (BIC) ratios and bone area ratios Comparison of RFA values and PTVs with t-test
revealed that RFA values and PTVs of 3 and 6 weeks did not have any significant differ- ence(p>0.05). Regarding the BIC ratios of three sur- face treatment, no significant differences were found between 3 and 6weeks respectively. No sig- nificant difference was found between 3 and 6 weeks bone area ratios of respective group I and II(p>0.05). However, significant difference was found between 3 and 6 weeks bone area ratios of group III(p=0.038). Correlation analysis of RFA val- ues and PTVs, and BIC ratios and bone area ratios is followed :
A. Correlation was not found between RFA values and PTVs at 3 and 6 weeks respec- tively(p>0.05).
B. Correlation was found between BIC ratio and bone area ratio at 3 weeks(p<0.05).
Correlation coefficient was 0.741. However, there was no correlation at 6 weeks(p>0.05).
C. While no correlation was found between RFA values and BIC ratios of 3 and 6 weeks respectively, there was correlation between RFA values and bone area ratios of 3 and 6 weeks respectively(p<0.05). Correlation coef- ficient was 0.762 and 0.935 respectively.
D. No correlation was found among periotest val- ues, BIC ratios and bone area ratios of 3 and 6 weeks.
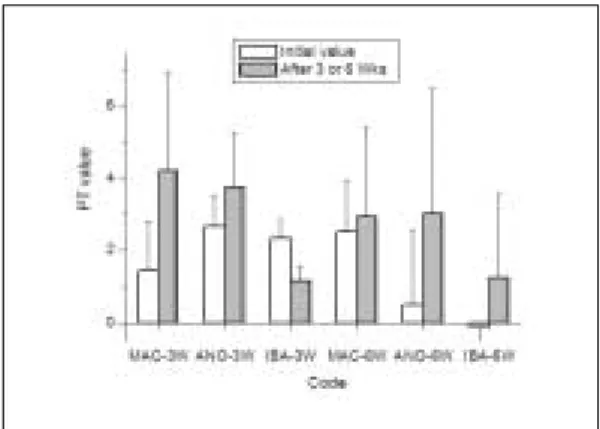
Fig. 3. Resonance frequency analysis values(ISQ). Fig. 4. Periotest values.
×40 6 weeks(Group I) ×40 6 weeks(Group II) ×40 6 weeks(Group III) Fig. 5.Histologic finding of three groups at 6 weeks ×40.
Table IV. Bone-to-implant contact ratio and bone area ratio
Surface Treatment Bone-to-implant contact ratio Bone area ratio
3 weeks 6 weeks 3 weeks 6 weeks
MAC(Group I) 0.29 (0.20) 0.21 (0.14) 0.56 (0.23) 0.68 (0.14) ANO(Group II) 0.39 (0.23)* 0.36 (0.21) 0.48 (0.22) 0.52 (0.26) IBA(Group III) 0.34 (0.24) 0.38 (0.18) 0.54 (0.27) 0.70 (0.15)
*: Standard deviation is written in parenthesis.
Fig. 6. Bone-to-implant contact ratio. Fig. 7. Bone area ratio.
DISCUSSION
Surface oxide properties are regarded to be of great importance in establishing successful osseo- ingration of titanium implants.33Much research has been made on initial stability in the case of poor bone quality. Especially, recent efforts have been made to earn the roughness, surface morpholo- gy and oxide layer most appropriate to the osseointegration. In Sennerby34’s ultrastructural studies of the implant interfacial zone, it was observed that the tissue elements directly bordered not the bulk titanium but rather the native oxide layer of the metal. This thin oxide layer was shown to be in contact with remodeled mineral- ized bone. The oxide layer(TiO2) was amorphous,
17nm in thickness and 0.53~0.67㎛ (Ra) in rough- ness.35On the other hand, according to Tufekci E et al36, implants with rough surfaces increase the bone-to-implant contact area and produce high- er success rates even in implants with short length. Tufekci’s clinical treatment of poor bone quality showed the superiority of implants with rough surface treatment. Wennerberg et al37 reported that titanium implants with 1.4㎛ in surface roughness(Sa) had higher bone-to-implant contact ratios than those with less roughness(Sa : 0.7-1.2㎛). The implants used in this study were anodically oxidized (group II and III)at 270V and had a surface roughness of 0.35㎛(Ra). With regards to the bone area ratio at 6 weeks, machined surface (group I) had higher figures than anodic
×100 3 Weeks(Group I) ×100 3 Weeks(Group III)
×100 6 Weeks(Group I) ×100 6 Weeks(Group II) ×100 6 Weeks(Group III) Fig. 8.Histomorphometrical analysis of three groups at 3 and 6 weeks ×100.
×100 3 Weeks(Group II)
oxidization and this result is thought to be caused by surface roughness. Machined surfaces actually show higher roughness and could be combined with oxygen, forming oxide layer, and induc- ing the osseointegration. However, there is room to discuss about the optimum roughness.
With regard to thickness of oxide layer, it was reported that when natural oxide layer was treat- ed with thermal or eletrochemical oxidization38, the thickness and the internal crystalization of oxide layer increased and the bone response improved, which is considered to be beneficial to stability.39 Sul et al showed that implants with oxide thick- ness of approximately 600, 800, 1000nm demon- strated significantly stronger bone reponses in the evaluation of removal torque value than implants with approximately 200nm thickness of oxide layer.38 Anodically oxidized (group II and III) implants used in this study had the oxide layer of 2~3㎛ thickness. There may be controversies but, in general, the optimum oxide thickness is known as around 1㎛.
In this study, ion beam-assisted deposistion (IBAD) was applied on the anodizing oxidization to make hydroxyapatite(HA) coating thin and even.
Recently published research revealed that the method of HA coating by IBAD on various sur- faces showed more favorable result in bone-to- implant contact (BIC) ratio and removal torque than other surface treatment methods. In Kim et al’s research21, BIC ratio at 10 weeks was the highest in HA-IBAD coated surface(roughness 1.24㎛), fol- lowed by anodic oxidization(roughness 1.02㎛), Sol-gel(roughness 1.12㎛), SLA(roughness 1.76㎛) and machined surface(roughness 0.86㎛).
In this present study, BIC ratios and bone area ratios increased at 6 weeks compared to 3 weeks.
At 3 weeks, no significant difference was found among the three groups. However, in the case of 6 weeks, group III showed the highest BIC ratio (0.38± 0.18) and bone area ratio (0.70± 0.15). High
BIC ratio and bone area ratio of group III is thought to be attributed by the excellent bond strength and appropriate dissolution time of the HA, and replacement the HA with bone. Since HA coating is replaced with new bone and then induces osseointegration, the dissolution rate, which measures the dissolution of Ca/P film thickness, becomes important. The dissolution rate could be controlled by heating coating layers or by adjusting the Ca/P ratio. However, since the heating process could cause a crack in coating lay- ers, using the Ca/P ratio is a more desirable way to decide the dissolution rate. Even though more research is required with regard to the Ca/P ratio and dissolution rate, this research used the HA with 1.67 Ca/P ratio.18In addition, regarding bone area ratio, group III showed sig- nificant difference between 3 and 6 weeks(p=0.038).
It was seen that IBAD + anodizing oxidization sur- face treatment contributed to better osseointegration than other surface treatment methods, and to a sig- nificantly faster bone formation and remodel- ling in the early phase. RFA values and PTVs at 6 weeks showed good influence of group III on ini- tial stability. Group III had the highest RFA val- ue (76.75± 5.89) at 6 weeks, comparison to group I(73.08± 7.19) and II(66.75± 9.88) with significant difference(p<0.05). With regard to the PTVs, PTV of group III(1.25± 2.34) was significantly low- er than that of group I(2.92± 2.07) at 6 weeks (p<0.05). This finding means that, compared to anodizing oxidization surface treatment, 500nm HA coating layer was appropriate to be resolved early and was successfully replaced with new bone.
However, appropriate ratio and thickness of Ca/P, which directly affects bone replacement time, should be further studied.
As a nondestructive methods to assess the degree of osseointegration, in implant stability, this research used RFA and PTV. According to Isidor(1998) and Schulte(1993), it was reported that
periotest values reflected bone resorption and BIC ratio.41,42Also, it was founded that RFA val- ues were influenced by the effective implant length, bone morphology and bone density.43,44 In this study, there was correlation between RFA values and bone area ratio of 3 weeks and those of 6 weeks respectively (p<0.05). As shown in the correlation result, RFA values better reflect the degree of bone formation than the PTVs. The RFA values of this study is thought to be attrib- uted by the direct reflection of bone quality and density on RFA values. In Yi et al’s clinical study29examining 333 implants, the correlation between RFA values and PTV was found.
However, it was also reported that PTV analysis by itself was not enough to evaluate stability.
In this present study, the decrease of RFA val- ues and the increase of the PTVs at 3 and 6 weeks is thought to result from poor bone qual- ity of beagle dogs 3 months after teeth extraction, mechanical bone relaxation by bone compression during implant insertion, biological changes dur- ing early bone healing period, beginning of mar- ginal bone loss. Regarding the changes of stability with time, it was found in Glauser et al4’s clini- cal research that, as a result of six month resonance frequency analysis, stability decreased until the first 3 weeks and then gradually increased.
Even though the biomechanism cycle of beagle dogs is known to be 1.5 times faster than that of human, the healing time of this present study(3 and 6 weeks) was relatively short to predict per- fect bone reformation. Since implants were insert- ed into immature bones(3 months after extraction), BIC ratio and bone area ratio were relatively low. Despite of low ratios, this research has a sig- nificance as a study on early stability in imperfect bone state. However, considering the limita- tions of this study such as small number of research animals and relatively short observation time, continuous study is required for gaining clin- ical support for this research.
CONCLUSION
The total 24 implants were divided into three groups according to surface treatment methods.
Following is the three groups of implants with dif- ferent surface treatment:
1) Group I(MAC) had machined surface.
2) Group II(ANO) was anodically oxidized with pulse power(Autoelectric Co., Korea).
3) Group III(IBA) was HA(Ca/P=1/1.67) coat- ed with 500 nm in thickness by IBAD on the anodically oxidized surface.
Within the limitations of this study, the fol- lowing conclusions were drawn:
1. In all three groups, the RFA values decreased and the PTVs increased as time passed from the first day to 3 and 6 weeks.
2. At 6 weeks, IBAD+anodic oxidization implant showed significantly higher RFA values(76.75
± 5.89) than anodic oxidization implant(66.75
± 9.88) and machined implant(73.08±
7.19)(p<0.05). On the other hand , at 6 weeks, machined implant showed significantly high- er PTVs(2.92± 2.07) than IBAD+anodic oxi- dization implant(1.25± 2.34)(p<0.05).
3. At 3 weeks, no significant difference was found from the bone-to-implant contact ratio and the bone area ratio of three different surface treatment methods.
4. At 6 weeks, different surface treatment meth- ods showed different bone-to-implant contact ratio(sig 0.006); IBAD+anodic oxidization implant(0.38± 0.18), anodic oxidization implant(0.36± 0.21), machined implant(0.21
± 0.14).
5. At 6 weeks, different surface treatment meth- ods showed different bone area ratio(sig 0.006); IBAD+anodic oxidization implant(0.70
± 0.15), machined implant(0.68± 0.14), anodic oxidization implant(0.52± 0.26).
6. In case of IBAD + anodic oxidization group, significant difference was found between the bone area ratios at 3 and 6 weeks(P<0.05).
7. Correlation was found between the RFA val- ues and the bone area ratios of 3 and 6 weeks(P<0.05).
As drawn above, IBAD + anodic oxidization implants showed significantly different RFA val- ues and PTVs in comparison with two other sur- face treatment implants. Also histomorphomet- rical analysis revealed that the IBAD + anodic oxi- dization implants showed significantly differ- ent bone-to-implant contact ratio and bone area ratio in comparison with two other surface treat- ment implants. This result is thought to provide a significant foundation to for further research in improving the initial stability of implants especially in case of poor bone quality or early loading implant. However, with regard to the correlation of analysis results, clinical research is needed.
REFERENCES
1. Jaffin RA, Berman CL. The excessive loss of Bra�ne- mark fixtures in type Ⅳ bone 5-year analysis. J Periodont 1991;62:2-4.
2. Lekholm M, Zarb GA. Patient selection and prepa- ration Tissue integrated Prostheses. J Periodont 1985;3:199-209.
3. Albrektsson T, Bra�nemark PI, Hansson HA, Kasemo B, Larsson K. The interface zone of inor- ganic implant in vivo ; Titanium implants in bone.
Ann Biomed Eng 1983;11:1-27.
4. Glauser R, Portmann M, Ruhstaller P. Initial implant stability using different implant designs and sur- gical techniques. Applied Osseointegration Research 2001;2:6-8.
5. Song WS, Kim YS, Kim CW, Lim YJ. Bone re- sponse of three different surface implants : histo- morphometric and resonance frequency analysis in dogs. J Korean Acad Prosthodont 2004;42:671- 678.
6. Zechner W, Tangl S, Fu¨rst G, Tepper G, Thams U, Mailath G, Watzek G. Osseous healing charac- teristics of three different implant types. Clin Oral Impl Res 2003;14:150-157.
7. Knobloch L, Larsen PA, Rashid B, Carr AB. Six- month performance of implants with oxidized
and machined surfaces restored at 2, 4, and 6 weeks postimplantation in adult beagle dogs. Int J Oral Maxillofac Implants 2004;19:350-356.
8. Yoshinari M, Ohtsuka Y, Derand T. Thin hy- droxyapatite coating produced by the ion beam dy- namic mixing method. Biomaterials 1994;25:529- 535.
9. Yoshinari M, Ozeki K, Sumii T. Properties of hy- droxyapatite-coated Ti-6Al-4V alloy produced ion plating method. Bull Tokyo Dent Coll 1991:32:147-156.
10. Overgaard S, Soballe K, Josephsen K, Hansen ES, Bunger C. Role of different loading conditions on resorption of hydroxyapatite coating evalu- ated by histomorphometric and stereological methods. J Orthopaedic and Sports Physical Therapy 1997;25:409.
11. Brossa F, Cigada AR, Chiesa R, Paracchini L, Consonni C. Post-deposition treatment effects on hydroxyapatite vacuum plasma spray coatings. J Master Sci Mater Med 1994;5:855-857.
12. Chen J, Tong W, Cao Y, Feng J, Zhang X. Effect of atmosphere on phase transformation in plasma sprayed hydroxyapatite coatings during heat treatment. J Biomed Mater Res 1997;34:15-20.
13. Cook SD, Thomas KA, Kay JF, Jarcho M.
Hydroxyapatite coated titanium for orthopedic implant applications. Clin Orthop 1988;232:225-243.
14. Ong JL, Chan DC. Hydroxyapatite and their use as coatings in dental implants : A review. Crit Rev Biomed Eng 2000;28(5-6):667-707.
15. Cui FZ, Luo ZS, Feng QL. Highly adhesive hy- droxyapatite coatings on titanium alloy formed by ion beam assisted deposition. J Master Sci Mater Med 1997;8:403-405.
16. Jeffcoat MK, McGlumphy EA, Reddy MS, Geurs NC, Proskin HM. A comparison of hydroxyap- atite(HA)-coated threaded, HA-coated threaded, HA coated cylindric, and titanium threaded en- dosseous dental implants. Int J Oral & Maxillofacial Implants 2003;18:406-410.
17. McGlumphy EA, Peterson LJ, Larsen PE, Jeffcoat MK. Prospective study of 429 hydroxyapatite- coated cylindric Omniloc implants placed in 121 pa- tients. Int J Oral & Maxillofacial Implants 2003;18:
82-92.
18. Jung YC, Han CH, Lee IS, Kim HE. Effects of ion beam-assisted deposition of hydroxyapatite on the osseointegration of endosseous implants in rabbit tibiae. Int J Oral & Maxillofacial Implants 2001;16:809-818.
19. Lee IS, Kim DH, Kim HE, Jung YC, Han CH.
Biological performance of calcium phosphate films formed on commercially pure Ti by elec- tron-beam evaporization. Biomaterials 2002;23:
609-615.
20. Park YS. The effect of ion beam-assisted deposition of hydroxyapatite on the grit-blasted surface of en-
dosseous implant in rabbit tibiae. Int J Oral &
Maxillofacial Implants 2005;20:31-38.
21. Kim SJ, Shin SW, Jung SM, Ryu JJ. A study on the stability of 5 different surface treatment methods to dental implant using resonance frequency and histomor-phometric analysis. J Korean Acad Pro- sthocont 2005;43:78-92.
22. Meredith N. On the clinical measurement of implant stability and osseointegration. Ph. D. thesis, Institute for Surgical Sciences, Go¨teborg University, Sweden, 1997.
23. Meredith N, Alleyne D, Cawley P. Quantitative de- termination of the stability of the implant-tissue in- terface using resonance frequency analysis, Clin Oral Impl Res 1996;7:221.
24. Meredith N, Book K. Friberg, Jemt T, Sennerby L.
Resonance frequency measurements of implant sta- bility in vivo. Clin Oral Impl Res 1997;12:226.
25. Meredith N, Rasmussen L, Sennerby L, Alleyne D.
Mapping implant stability by resonance frequen- cy analysis. Med Sci Research 1996;24:191.
26. Teerlink J. Perio test : An object clinical diagnosis of bone apposition toward implants. Int J Oral
& Maxillofacial Implants 1991;5:55-61.
27. Olive J, Aparicio C. The peiobest method as a measure of osseointegrated oral implant stability.
Int J Oral & Maxillofacial Implants 1990:5:390- 400.
28. Faulkner MG, Lipsett AW, Wolfarddt JF. The use and abuse of the periotest for 2 piece implant / abut- ment systems. Int J Oral & Maxillofacial Implants Vol. 16, 2001.
29. Yi YA, Cha IH, Lee HY, Han DH. The influencing factors of periotest value and implant stability quotient J Korean Acad Pro-sthocont 2006;44:40-50.
30. Ivanoff CJ, Sennerby L, Lekholm U. Influence of mono-and bicortical anchorage on the integra- tion of titanium implants. A study in the rabbit tib- ia. Int J Oral & Maxillofacial Surgery 1996;25:229- 235.
31. Buser D, Schenk RK, Steinemann S, Fiorelli JP, Fox CH, Stich H. Influence of surface characteristics on Bone integration of titanium implants. A his- tomorphometric study in miniature pigs. J Biomed Mater 1991;28:889-902.
32. Carlsson L, Rostlund T, Albrektsson T. Removal torques for polished and rough titanium implants.
Int J Oral & Maxillofacial Implants 1988;3:21-24.
33. Sul YT, Johansson CB, Wennerberg A, Cho LR, Chang BS, Albrektsson T. Optimum surface prop- erties of oxidized implnats for reinfofcement of os- seointegration: surface chemistry, oxide thcik- ness, porosity, roughness, and crystal structure. Int J Oral Maxillofac implants 2005;20:349-359.
34. Sennerby L, Thomsen P, Ericson LE. Ultrastructure
of the bone-titanium interface in rabbits. Journal of Materials Science: Materials in Medicine 1992;3:262- 271.
35. Sul YT, Johansson CB, Petronis S, Krozer A, Jeong Y, Wennerberg A, Albrektsson T. Characteristics of the surface oxides on turned and electrochem- ically oxidized pure titanium implnants up to di- electric breakdown : the oxide thickness, microp- ore configurations, surface roughness, crystal structure and chemical composition. Biomaterials 2002;23:491-501.
36. Eser Tufekci, William A. Brantley, John C. Mitchell.
Crystallographic Characteristics of Plasma-Sprayed Calcium Phospate coatings on Ti-6Al-4V. Int J Oral & Maxillofac Implants 1999;14:661-672.
37. Wennerberg A, Albrrektsson T. Suggested guide- lines for the topographic evaluation of implant sur- faces. Int J Oral & Maxillofacial Implants 2000;15:
331-344.
38. Sul YT, Johansson CB, Petronis S, Krozer A, Jeong Y, Wennerberg A, Albrektsson T. Resonance fre- quency and removal torque analysis of implants with turned and anodized surface oxides. Clin Oral Impl Res 2002;13:252-259.
39. Tayler GC, Waddington RZ, Moseley R, Williams KR. Influence of titanium oxide and titanium per- oxy gel on the breakdown of hyaluronan by reactive oxygen species. Biomaterials 1996;13:1212-19.
40. Choi JM, Kong YM, Kim S, Kim HE, Hwang CS, Lee IS. Formation and characterization of hydroxyapatite coating layer on Ti-based metal implant by electron- beam deposition. J Mater Res 1999;14:2980-2985.
41. Schulte W, d Hoedt B, lukas C. Periotest for mea- suring periodontal characteristics- dorrelation with periodontal bone loss. J of Periodontal Res 1992;27:184-190.
42. Chavez H, Ortman LF, DeFranco RL, Medige J.
Assessment of oral implant mobility. J Prosthet Dent 1993;70:421-426.
43. Meredith N, Cawley P, Alleyne D. Quantitative de- termination of stability of the implant-tissue interface using resonance frequency analysis. Clin Oral Implants Res 1996;7:261-267.
44. Huang HM, Chiu CL, Yeh CY, Lin LH, Lee SY.
Early detection of implant healing process using res- onance frequency analysis. Clin Oral Implants Res 2003;14:437-443.
Reprint request to:
KYU-WONSUH, D.D.S., M.S.D., PH.D.
DEPARTMENT OFPROSTHODONTICS,GRADUATESCHOOL OF MEDICINE,KOREAUNIVERSITY,
126-1, ANAM-DONG5 GA,SEOUNGBUK-GU,SEOUL,KOREA [email protected]