프랙탈 분석을 이용한 낭종 적출술 후 결손부 치유 양상에 관한 연구
임헌준
1·이승수
1·김원기
1·온병훈
1·최상문
1·오세리
1·민승기
1,2·이 준
1,21
원광대학교 치과대학 구강악안면외과학교실,
2원광 골재생 연구소
Abstract(J Korean Assoc Oral Maxillofac Surg 2011;37:477-82)
Study on bone healing process following cyst enucleation using fractal analysis
Hun-Jun Lim
1, Seung-Soo Lee
1, Won-Ki Kim
1, Byung-Hun Ohn
1, Sang-Moon Choi
1, Se-Ri Oh
1, Seung-Ki Min
1,2, Jun Lee
1,21
Department of Oral and Maxillofacial Surgery, School of Dentistry, Wonkwang University,
2
Bone Regeneration Research Institute, Wonkwang University, Daejeon, Korea
Introduction: Bone regeneration of cystic defects of the jaws after a cyst treatment requires lengthy healing periods. Generally, the bony changes are observed periodically through a visual radiographic reading as well as by the clinical opinion and radiographic images (panorama, periapical view), but it is difficult to compare the objective bony changes using only the radiographic density. In addition, it is difficult to observe minute bony changes through a visual radiographic reading, which can lead to a subjective judgment. This study exmined the bone density after the enucleation of a jaw cyst by fractal analysis.
Materials and Methods: Eighteen patients with a cystic lesion on the jaw were assessed. Panoramic radiographs were taken preoperatively, immediately postoperatively, and 1, 3, 6 and 12 months after cyst enucleation. The images were analyzed by fractal analysis.
Results: The mean fractal dimensions increased immediately after surgery and 3, 6 and 12 months postoperatively. The postoperative 6 and 12 months fractal dimension was similar to the controls.
Conclusion: Fractal analysis was used to overcome the limit of a subjective reading during an assessment of bone regeneration after cyst enucleation.
Key words: Cyst enucleation, Bone regeneration, Fractal dimension
[paper submitted 2011. 7. 16 / revised 2011. 9. 5 / accepted 2011. 10. 12]
조물에손상이예상될때는기능성
,
심미적인손상을최소 화하기위해일차적낭종적출술에앞서낭종 조대술이나 감압술을통하여낭종의크기를감소시킨뒤 이차적적출 술을시행하는것이선호되고있다1.
낭종치료후에낭종에의한악골의결손부의골재생에 는상당한시일이요구된다
.
보통임상소견과함께파노라 마사진,
치근단촬영등의방사선사진의시각적판독을통 해낭종주변의골변화양상을주기적으로관찰하는데,
이 때방사선사진판독시흑화도는촬영장치의종류,
노출시 간,
골조직의두께,
밀도및중첩되는연조직의두께에따라 다르기때문에단순히흑화도만으로는객관적인골변화 를비교하기어렵다2.
또한시각적판독은미세한골조직의 변화를감지하기힘들며주관적판단이개입될소지가있 다3.
최근에는디지털영상프로세싱에의한방사선영상을 정량적으로분석하는방법이다양하게연구되어골소주질 환에대한보다객관적이고정확한분석이가능해졌다4-6.
프랙탈
(fractal)
이란 일부 작은 조각이 전체와 비슷한기하학적 형태를 말한다
.
이런 특징은 자기유사성(self-
I. 서 론
낭종이란연조직혹은경조직내에액체나반고형물질 을함유하고있는상피성내막이덮힌 결합조직으로둘러 싸인비정상적인공동을말한다
.
악골에생긴낭종의경우 파노라마촬영과치근단사진으로충분한진단학적가치가 있다.
낭종벽은일반적으로방사선사진상에서 매끄러운 경계를갖는흰선으로나타나는것이보통이나이차감염 이있는경우에는경계가불규칙하게나타나기도한다.
낭 종의치료는외과적적출술로대부분완치가가능하나낭 종의크기가큰경우나외과적적출시인접한해부학적구이 준
302-120 대전시 서구 둔산 2동 1268번지 원광대학교 대전치과병원 구강악안면외과 Jun Lee
Department of Oral and Maxillofacial Surgery, Daejeon Dental Hospital, Wonkwang University 1268, Doonsan 2-dong, Seo-gu, Daejeon 302-120, Korea TEL: +82-42-366-1146 FAX: +82-42-366-1115 E-mail: [email protected]
*본연구는 2009년도원광대학교교내연구비지원에의해이루어짐.
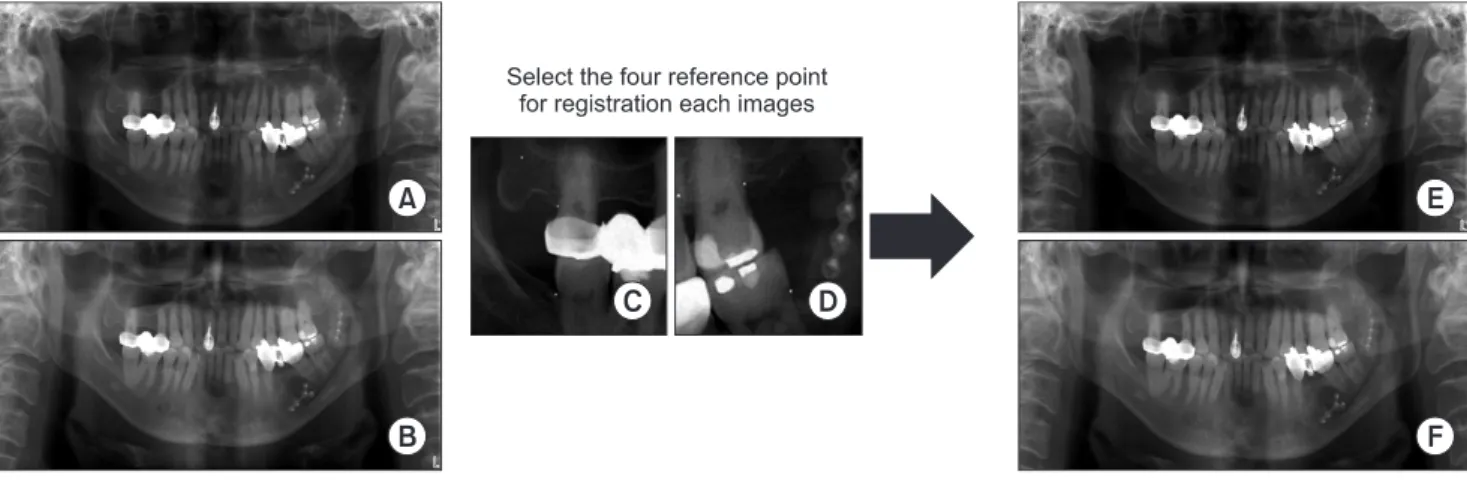
3. 영상 정합
변환된각환자별파노라마방사선사진은동일한조건 에서촬영했다 하더라도구조물의 이미지상에서의 좌표 값이 다르게얻어지게된다
.
영상 정합(image registration)
은서로 다른영상을변형하여하나의좌표계에나타나게 하는이미지처리과정이고, image subtraction tool program (Sunny, Biomedisys Co. Ltd., Seoul, Korea)
을사용하여수행 하였다.
낭종병소의좌표를동일하게하기위해서낭종과가까 운구조물
(
치아,
과두등)
에4
개의참고점(reference points)
을설정하여동일한좌표값으로변환하였다.(Fig. 1)
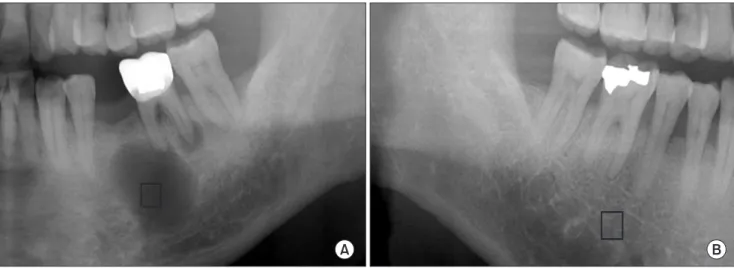
4. 관심 영역 설정
얻어진 영상에서 각 환자의 술 전 파노라마방사선 사 진의 병소부위에
50×50 pixel
크기의관심영역(region of interest, ROI)
을선택하였고(Adobe photoshop CS2),
술후1
일, 1
개월, 3
개월, 6
개월, 12
개월째영상에서 동일부위에 동일크기의ROI
를선택하였다.
대조군으로사용하기 위하여술 후
12
개월째파노라마 방사선사진에서 정상으로 간주하는반대측 동일부위에 동일크기의관심영역을선택하였다.(Fig. 2)
5. 영상 처리
획득된모든관심영역영상은
White
와Rudolph
7에의해 고안된방법을이용하여처리하였다.
우선가우시안필터(Gaussian filter=35 pixel)
를적용시켜미세한구조를제거 하고흑화도차이가큰구조만남도록하였다.
이렇게필터similarity)
이라고하며,
자기유사성을갖는기하학적구조를프랙탈구조
(fractal structure)
라고 한다.
이러한프랙탈 구조에서프랙탈차원값을 구하는프랙탈분석법이최근 영상분석에널리이용되고있으며,
치의학분야에서도치 조골이나악골의영상패턴의인지를위해이용되고있다.
본연구의목적은디지털파노라마방사선영상을이용 하여낭종적출술과골이식을시행한환자에서
,
프랙탈분 석을이용하여수술전과수술후시간경과에따른치유양 상에있어서의골변화를정량적으로분석하는것이다.
II. 연구 대상 및 방법
1. 연구 대상
본연구에서는
2007
년5
월부터2009
년4
월까지원광대 학교대전치과병원구강악안면외과에서낭종적출술후자 가골이식을시행한환자중술후12
개월까지경과관찰을 시행한18
명(
남자13
명,
여자5
명)
을연구대상으로선정하 였다.
2. 이미지 획득
파노라마방사선은
ProMax (Planmeca, Helsinki, Finland)
로촬영하였으며,
촬영조건은72 kV, 14 mA, 16 sec
이었고 모든파노라마방사선사진은1
명의방사선기사에의해촬 영되었다.
각환자의술전,
술후1
일,
술후1
개월, 3
개월, 6
개월, 12
개월째파노라마방사선사진은grayscale
의8 bit bitmap image
파일로 변환시켰다(Adobe photoshop CS2, Adobe systems Inc, San Jose, CA, USA).
Fig. 1. Image registration processing by image subtraction tool program (Sunny, Biomedisys Co. Ltd., Seoul, Korea). A, B. Before registration. C, D. Reference point selection. E, F. After registration.
Hun-Jun Lim et al: Study on bone healing process following cyst enucleation using fractal analysis. J Korean Assoc Oral Maxillofac Surg 2011
6. 프랙탈 차원 분석
영상 처리를 통해 얻어진 영상들을
Image J software
ver 1.42q (National Institutes of Health)
를이용하여box-
counting method
로프랙탈차원값을계산하였다.
7. 통계 처리
낭종적출술전과후경과시간에따른프랙탈차원의차
를적용한이미지를 원래의영상에서공제
(subtraction)
한후
, 128
을가산(add)
하였고,
이진화영상(binary image)
으로 만들었다.
이이원영상을침식연산
(erosion)
과팽창연산(dilation)
으로노이즈
(noise)
를감소시켜복잡한골소주분할영상을단순화시킨후골격선에불필요하게가지가많이생기는현 상을피하고자
hit or miss transformation
에의한골격화영 상(skeletonized image)
으로전환하였다(Image J program ver 1.42q, National Institutes of Health, Bethesda, MD, USA).(Fig. 3)
Fig. 3. Image processing. A. Original region of interest image. B. Gaussian blurring. C. Subtract between (A) and (B). D. Add 128. E.
Conversion to binary image. F. Erode and dilation. G. Skeletonize.
Hun-Jun Lim et al: Study on bone healing process following cyst enucleation using fractal analysis. J Korean Assoc Oral Maxillofac Surg 2011 Fig. 2. Selection of region of interest. A. Selection of lesion region of interest (ROI). B. Selection of control ROI.
Hun-Jun Lim et al: Study on bone healing process following cyst enucleation using fractal analysis. J Korean Assoc Oral Maxillofac Surg 2011
탈값의차이가 증가하여술후
6
개월, 12
개월째에유의성 있는차이를보였다(P<0.05). (Table 2)
각환자별로대조군프랙탈값과비교하여술후프랙탈 값의변화를비교하였을때
,
대조군과술전의프랙탈값의 차이는0.151±0.106
이었고,
술후1
일은-0.056±0.157,
술 후1
개월은0.133±0.139,
술후3
개월은0.100±0.103,
술후6
개월은0.049±0.115,
술후12
개월은-0.006±0.074
였다.
대 조군과비교하여술후1
일째에프랙탈값이증가하였다가 다시1
개월째감소하였으며이후3, 6, 12
개월째프랙탈값 이지속적으로증가하였고술후6, 12
개월째의프랙탈값 이대조군과통계학적으로유의성있게유사함을나타냈다(P > 0.05). (Table 3)
IV. 고 찰
골구조및낭종병소의치유를평가하기위한방법은다 양하다
.
골의미세구조는일반적으로조직형태학적으로 평가되어야하나임상적으로부적합한침습적인골생검을 시행해야한다는단점이있다.
일반방사선사진은골조직 을평가하는데빠르고비침습적이어서유용하면서저렴한 방법이지만,
방사선사진으로골구조를평가하기위해서는
30%
이상의무기질소실이있어야흑화도차이를구분할수있다는문제점이있다8
.
골구조평가를위한광학밀도
(optical density)
나방사선 사진을통과하는투과율(level of light transmittance)
을계측 하는X
선미량밀도측정(microdensitometry)
은민감도가떨 어지는측정법으로방사선기기의조작에따라 현저한차 이를나타낸다9.
또한디지털영상공제술
(digital subtraction radiography)
은시간경과에따라촬영된방사선사진을중첩시켜흑화 도의상대적변화를측정할수있으나,
일련의방사선사진 을 동일하게촬영하는 특별한장치가 필요하고상대적인 변화만을감지할 수있다10.
낮은선량의방사선을골에직 접조사시켜통과하는양을측정하여밀도를계산하는방 법으로흡수계측법(absorptiometry)
이있다.
그러나골밀도 이는two-way repeated-measures ANOVA
로 분석되었다(SPSS program ver 17.0, SPSS Inc., Chicago, IL, USA).
III. 결 과
총
18
명의환자를낭종적출술전,
술후1
일, 1
개월, 3
개 월, 6
개월, 12
개월째에촬영한디지털파노라마방사선사 진을이용하여분석하였다.
환자연령은25-69
세(
평균연령44.2
세)
였으며,
남자가13
명,
여자가5
명이었다. 18
명중조 직검사로진단된진단명은함치성낭종7
명,
치근낭종9
명,
치성각화낭종2
명이었다.
병소의부위는상악전방부3
명,
하악전방부3
명,
하악구치부12
명이었다.
모든환자는낭 종적출술시행후자가입자망상골이식을시행하였다.
환자들의수술전 관심영역의평균프랙탈값은
1.108±
0.097
였고,
술후1
일째증가(1.175±0.139)
하였다가,
술후1
개월째다시감소(1.126±0.117)
하였고,
그후3
개월(1.166
±0.101), 6
개월(1.217±0.108), 12
개월(1.259±0.065)
째에증 가하는양상을보였다.
술후12
개월째의프랙탈값은대조군인정상악골의관심영역의프랙탈값
(1.259±0.055)
과유사하였다
.(Table 1)
각환자별로술전프랙탈값과비교하여술후프랙탈값 의변화를비교하였을때
,
술후1
일과술전의프랙탈값의 차이는-0.067±0.147
이었고,
술 후1
개월은-0.029±0.150,
술후3
개월은-0.067±0.095,
술후6
개월은-0.112±0.108,
술후12
개월은-0.149±0.092
였다.
술전과비교하여술후1
일째 프랙탈값이감소하였다가술후1
개월째부터프랙Table 1. The change of fractal dimension over time Time Average Standard
deviation
95% confidence interval Minimum Maximum Pre-operative
Post 1 day Post 1 month Post 3 months Post 6 months Post 12 months
1.108 1.175 1.126 1.166 1.217 1.259
0.097 0.139 0.117 0.101 0.108 0.065
1.059 1.106 1.064 1.114 1.157 1.224
1.156 1.244 1.188 1.218 1.276 1.293 Hun-Jun Lim et al: Study on bone healing process following cyst enucleation using fractal analysis. J Korean Assoc Oral Maxillofac Surg 2011
Table 2. Comparison with pre-operative fractal dimensions Time
(I) Time
(J)
Average difference
(I-J)
Standard
deviation P-value Pre-operative Post 1 day
Post 1 month Post 3 months Post 6 months Post 12 months
-0.067 -0.029 -0.067*
-0.112*
-0.149*
0.147 0.150 0.095 0.108 0.092
0.070 0.456 0.010 0.001 0.000 (*P<0.05)
Hun-Jun Lim et al: Study on bone healing process following cyst enucleation using fractal analysis. J Korean Assoc Oral Maxillofac Surg 2011
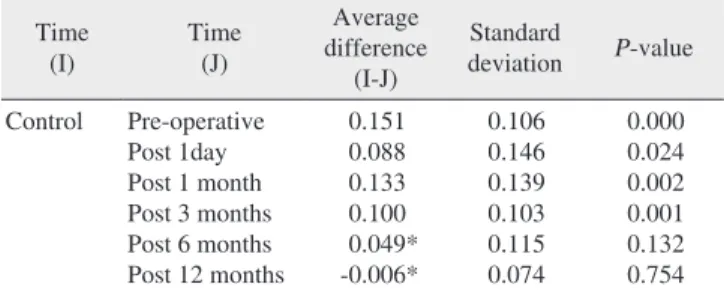
Table 3. Comparison with control group fractal dimensions Time
(I) Time
(J)
Average difference
(I-J)
Standard
deviation P-value Control Pre-operative
Post 1day Post 1 month Post 3 months Post 6 months Post 12 months
0.151 0.088 0.133 0.100 0.049*
-0.006*
0.106 0.146 0.139 0.103 0.115 0.074
0.000 0.024 0.002 0.001 0.132 0.754 (*P>0.05)
Hun-Jun Lim et al: Study on bone healing process following cyst enucleation using fractal analysis. J Korean Assoc Oral Maxillofac Surg 2011
다시감소한후지속적으로증가하여술후
6, 12
개월째통 계학적으로유의성있는차이를보였다.
술후1
일째프랙 탈값이일시적으로증가한것은자가망상골이식으로인 한관심 영역의골소주와골수강의구조가복잡해짐에의 한것으로생각되며,
이식된골의흡수에따라감소하였다 가골치유가되어감에따라증가하는것으로생각된다.
또 한대조군인정상영역과비교하였을때,
술후6, 12
개월째 의프랙탈값이대조군과유사함을나타내어골치유가정 상에가깝게이루어졌음을확인했다.
끝으로
,
이번연구에서는종전의시각적판단에의한방 사선사진판독의단점을보완하여,
프랙탈차원의값을계 산하여낭종적출술후골치유에대해정량적으로분석하 여치유양상과프랙탈분석의유효성을검증하였다.
결론 적으로프랙탈분석으로낭종적출술후의골치유에대한 변화를정량적으로인지할수있었다.
향후프랙탈분석에 사용되는관심영역의정확한선택방법에대한보완이이 루어진다면방사선학적분석에있어서유용한방법으로확 립될수있을것이다.
V. 결 론
악골낭종 적출술을시행한
18
명의 환자를대상으로하 여치료전과술후1
일, 1, 3, 6, 12
개월의디지털파노라마 방사선영상을이용하여프랙탈분석법에의하여골치유 양상을평가한결과다음과같은결론을얻었다.
1.
낭종적출술후술전과비교하여관심영역의프랙탈값은술후
6, 12
개월에서유의성있게증가하였으며,
이는프랙탈값과골변화사이에상관관계가있음을 나타낸다
.
2.
대조군과비교하여술후6, 12
개월의프랙탈값이유사함을보여골치유가정상에 가깝게이루어졌음이 확인되었다
.
3.
프랙탈분석법은 악골의골치유에대한방사선학적 변화의정량적평가에있어서유용한방법이다.
프랙탈 분석을이용한 디지털파노라마영상의 분석은 시각적판독의주관적판단의개입과흑화도만으로평가 하는 방법의단점을보완하여골 치유양상을정량적으로 보여준다.
향후프랙탈분석이좀더객관적이고신뢰할만 한결과를얻기위해관심영역의정확한설정을위한방법 연구및프랙탈값에영향을주는변수에대한연구가더필 요할것이고,
복잡한이미지처리를단순화해주는프로그 램의개발이이루어진다면방사선학적영상분석에있어서 가장좋은방법중하나가될것이다.
References
1. Peterson LJ. Contemporary oral and maxillofacial surgery. 4th ed.
를측정하는이방법은후향적으로사용할수없고
,
공제술 처럼밀도의상대적인변화만을감지할수있다.
방사선사진영상에서판독의정량화및 객관화를위해 텔레비전방사선평가
,
비디오밀도측정(videodensitometry)
에의해방사선사진의농도를측정하여정량화하려는시 도가있었으나여러가지한계에부딪혔다9,11.
1983
년Mandelbrot
12는골구조의자기유사성(self-simi-
larity)
을보이는구조를정량화하여 소수차원으로구하여이를통해 구조의복잡도를비교하는수단으로프랙탈분 석법을소개하였다
.
프랙탈의수학적속성은확대나축소 에관계없이동일한모양의프랙탈형태를나타낼수있으 며프랙탈도형의특징은프랙탈차원을갖는다는것이다.
대상의복잡도가증가할수록프랙탈차원은더커지게된다
. Ruttimann
등13은치조골을탈회시키기전과후의프랙탈값을구하여탈회후프랙탈값이증가한다고보고한이 후골소주의형태가프랙탈구조를이루고있음을주목하 게되었다
.
골밀도와골소주의방향의변화는비선형적이 고무질서한데프랙탈기하학은구조물의형태가균일하고 규칙적이지않더라도구조물을기하학적용어로정량화하 여특성을표현할수있게해준다14.
Lee
등15은소의장골을탈회시켜프랙탈값을비교한결과 탈회가 진행됨에 따라 프랙탈값이 감소한다고 보고
하였다
. Khosrovi
등16은 치주질환에이환된 치조골이정상치조골과비교하여프랙탈값이더작다고보고하였다
.
Tosoni
등17은파노라마방사선사진에서정상과 골다공증가능성이있는군의하악각부위에서의프랙탈값의 비교 연구를시행하여골다공증의심군이정상군에비해 프랙 탈값이낮음을보고하였다
.
이후많은연구들에서프랙탈분석이골변화를인지하 는데유용한방법이라는것이입증되었으나이분석을디 지털영상분석의정확한정량적분석방법이라고하기에는 문제점이있다18
.
프랙탈분석방법은 대상의특성에 따라 다양하여caliper method, tile counting method, pixel dilation methiod, box counting method, intensity variance method, hurst method, variation method, blanket method
및spatial and spectral method
등많은방법들이있다19,20.
이상의방법 들이연관성이있기는하지만모두같은 결과를나타내지 않고,
대상의이상적인프랙탈성질을가질때에만결과가 같게된다18. Southard
등21은방사선사진촬영시적은양의 기하학적요인도프랙탈차원에영향을줄수있다고하였 고, Shrout
등22,23은관심영역의크기와모양이프랙탈차원 의값에영향을미친다고하였다.
또한프랙탈분석시관심 영역을동일한좌표값에 설정하는 것이어렵다는보고도있다24
. Majumdar
등25은프랙탈차원값은해상도가감소할수록감소하게된다고하였다
.
이번연구에서는
,
분석결과 관심영역의프랙탈 값들이 술전과비교하여술후1
일째증가하였다가술후1
개월째98-110.
14. Weibel ER. Fractal geometry: a design principle for living organisms.
Am J Physiol 1991;261:L361-9.
15. Lee KI, Choi SC, Park TW, You DS. Fractal dimension calculated from two types of region of interest. Dentomaxillofac Radiol 1999;28:284-9.
16. Khosrovi PM, Kahn AJ, Majumdar HK, Genant CA. Fractal analysis of dental radiograph to assess trabecular bone structure. J Dent Res 1994;73:173.
17. Tosoni GM, Lurie AG, Cowan AE, Burleson JA. Pixel intensity and fractal analyses: detecting osteoporosis in perimenopausal and postmenopausal women by using digital panoramic images. Oral Surg Oral Med Oral Pathol Oral Radiol Endod 2006;102:235-41.
18. Lee JM, Park H, Jeong HG, Kim KD, Park CS. Bony change of apical lesion healing process using fractal analysis. J Korean Oral Maxillofac Radiol 2005;35:91-6.
19. Geraets WG, van der Stelt PF. Fractal properties of bone.
Dentomaxillofac Radiol 2000;29:144-53.
20. Cha SY, Han WJ, Kim EK. Usefulness of fractal analysis for the diagnosis of periodontitis. Korean J Oral Maxillofac Radiol 2001;31:35-42.
21. Southard TE, Southard KA, Jakobsen JR, Hillis SL, Najim CA.
Fractal dimension in radiographic analysis of alveolar process bone. Oral Surg Oral Med Oral Pathol Oral Radiol Endod 1996;
82:569-76.
22. Shrout MK, Hildebolt CF, Potter BJ. The effect of varying the region of interest on calculations of fractal index. Dentomaxillofac Radiol 1997;26:295-8.
23. Shrout MK, Potter BJ, Hildebolt CF. The effect of image variations on fractal dimension calculations. Oral Surg Oral Med Oral Pathol Oral Radiol Endod 1997;84:96-100.
24. Baek JW, Seok M, Lee ES, Jang HS, Rim JS. Radiologic assess- ment of bone healing by fractal analysis after the treatment of jaw bone cyst by decompression. J Korean Oral Maxillofac Surg 2007;
33:494-8.
25. Majumdar S, Weinstein RS, Prasad RR. Application of fractal geometry techniques to the study of trabecular bone. Med Phys 1993;20:1611-9.
St. Louis: Mosby; 2003:489-91.
2. Goaz PW, White SC. Origin of dental radiology. Oral Radiology:
Principals and Interpretations. 2nd ed. St. Louis: Mosby; 1987:86- 9.
3. Nicopoulou-Karayianni K, Bragger U, Patrikiou A, Stassinakis A, Lang NP. Image processing for enhanced observer agreement in the evaluation of periapical bone changes. Int Endod J 2002;35:615- 22.
4. Orstavik D. Radiographic evaluation of apical periodontitis and endodontic treatment results: a computer approach. Int Dent J 1991;41:89-98.
5. Kerosuo E, Orstavik D. Application of computerised image analysis to monitoring endodontic therapy: reproducibility and comparison with visual assessment. Dentomaxillofac Radiol 1997;26:79-84.
6. Jorge EG, Tanomaru-Filho M, Gonçalves M, Tanomaru JM.
Detec tion of periapical lesion development by conventional radio- graphy or computed tomography. Oral Surg Oral Med Oral Pathol Oral Radiol Endod 2008;106:e56-61.
7. White SC, Rudolph DJ. Alterations of the trabecular pattern of the jaws in patients with osteoporosis. Oral Surg Oral Med Oral Pathol Oral Radiol Endod 1999;88:628-35.
8. Brynolf I. Radiography of the periapical region as a diagnostic aid. II. Diagnosis of pulp-related changes. Dent Radiogr Photogr 1979;52:25-47.
9. Kälebo P, Strid KG. Radiographic videodensitometry for quantita- tive monitoring of experimental bone healing. Br J Radiol 1989;62:
883-9.
10. Kim EK. Contrast and geometric correction of non-standardized radiographs in digital subtraction radiography. J Korean Periodontol 1998;28:797-809.
11. Kasle MJ, Klein AI. Television radiographic evaluation of peri- apical osseous radiolucencies. Oral Surg Oral Med Oral Pathol 1976;41:789-96.
12. Mandelbrot BB. The fractal geometry of nature. 2nd ed. New york:
W. H. Freeman; 1983.
13. Ruttimann UE, Webber RL, Hazelrig JB. Fractal dimension from radiographs of peridental alveolar bone. A possible diagnostic indicator of osteoporosis. Oral Surg Oral Med Oral Pathol 1992;74: