Computational Quantification of the Cardiac Energy
Consumption during Intra-Aortic Balloon Pumping Using a Cardiac Electromechanics Model
To quantify the reduction in workload during intra-aortic balloon pump (IABP) therapy, indirect parameters are used, such as the mean arterial pressure during diastole, product of heart rate and peak systolic pressure, and pressure–volume area. Therefore, we investigated the cardiac energy consumption during IABP therapy using a cardiac electromechanics model. We incorporated an IABP function into a previously developed electromechanical model of the ventricle with a lumped model of the circulatory system and investigated the cardiac energy consumption at different IABP inflation volumes. When the IABP was used at inflation level 5, the cardiac output and stroke volume increased 11%, the ejection fraction increased 21%, the stroke work decreased 1%, the mean arterial pressure increased 10%, and the ATP consumption decreased 12%. These results show that although the ATP consumption is decreased significantly, stroke work is decreased only slightly, which indicates that the IABP helps the failed ventricle to pump blood efficiently.
Key Words: Intra-Aortic Balloon Pump; Cardiac Electromechanics Model; ATP Consumption;
Stroke Work Ki Moo Lim,1,* Jeong Sang Lee,2,*
Min-Soo Gyeong,3 Jae-Sung Choi,2 Seong Wook Choi,3 and Eun Bo Shim3
1Department of Medical IT Convergence Engineering, Kumoh National Institute of Technology, Gumi; 2Department of Thoracic and Cardiovascular Surgery, Seoul National University College of Medicine, & SMG-SNU Boramae Hospital, Seoul; 3Department of Mechanical and Biomedical Engineering, Kangwon National University, Chuncheon, Korea
*Ki Moo Lim and Jeong Sang Lee contributed equally to this work.
Received: 13 August 2012 Accepted: 9 September 2012 Address for Correspondence:
Eun Bo Shim, PhD
Department of Mechanical & Biomedical Engineering, Kangwon National University, 1 Kangwondaehak-gil, Chuncheon, 200-701, Korea
Tel: +82.033-250-6318, Fax: +82.033-257-6595 E-mail: [email protected]
This work was supported by the NRL (National Research Lab) program of National Research Foundation of Korea (No. ROA- 2008-000-20127-0) and NRF grant (No. 2012-0008820).
http://dx.doi.org/10.3346/jkms.2013.28.1.93 • J Korean Med Sci 2013; 28: 93-99
INTRODUCTION
The intra-aortic balloon pump (IABP) is used to increase myo- cardial oxygen perfusion, while at the same time increasing car- diac output and decreasing the workload of the ventricle. This is realized via counter-pulsation of the IABP. Several parameters affect IABP treatment, such as the volume of the balloon, its lo- cation in the aorta, its rate of inflation and deflation, and the phase of IABP pumping. Several researchers have examined the effects of various parameters on IABP function in terms of increasing myocardial oxygen perfusion and decreasing the workload of the ventricle. When the volume of blood used to inflate and deflate the balloon increases, the IABP functions were improved (1). Inflation of the IABP at end-systole and de- flation of the IABP at end-diastole were the optimal pumping phase in order to decrease the ventricle workload and increase aortic pressure during diastole, thereby increasing myocardial
oxygen perfusion (2).
To quantify the reduction in workload, indirect parameters are used, such as the mean systolic pressure (3), product of heart rate and peak systolic pressure (3), and pressure–volume area (4).
No study has quantified the reduction in workload with IABP directly because experimental methods for documenting and evaluating myocardial energy consumption throughout the ventricular volume are hampered by low spatiotemporal reso- lution. Computational modeling is an alternative approach that overcomes this limitation. However, the previous computation- al models of the cardiovascular system and IABP used a simple lumped model of the cardiovascular system, which cannot cal- culate the contractile cardiac energy consumption directly.
Previously, we developed a computational model of left ven- tricular assist device support using a three-dimensional elec- tromechanical model of failing canine ventricles together with a lumped model of the circulatory system (5, 6). This model en-
abled us to quantify the changes in the local contractile energy consumption of the myocardium. In this study, we incorporat- ed IABP function into the electromechanical model of a ventri- cle with a lumped model of the circulatory system. Then, we used the model to investigate the changes in the contractile en- ergy consumption of the myocardium with an IABP using dif- ferent inflation volumes.
MATERIALS AND METHODS Model description
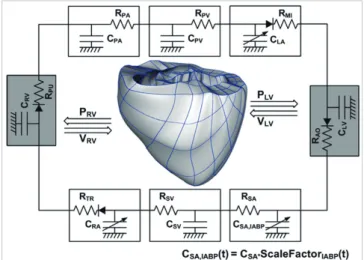
The IABP-implanted cardiovascular system model was imple- mented by combining a three-dimensional (3D) finite element (FE) electromechanical model of the failed heart, a lumped mod- el of the circulatory system, and a model of IABP function. Fig. 1 shows a schematic of the integrated model (A) and myofilament dynamics, which were adapted from Rice et al. (7). The models are described in detail below.
3D cardiac electromechanical model of the failing heart We used an anatomically accurate 3D-FE electromechanical model of failing canine ventricles, which incorporated a bio- physical representation of cardiac myofilament dynamics (8).
The electrical model based on the membrane dynamic model of Fox et al. (9) used magnetic resonance (MR) image-based canine ventricle geometry with approximately 1,400,000 nodes and 1,700,000 elements, which were developed using linear in- terpolation. The mechanical model based on the myofilament
dynamic model of Rice et al. (7) used the same canine ventricle geometry with 356 nodes and 172 elements, which were devel- oped using Hermite polynomials. Both meshes also have realis- tic fiber and laminar sheet structural information obtained from the diffusion tensor (DT) MR image. The passive mechanical properties of the myocardium were assumed to be transversely isotropic, hyperelastic, and nearly incompressible, defined by an exponential strain energy function. The local electrical acti- vation times in the electrical mesh were mapped to the mechan- ical mesh. Fig. 2 shows the electrical activation time mapped to the mechanical mesh. Here, the local electrical activation time is defined as the instant at which transmembrane voltage ex- ceeds 0 mV.
As an electrical wave propagates through the heart, the de- polarization of each myocyte initiates the release of calcium (Ca) from intracellular stores. This is followed by the binding of Ca to troponin C and cross-bridge cycling. The cross-bridge cycling forms the basis for contractile protein movement and the de- velopment of active tension in the cell, resulting in deformation of the ventricles. These physiological contractile mechanisms are considered in the myofilament model (7).
To consider remodeling of the passive electromechanical properties associated with heart failure (HF), several changes were made to the electromechanical model (Table 1). First, we used the dilated geometry of a canine ventricle with heart fail- ure (HF) (8). Then, the electrical conductivity was reduced by 30%, allowing for a total electrical activation time of 150 ms, ac- cording to the experimental results of Helm et al. (10). Third, to account for the increased stiffness of the failing myocardium, the passive scaling constant in the strain–energy function was increased fivefold (11). Finally, to introduce systolic dysfunction,
Fig. 1. Schematic diagram of the finite-element ventricular electromechanical model coupled with the circulatory model (A). PRV, RV pressure; VRV, RV volume; PLV, LV pres- sure; VLV, LV volume; RPA, pulmonary artery resistance; CPA, pulmonary artery compli- ance; RPV, pulmonary vein resistance; CPV, pulmonary vein compliance; RMI, mitral valve resistance; CLA, left atrium compliance; RAO, aortic valve resistance; RSA, system- ic artery resistance, RSA,IABP, the resistance of IABP-implanted systemic arteries; CSA, systemic artery compliance; RSV, systemic vein resistance; CSV, systemic vein compli- ance; RTR, tricuspid valve resistance; CRA, right atrium compliance; and RPU, pulmonary valve resistance. CSA,IABP is calculated as the product of CSA and a scale factor for the IABP effects.
Table 1. Flow, stroke volume, ejection fraction, pulse efficiency for failure and patho- logical model according to the compliance change
Heart failure considering References
1 Remodeled geometry Gurev et al. (8)
2 Reduced electrical conductivity Helm et al. (10) 3 Increased stiffness of failing myocardium Wu et al. (11) 4 Systolic dysfunction
(remodeled cellular Ca transient) O’Rourke et al. (12) Fig. 2. Electrical activation time mapped to mechanical component of ventricular computational mesh. The activation time is defined as the instant at which trans- membrane voltage exceeds 0 mV. EAT indicates electrical activation time.
the peak and time constant of the calcium transient function ([Ca](t) of Eq. 55 in the myofilament model of Rice et al. (7)), which served as an input, were reduced to 70% of the normal values. This resulted in a calcium transient with a reduced peak and prolonged relaxation rate, which are the key features of the remodeled Ca transient in HF (12).
Combining the ventricle model with the circulatory and IABP models
We combined the FE heart model with a lumped model of the circulatory system and IABP to predict the cardiovascular re- sponse during IABP therapy. The model is formulated as an elec- trical analog model consisting of elements such as resistors, ca-
pacitors, and diodes. Using the hemodynamic parameters re- lated to blood circulation, this model calculates the pressure, volume, and blood flow for each of the six compartments mak- ing up the vascular system and atria (Fig. 1): the systemic arteries and veins, pulmonary arteries and veins, left atrium, and right atrium. Individual elements in every compartment are mod- eled by considering the local resistance to blood flow and com- pliance of blood vessels. The atria are modeled as two-chamber pumps with time-varying compliance. The inertia of blood is ignored due to its relatively small effect on the canine cardio- vascular response. The four heart valves that surround the ven- tricles and control the blood flow direction are modeled by di- odes and resistances.
Pressure (mmHg) Pressure (mmHg)
Time (ms) Time (ms)
0 600 1,200 0 600 1,200
250 200 150 100 50 0
250 200 150 100 50 0
Left ventricle Left ventricle
Aorta Aorta
A B
Pressure (mmHg) Pressure (mmHg)
Time (ms) Time (ms)
0 600 1,200 0 600 1,200
250 200 150 100 50 0
250 200 150 100 50 0
Left ventricle Left ventricle
Aorta Aorta
C D
Pressure (mmHg) Pressure (mmHg)
Time (ms) Time (ms)
0 600 1,200 0 600 1,200
250 200 150 100 50 0
250 200 150 100 50 0
Left ventricle Left ventricle
Aorta Aorta
E F
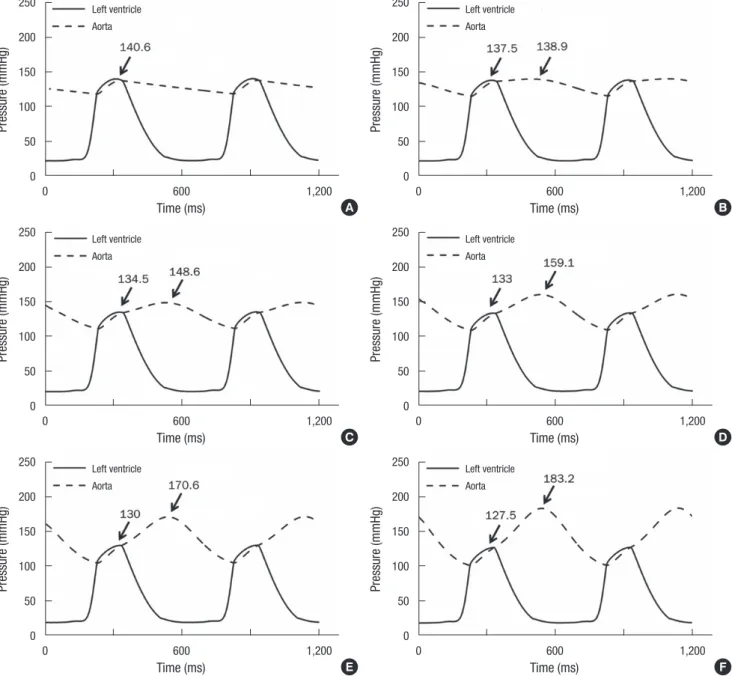
Fig. 3. Simulated pressure waveform in the LV and systemic artery. HF without IABP support (A), and HF with the IABP operating at levels 1 (B), 2 (C), 3 (D), 4 (E), and 5 (F).
Briefly, the IABP component was modeled as the time-vary- ing compliance of the systemic arteries. To generalize the pat- terns of inflation and deflation of an IABP, a harmonic wave- form was used for the time-varying compliance of the systemic arteries. The harmonic waveforms for the compliance of the aorta were expressed as follows:
CSA,IABP (t) = CSA× SFIABP (t) (1)
SFIABP (t) = (1-sf) + sf × cos
(
2πt - ø)
(2)BCL
Here, CSA,IABP is the time-varying compliance of the systemic arteries with the IABP, CSA is the compliance of the systemic ar- teries without the IABP, SFIABP is a scale factor for the IABP, sf is the level of the scale factor, BCL indicates the basic cycle length of the ventricle, and ø indicates the time shift between the ven- tricular contraction cycle and IABP inflation cycle. The sf is ma- jor parameter which is proportional to the stroke volume of IABP and related to the pumping compliance of IABP. In this study, sf was given values of 0.05, 0.1, 0.15, 0.2, and 0.25, and ø was set to 3.66 radians (350 ms shift), instead of end-systole.
RESULTS
Fig. 2 shows the simulated pressure waveforms in the LV and systemic artery under HF (A), and HF with the IABP operating
at level 1 (sf = 5%, B), 2 (sf = 10%, C), 3 (sf = 15%, D), 4 (sf = 20%, E), and 5 (sf = 25%, F). The mean arterial pressure under HF was 125 mmHg, which matches that in congestive heart failure. As the level of IABP treatment was increased, the aortic pressure during diastole, which is related to coronary perfusion, increased and the left ventricular peak pressure during systole, which is related to the after-load, decreased.
Fig. 3 shows the calculated transmural distribution of the con- tractile ATP consumption rates at end systole and end diastole for HF without an IABP (Fig. 3A), and the model with the IABP operating at level 5 (Fig. 3B). The ATP consumption rate changed significantly in the left ventricle rather than the right during sys- tole. The contractile ATP consumption decreased significantly in the presence of the IABP. Compared with the case involving HF without an IABP, the contractile ATP consumption decreased by 12% with IABP therapy (see the ATP consumption rate in Table 2).
Fig. 4 shows the calculated transmural distribution of the fi- ber strain at end systole and end diastole for HF without an IABP (Fig. 4A) and the model with the IABP operating at level 5 (Fig.
4B). The fiber strain decreased significantly in the presence of the IABP.
Fig. 5 shows the pressure–volume curves for the six cases stud- ied: HF without IABP therapy, and HF with the IABP at levels 1 to 5. The pressure–volume curves shifted to the left and down-
Fig. 4. Transmural distribution of the ATP consumption rate. Heart failure ventricles without IABP support (A) and with IABP support at level 5 (B).
A end-systole
HF
end-diastrole
B end-systole
HF with IABP
end-diastrole
consumption ATP rate 0.004
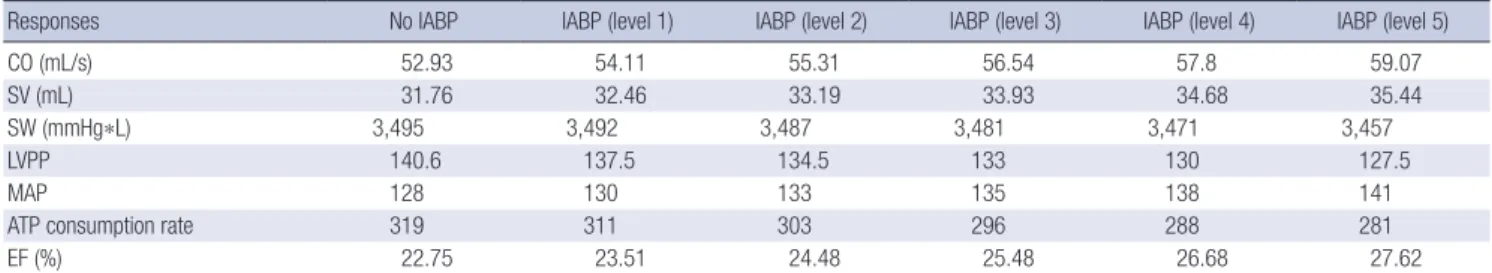
0 Table 2. Hemodynamic responses for HF and HF with the IABP according to the compliance change
Responses No IABP IABP (level 1) IABP (level 2) IABP (level 3) IABP (level 4) IABP (level 5)
CO (mL/s) 52.93 54.11 55.31 56.54 57.8 59.07
SV (mL) 31.76 32.46 33.19 33.93 34.68 35.44
SW (mmHg*L) 3,495 3,492 3,487 3,481 3,471 3,457
LVPP 140.6 137.5 134.5 133 130 127.5
MAP 128 130 133 135 138 141
ATP consumption rate 319 311 303 296 288 281
EF (%) 22.75 23.51 24.48 25.48 26.68 27.62
IABP, intra-aortic balloon pump; CO, cardiac output; SV, stroke volume; SW, stroke work; LVPP, left ventricular peak pressure; MAP, mean arterial pressure; EF, ejection fraction.
Fig. 5. Transmural distribution of the mechanical strain. Heart failure ventricles without IABP support (A) and with IABP support at level 5 (B).
A end-systole
HF
end-diastrole
B end-systole
HF with IABP
end-diastrole
Fiber strain 0.1
0
ward. The end-diastolic volume decreased by 8 mL (Fig. 6); this indicates that the IABP results in ventricular volume unloading by reducing the end-diastolic volume.
Table 2 shows the hemodynamic responses for HF and HF with the IABP at levels 1 to 5. While the cardiac output and stroke volume increased, the stroke work and ATP consumption de- creased with IABP therapy due to the pressure unloading effect.
The decreased left ventricular peak pressure also indicates the pressure unloading effect during IABP therapy.
DISCUSSION
This study investigated the changes in the contractile energy consumption of the myocardium with IABP with different in- flation volumes using a cardiac electromechanical model with a lumped model of the circulatory system and IABP function.
To generalize the patterns of inflation and deflation of the IABP, a harmonic waveform was used for the time-varying compliance of the systemic arteries. According to the IABP inflation volume,
the arterial pressure increased during diastole, while the ventric- ular peak pressure decreased, which indicates improved coro- nary perfusion and ventricular unloading. To estimate the change in the ventricular workload directly, the contractile ATP con- sumption of the ventricle was computed (Fig. 3). With greater inflation, the ATP consumption decreased significantly. The transmural distribution of the mechanical strain was also com- pared between HF ventricles and HF ventricles with an IABP at level 5 in order to estimate the volume-unloading effect of the IABP (Fig. 4). The fiber strain also decreased significantly with an IABP. The pressure–volume diagrams in Fig. 5 were consis- tent with the fiber strain distributions.
The contractile ATP consumption and fiber strain varies trans- murally. In general, the sarcomere length affects the density of effective cross-bridges and therefore the contractile force; this is known as the Frank–Starling law of the heart. A longer sarco- mere length results in greater contractile ATP consumption be- cause of the greater density of the attached cross bridges in my- ocytes, as expressed in Eq. 3 in the Appendix. Previously, we demonstrated that myofibers in the endocardium have greater end-diastolic lengths than myofibers in the mid-myocardium and epicardium (6). Fig. 4 also shows that the end-diastolic strain and ATP consumption rate of the endocardial sarcomere are greatest. This explains why the contractile ATP consumption by the endocardium was greater than that at the mid-wall or epi- cardium (Figs. 3 and 4). The cardiac output, stroke volume, stroke work, MAP, ATP consumption rate, and ejection fraction are all increased with IABP treatment (Table 2). Interesting point is that although the ATP consumption is decreased significantly, stroke work is decreased only slightly, which indicates that the IABP helps the failed ventricle to pump blood efficiently.
There are several limitations. We used an image-based elec- tromechanical model of failing canine ventricles, in which the ventricular geometry, fiber architecture, and hemodynamics differ from those of human ventricles. We also considered only Fig. 6. The pressure–volume curves for the six cases studied. Heart failure without
IABP therapy, and HF with the IABP at levels 1 to 5.
Volume (mL)
HF Level 1 Level 2
Level 3 Level 4 Level 5
Pressure (mmHg)
80 120
200
100
0
the contractile ATP consumption of the myocardium, although ATP is used in other ways, such as by sarcoplasmic/endoplasmic reticulum calcium ATPase (SERCA), plasma membrane Ca- ATPase (PMCA), and Na pumps. Their functions are changed at failing heart condition (13-15). Finally, we did not considered remodeled electrical activities of myocardial cell in failing heart.
We assumed that the electrical conductivity changes in tissue level encapsulated those changes in cellular level. However, these limitations should not alter the main findings of this study greatly.
We conclude that IABP improves coronary perfusion as well as pressure unloading and volume unloading and also helps the failed ventricle to pump blood more efficiently.
ACKNOWLEDGMENTS
The authors have no conflicts of interest to disclose.
REFERENCES
1. Lin CY, Galysh FT, Ho KJ, Patel AS. Response to single-segment intraaor- tic balloon pumping as related to aortic compliance. Ann Thorac Surg 1972; 13: 468-76.
2. Clark JW Jr, Kane GR, Bourland HM. On the feasibility of closed-loop control of intra-aortic balloon pumping. IEEE Trans Biomed Eng 1973;
20: 404-12.
3. Barnea O, Moore TW, Dubin SE, Jaron D. Cardiac energy considerations during intraaortic balloon pumping. IEEE Trans Biomed Eng 1990; 37:
170-81.
4. Suga H, Hisano R, Goto Y, Yamada O, Igarashi Y. Effect of positive ino- tropic agents on the relation between oxygen consumption and systolic pressure volume area in canine left ventricle. Circ Res 1983; 53: 306-18.
5. Lim KM, Kim IS, Choi SW, Min BG, Won YS, Kim HY, Shim EB. Compu-
tational analysis of the effect of the type of LVAD flow on coronary perfu- sion and ventricular afterload. J Physiol Sci 2009; 59: 307-16.
6. Lim KM, Constantino J, Gurev V, Zhu R, Shim EB, Trayanova NA. Com- parison of the effects of continuous and pulsatile left ventricular-assist devices on ventricular unloading using a cardiac electromechanics mod- el. J Physiol Sci 2012; 62: 11-9.
7. Rice JJ, Wang F, Bers DM, de Tombe PP. Approximate model of coopera- tive activation and crossbridge cycling in cardiac muscle using ordinary differential equations. Biophys J 2008; 95: 2368-90.
8. Gurev V, Lee T, Constantino J, Arevalo H, Trayanova NA. Models of car- diac electromechanics based on individual hearts imaging data: image- based electromechanical models of the heart. Biomech Model Mechano- biol 2011; 10: 295-306.
9. Fox JJ, McHarg JL, Gilmour RF Jr. Ionic mechanism of electrical alternans.
Am J Physiol Heart Circ Physiol 2002; 282: H516-30.
10. Helm RH, Byrne M, Helm PA, Daya SK, Osman NF, Tunin R, Halperin HR, Berger RD, Kass DA, Lardo AC. Three-dimensional mapping of op- timal left ventricular pacing site for cardiac resynchronization. Circula- tion 2007; 115: 953-61.
11. Wu Y, Bell SP, Trombitas K, Witt CC, Labeit S, LeWinter MM, Granzier H.
Changes in titin isoform expression in pacing-induced cardiac failure give rise to increased passive muscle stiffness. Circulation 2002; 106: 1384-9.
12. O’Rourke B, Kass DA, Tomaselli GF, Kaab S, Tunin R, Marban E. Mech- anisms of altered excitation-contraction coupling in canine tachycardia- induced heart failure, I: experimental studies. Circ Res 1999; 84: 562-70.
13. Dally S, Bredoux R, Corvazier E, Andersen JP, Clausen JD, Dode L, Fancha- ouy M, Gelebart P, Monceau V, Del Monte F, et al. Ca2+-ATPases in non- failing and failing heart: evidence for a novel cardiac sarco/endoplasmic reticulum Ca2+-ATPase 2 isoform (SERCA2c). Biochem J 2006; 395:
249-58.
14. Bassani JW, Bassani RA. SERCA upregulation: breaking the positive feed- back in heart failure? Cardiovasc Res 2005; 67: 581-2.
15. Muller-Ehmsen J, McDonough AA, Farley RA, Schwinger RH. Sodium pump isoform expression in heart failure: implication for treatment. Ba- sic Res Cardiol 2002; 97 Suppl 1: I25-30.
■
APPENDIX■
Contractile ATP consumption of myocardium
The contractile energy consumption of the myocardium was quantified by calculating the contractile ATP consump- tion in the myofilament model of Rice et al. (7). The contractile ATP consumption rate, E, per unit volume was calculat- ed as a function of the ATP-consuming cross-bridge detachment rate (gxbT) and the single overlap fraction of thick fila- ments (SOVFThick),
E = gxbT× SOVFThick (3)
where gxbT, which indicates the ATP-consuming detachment transition rate, and SOVFThick, which indicates the single- overlap fraction of the thick filament, were functions taken from the original myofilament model of Rice et al. (7).
Then, gxbT can be derived as:
gxbT= gxb× gxbmd × xbmodspecies× Qgxb
(
TmpC-3710)
(4)The term xbmodspecies scales all cross-bridge cycling rates to account for species-based differences (0.2 for canines).
The temperature dependence of gxbT (Qgxb) is set to a default Q10 value of 6.25. The term gxbT had strain dependence in the rate modifier gxbmd, defined as:
gxbmd =
exp
(
σp(
xo - xXBPostR)
2)
if xXBPostR < xo
xo
b
= exp
(
σn(
xo - xXBPostR)
2)
if xXBPostR ≥ xo(5) xo
gxb
where σp and σn set the effects of strain for positive and negative shortening velocities, respectively; xo is the distortion of the cross-bridge head; xXBPostR is the mean distortion of states XBPostR, which is the probability of the transition to the post-rotated force-generating status. The ATP-consuming detachment transition rate gxbT is proportional to gxbmd, which depends on the strain of the cross bridges, and in turn, this strain depends on the velocity of contraction. See Rice et al. (7) for details. Finally, we calculated the ATP consumption distribution by integrating the ATP consumption rate with time for 600 ms and the ATP consumption of the entire ventricle by spatially integrating the local ATP consump- tion through the entire ventricular volume.