Breakfast-Based Dietary Patterns and Obesity in Tehranian Adults
Zahra Akbarzade1, Saba Mohammadpour1, Kurosh Djafarian2, Cain C. T. Clark3, Parivash Ghorbaninejad1, Maryam Mohtashami1, Sakineh Shab-Bidar1,*
Departments of 1Community Nutrition and 2Clinical Nutrition, School of Nutritional Sciences and Dietetics, Tehran University of Medical Sciences, Tehran, Iran;
3Centre for Sport, Exercise and Life Sciences, Coventry University, Coventry, UK
Background: Breakfast is an important meal of the day that contributes to an overall healthy dietary pattern, better nutrient intake, and diet quality. This study sought to investigate the relationship between breakfast pat- terns and general and central obesity among middle-aged adults.
Methods: In this cross-sectional study of 840 apparently healthy women and men, aged 20–59 years, we as- sessed usual dietary intake by means of three 24-hour dietary recalls and we took anthropometric measure- ments. Dietary patterns were subsequently identified by factor analysis. To assess the association between breakfast composition and central and general obesity, logistic regression analysis was performed.
Results: We identified three major dietary patterns by factor analysis: the “bread and grains, meat products, and coffee” dietary pattern, the “sweets, tea and coffee” dietary pattern, and the “fruits, vegetables, and eggs” dietary pattern. Those people in the third tertile of the “sweets, tea and coffee” dietary category had a greater chance of having central obesity (odds ratio, 1.80; 95% confidence interval, 1.25–2.59; P=0.001). Moreover, higher adher- ence to the “bread and grains, meat products, and coffee” pattern increased the chance of central obesity (odds ratio, 1.67; 95% confidence interval, 1.47–1.97; P=0.03).
Conclusion: Overall, our results suggest that specific breakfast dietary patterns are associated with increased odds of central obesity in Iranian adults.
Key words: Dietary patterns, Breakfast, Adults, Cross-sectional study, General obesity, Central obesity
Received April 29, 2020 Reviewed June 23, 2020 Accepted July 20, 2020
* Corresponding author Sakineh Shab-Bidar
https://orcid.org/0000-0002-0167-7174 Department of Community Nutrition, School of Nutritional Sciences and Dietetics, Tehran University of Medical Sciences, No 44, Hojjat-dost Alley, Naderi St., Keshavarz Blvd, Tehran, Iran Tel: +98-91-11376516
Fax: +98-21-88974462 E-mail: [email protected]
INTRODUCTION
Obesity is a serious community health problem worldwide and is the most prevalent metabolic disorder in both developed and de- veloping countries.
1Moreover, obesity and overweight are preva- lent in more than fifty percent of Iranian adults.
2Type of obesity and fat distribution are important factors that are inextricably linked to the progression of chronic diseases.
3General obesity, as- sessed by body mass index (BMI), is a major risk factor for several chronic diseases, including diabetes, cardiovascular disease, cancer, and a variety of disabling and life-threatening chronic conditions.
4Although general obesity is a good predictor of life threatening dis- eases,
4central obesity is also considered an independent predictor of cardio-metabolic diseases, cardiovascular risk factors, certain cancers, and morbidity and mortality.
5,6Both environmental and genetic factors are responsible for the high prevalence of obesity. Among environmental factors, low lev- els of physical activity, excess sedentary behavior, and increased en- ergy intake are key contributors to the obesity epidemic. Because of the complexity of the human diet and interactions between foods and nutrients, assessing overall diet and its relationship with chronic disease is important. Dietary patterns consider dietary
Copyright © 2020 Korean Society for the Study of Obesity
This is an Open Access article distributed under the terms of the Creative Commons Attribution Non-Commercial License (https://creativecommons.org/licenses/by-nc/4.0/) which permits unrestricted non-commercial use, distribution, and reproduction in any medium, provided the original work is properly cited.
eISSN 2508-7576
2017-03-16 https://crossmark-cdn.crossref.org/widget/v2.0/logos/CROSSMARK_Color_square.svg
Original Article
Breakfast-Based Dietary Patterns and Obesity in Tehranian Adults
Zahra Akbarzade1, Saba Mohammadpour1, Kurosh Djafarian2, Cain C. T. Clark3, Parivash Ghorbaninejad1, Maryam Mohtashami1, Sakineh Shab-Bidar1,*
Departments of 1Community Nutrition and 2Clinical Nutrition, School of Nutritional Sciences and Dietetics, Tehran University of Medical Sciences, Tehran, Iran;
3Centre for Sport, Exercise and Life Sciences, Coventry University, Coventry, UK
Background: Breakfast is an important meal of the day that contributes to an overall healthy dietary pattern, better nutrient intake, and diet quality. This study sought to investigate the relationship between breakfast pat- terns and general and central obesity among middle-aged adults.
Methods: In this cross-sectional study of 840 apparently healthy women and men, aged 20–59 years, we as- sessed usual dietary intake by means of three 24-hour dietary recalls and we took anthropometric measure- ments. Dietary patterns were subsequently identified by factor analysis. To assess the association between breakfast composition and central and general obesity, logistic regression analysis was performed.
Results: We identified three major dietary patterns by factor analysis: the “bread and grains, meat products, and coffee” dietary pattern, the “sweets, tea and coffee” dietary pattern, and the “fruits, vegetables, and eggs” dietary pattern. Those people in the third tertile of the “sweets, tea and coffee” dietary category had a greater chance of having central obesity (odds ratio, 1.80; 95% confidence interval, 1.25–2.59; P=0.001). Moreover, higher adher- ence to the “bread and grains, meat products, and coffee” pattern increased the chance of central obesity (odds ratio, 1.67; 95% confidence interval, 1.47–1.97; P=0.03).
Conclusion: Overall, our results suggest that specific breakfast dietary patterns are associated with increased odds of central obesity in Iranian adults.
Key words: Dietary patterns, Breakfast, Adults, Cross-sectional study, General obesity, Central obesity
Received April 29, 2020 Reviewed June 23, 2020 Accepted July 20, 2020
* Corresponding author Sakineh Shab-Bidar
https://orcid.org/0000-0002-0167-7174 Department of Community Nutrition, School of Nutritional Sciences and Dietetics, Tehran University of Medical Sciences, No 44, Hojjat-dost Alley, Naderi St., Keshavarz Blvd, Tehran, Iran Tel: +98-91-11376516
Fax: +98-21-88974462 E-mail: [email protected]
complexity and the long-term effects of diet on the risk of disease development, so can better predict diet-disease associations, as compared to the assessment of single nutrients.
7Moreover, foods are consumed as meals and snacks, and thus investigation of diet quality across meals is a pragmatic approach to help elucidate im- portant diet–disease relationships.
Breakfast as the first meal of the day contributes to an overall healthy dietary pattern, better nutrient intake, and diet quality.
8The effects of breakfast on obesity are controversial. There is an abun- dance of evidence to suggest that breakfast consumption is associ- ated with overweight and obesity.
9,10However, Chatelan et al.
9re- ported that participants who ate fruit, natural cereal flakes, nuts/
seeds, and yogurt for breakfast had a lower risk of abdominal obesi- ty because of good dietary choices the rest of the day. In two stud- ies involving Iranian and African-American students, respectively, skipping breakfast was associated with overweight and obesity;
11,12moreover, some studies have shown that in breakfast skippers, free fatty acids increase throughout the morning hours, resulting in de- creased insulin sensitivity later in the day.
13,14A recent meta-analysis suggested that consumption of breakfast is not an effective weight loss strategy,
15whilst in another study of Korean adults, a Western breakfast pattern that included eggs, Western grains, and processed meat was associated with an increased risk of metabolic syndrome, of which abdominal obesity is a key component, compared to a fruit, nuts, and vegetables breakfast pattern.
16In previous studies, dietary patterns have been identified based on average daily intake, because food is consumed at different times in different meals. In the other words, the focus of nutritional epi- demiology has been on individual nutrients with a more recent shift in focus to dietary patterns. However, little data exist on the quality of diet and dietary intake at the level of a “meal.” Identifying meal-based dietary patterns may help the public to achieve the rec- ommended daily intake of foods and nutrients and adhere to di- etary guidelines, and may also enable the identification of diet-dis- ease associations. Previous literature that has investigated meal pat- terns has predominantly been conducted in Western countries.
Given the dearth of studies originating from Middle Eastern coun- tries, we sought to investigate the relationship between breakfast patterns and general and central obesity in an Iranian population.
METHODS Study population and design
This study was a cross-sectional, population-based survey of 850 adults aged 20–59 years living in Tehran. Ten participants were ex- cluded for various reasons, resulting in a total of 840 participants in the final analysis. Sampling was done by dividing the health centers of Tehran into five regions: north, south, east, west, and center;
then randomly recruiting a proportional amount of participants from the five regions. Study criteria included an age between 20 and 59 years, desire to participate in the survey, self-certified to be healthy, residents of Tehran, and members of a health center. Sam- ple collection was facilitated by coordination between the Health Bureau of the Municipality of Tehran and the cooperation of the health centers of Tehran. All participants were educated about the purpose of the study, and all procedures were conducted in accor- dance with the ethical standards of the Tehran University of Medi- cal Sciences (No. IR.TUMS.VCR.REC.1397.157), which approved the protocol and informed consent form. All participants provided written informed consent prior to the start of the study.
Dietary assessment
Dietary intake was assessed using three 24-hour dietary recalls (24hDRs). All 24hDRs were collected by trained interviewers. The first recall was face-to-face during the participants’ first visit at health centers. The other two 24hDRs were obtained on random days by phone interview. Portion sizes of consumed foods were converted to grams using household measures.
17Additionally, we used Nutri- tionist IV software (First Databank, San Bruno, CA, USA), modi- fied for Iranian foods, to obtain the energy and nutrient values of food items.
Breakfast definition
Breakfast was defined as a meal eaten between 05:00 and 11:00.
18Food group intake
Dietitians independently classified foods and beverages into 24
groups of interest according to nutritional values, Iranian consump-
tion habits, literary data, and previous experience of the research
team. We then categorized food items into 14 food groups.
Definition of breakfast composition
We obtained dietary patterns using principal component analysis (PCA; in particular, factor analysis) based on the usual intake for the 12 food groups. Food group intakes were energy-adjusted by the residual method.
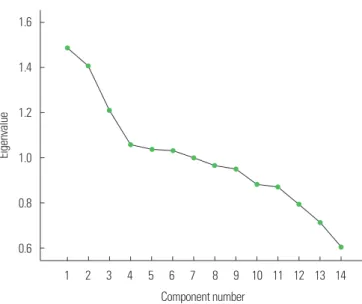
19An orthogonal rotation method (Varimax rotation) was applied to simplify the factor structure and present it in an explainable manner. Food groups with a loading factor above an absolute value of 0.2 were considered to be important contribu- tors to the dietary pattern. We retained three factors as shown in the scree plot shown in Fig. 1. We labeled dietary patterns based on food groups positively and negatively correlated with the identified patterns and based on prior literature. Then, scores for breakfast patterns were calculated as the sum of the products of the factor loading coefficients and intake of food groups weighted by their factor loadings.
20Each participant received a factor score for each identified pattern, and was categorized based on tertiles of major dietary pattern scores.
Outcome assessment
Weight and height were measured according to standardized methods.
21Weight was recorded to the nearest 100 g, while mini- mally clothed and unshod, using digital scales. Height was measured in a standing position, unshod, using a tape stadiometer to the near- est 1 mm while the shoulders were in a normal position. Waist cir- cumference (WC) was recorded to the nearest 0.1 cm at the um-
bilical level, and hip circumference at the maximal level over light clothing, using a non-stretch tape measure without putting pressure on the body surface.
We assessed central obesity based on waist to hip ratio (WHR
≥ 0.9 for men, ≥ 0.85 for women) and WC (i.e., obesity if WC
≥ 102 cm for men, WC ≥ 88 cm for women).
22BMI was calculated from height and weight data as kg/m
2. General obesity was defined as BMI ≥ 30 kg/m
2.
23Blood pressure was measured twice for each participant after a period of 15 minutes of quiet sitting.
24Covariates
Physical activity was assessed using the International short-form Physical Activity Questionnaire and from participants’ oral re- sponses to the international physical-activity questionnaire based on an interview, and subsequently expressed as metabolic equiva- lent hr/wk.
25We asked the participants to think about the vigorous and moderate activities that they had engaged in during the past 7 days and report the time they spent on these activities. Additional covariate information regarding age (year), education level (illiterate, under-diploma, diploma, educated), marital status (married or oth- er), occupation (employee or unemployed), medical condition (healthy or underlying disease), smoking status (never smoker, for- mer smoker, current smoker), and life-style (living alone, with some- one) was obtained using questionnaires. Furthermore, we defined underlying diseases in this study as diabetes, hypertension, dyslip- idemia, cardiovascular disease, cancer, and respiratory disease.
Statistical analysis
We used one-way analysis of variance for quantitative variables and chi-square tests for qualitative variables to determine the sig- nificance of differences across tertiles in breakfast patterns. To as- sess the association between breakfast composition and central and general obesity, respectively, we performed multiple logistic regres- sion analyses. Analyses were adjusted for age (years), sex (male or female), life-style, marriage, physical activity level, smoking status (never smoke or former/current smoker), and total energy intake..
Data were analyzed using the statistical software package IBM SPSS version 22 (IBM Corp., Armonk, NY, USA) and statistical significance was accepted, a priori, at P<0.05.
Figure 1. Scree plot for identification of dietary patterns by principal component analysis.
1.6
1.4
1.2
1.0
0.8
0.6
Eigenvalue
1 2 3 4 5 6 7 8 9 10 11 12 13 14 Component number
RESULTS
In this study, of the 850 participants, 10 were excluded due to a lack of information and/or failure to complete their dietary recall report, thus 840 participants were included in the final analysis.
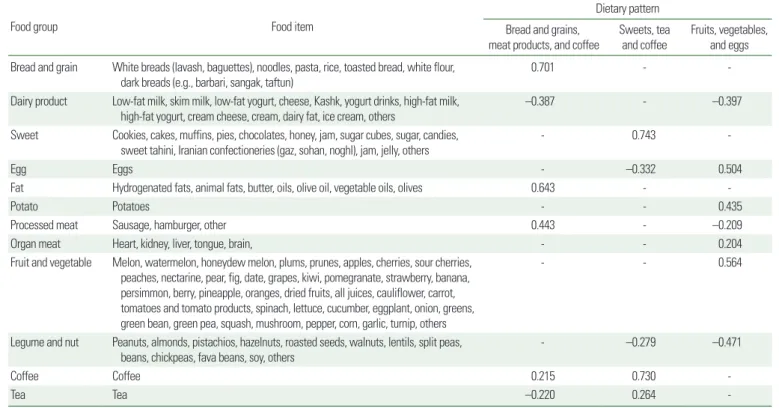
The average daily total energy intake in the present study was 1,701.10; furthermore, 29% of the total energy intake was from breakfast. Factor loadings of food groups, the percentage of the dis- tribution justified by each dietary pattern, and the identified dietary patterns are presented in Table 1 and Fig. 1. The first dietary pat- tern, named “bread and grains, meat products, and coffee,” was rich in bread and grains, meat products (sausages and burgers), fats, and coffee. The second dietary pattern, “sweets, tea and coffee,” includ- ed high consumption of sweets, desserts, tea and coffee. The third dietary pattern, “fruits, vegetables, and eggs” had higher amount of fruits and vegetables, potatoes, and eggs than the other two dietary patterns. These three dietary patterns explained 36.99% of the total variance of the studied population.
Correlation analysis revealed strong positive correlations between fat, bread, and grains (P≤0.001) and between tea and sweets
(P≤0.001); in contrast, we found strong negative correlations be- tween egg and sweet consumption (P≤0.001) and between fat and dairy product consumption (P≤0.001) (Fig. 2).
Table 1. Food groups used in the factor analysis and factor loadings for each of the identified breakfast patterns*
Food group Food item
Dietary pattern Bread and grains,
meat products, and coffee
Sweets, tea and coffee
Fruits, vegetables, and eggs Bread and grain White breads (lavash, baguettes), noodles, pasta, rice, toasted bread, white flour,
dark breads (e.g., barbari, sangak, taftun) 0.701 - -
Dairy product Low-fat milk, skim milk, low-fat yogurt, cheese, Kashk, yogurt drinks, high-fat milk,
high-fat yogurt, cream cheese, cream, dairy fat, ice cream, others –0.387 - –0.397
Sweet Cookies, cakes, muffins, pies, chocolates, honey, jam, sugar cubes, sugar, candies,
sweet tahini, Iranian confectioneries (gaz, sohan, noghl), jam, jelly, others - 0.743 -
Egg Eggs - –0.332 0.504
Fat Hydrogenated fats, animal fats, butter, oils, olive oil, vegetable oils, olives 0.643 - -
Potato Potatoes - - 0.435
Processed meat Sausage, hamburger, other 0.443 - –0.209
Organ meat Heart, kidney, liver, tongue, brain, - - 0.204
Fruit and vegetable Melon, watermelon, honeydew melon, plums, prunes, apples, cherries, sour cherries, peaches, nectarine, pear, fig, date, grapes, kiwi, pomegranate, strawberry, banana, persimmon, berry, pineapple, oranges, dried fruits, all juices, cauliflower, carrot, tomatoes and tomato products, spinach, lettuce, cucumber, eggplant, onion, greens, green bean, green pea, squash, mushroom, pepper, corn, garlic, turnip, others
- - 0.564
Legume and nut Peanuts, almonds, pistachios, hazelnuts, roasted seeds, walnuts, lentils, split peas, beans, chickpeas, fava beans, soy, others
- –0.279 –0.471
Coffee Coffee 0.215 0.730 -
Tea Tea –0.220 0.264 -
*Factor loadings of < 0.2 were removed to simplify the table.
Bread and grains Dairy products Sweets Egg Fat Potato Processed meat Organ meats Fruits and vegetables Legumes and nut Tea
Coffee
Bread and grains Dairy products Sweets Egg Fat Potato Processed meat Organ meats Fruits and vegetables Legumes and nut Tea Coffee
1
0
–1
Spearman correlation
Figure 2. Heat map showing the Spearman correlation matrix for breakfast food intake in grams (n= 840) by food group. The color corresponds to the strength of correlations (red, positive correlation; white, no correlation; blue, negative correla- tion).
Table 2. Characteristics of the study participants across tertiles of breakfast pattern scores CharacteristicsBread and grains, meat product, and coffeeSweets, tea and coffeeFruits, vegetables and eggs T1T2T3P*T1T2T3P*T1T2T3P* No. of participants278282282278282282278282282 Sex0.440.870.41 Male 58 (35.4) 48 (29.1)58 (35.4) 53 (32.3) 58 (35.4) 53 (32.3) 57 (34.8) 48 (29.3)59 (36) Female220 (32.4)234 (34.5)224 (33)222 (32.7)226 (33.3)230 (33.9)221 (32.6)235 (34.7) 222 (32.7) Activity score0.480.620.50 Low159 (35.9)137 (30.9)147 (33.2)147 (33.2)151 (34.1)145 (32.7) 138 (31.2)161 (36.3)144 (32.5) Moderate 94 (29.4)115 (35.9)111 (34.7)104 (32.5)106 (33.1)104 (32.5)112 (35)100 (30.3)108 (33.8) High 25 (32.9) 28 (36.8) 23 (30.3) 23 (30.3) 27 (35.5) 26 (34.2) 27 (35.5) 20 (26.3) 29 (38.2) Education0.0090.850.87 Educated 95 (31.9)110 (36.9) 93 (31.2)96 (32.2)97 (32.7)105 (35.2) 98 (32.9)102 (34.2)98 (32.9) Occupation0.230.550.29 Employee104 (33.4)113 (36.3) 94 (30.2)103 (33.1)102 (32.8)106 (34.1)113 (36.3) 99 (31.8)99 (31.8) Marriage0.630.650.92 Married220 (32.4)226 (33.3)232 (34.2)217 (32)229 (33.8)232 (34.2)226 (33.3)227 (33.5)225 (33.2) Life-style0.170.110.63 Living alone 22 (46.8) 10 (21.3)15 (31.9)18 (38.3)8 (17)21 (44.7)14 (29.8)17 (36.2)16 (34) Smoking 0.520.470.75 Never 261 (32.7)268 (33.5)270 (33.8)261 (32.7)273 (34.2)265 (32.2)264 (33)272 (34)263 (32.9) Former 7 (46.7)6 (40) 2 (13.3) 3 (20) 5 (33.3) 7 (46.7) 5 (33.3) 4 (26.7)6 (40) Current 10 (35.7) 8 (28.6) 10 (35.7) 11 (39.3) 6 (21.4) 11 (39.3) 9 (32.1) 7 (25)12 (42.9) Medical condition‡0.220.450.69 Underlying disease124 (35.2)106 (30.1)122 (34.7)113 (32.1)113 (32.1)126 (35.8)111 (31.5)122 (34.7)119 (33.8) Obesity 73 (33.8) 68 (31.5) 75 (34.7)0.73 69 (31.9) 75 (34.7) 72 (33.3)0.93 64 (29.6)71 (32.9)81 (37.5)0.25 Age (yr)43.74±10.740.8±11.442.3±10.60.1242.4±11.642.3±10.342.1±10.90.7742.7±10.441.6±11.242.5±11.20.91 Weight (kg)72.26±14.0571.31±13.9272.76±13.760.6771.50±14.7473.24±13.3071.57±13.650.9571.75±13.6171.76±13.5372.82±14.580.36 Systolic blood pressure (mmHg)118±20.9116.2±19.1115±20.70.07117.4±19.3116.4±20.7115±20.70.27116.5±18.2 115±21.5117.7±20.90.47 Diastolic blood pressure (mmHg)78.2±15.279.1±11.477.3±12.90.4078.4±12.979.04±14.677.2±12.10.2878.01±11.0777.3±15.479.3±12.90.22 Dietary and nutrient intake§P †P †P † Fruit (g)75.87±53.771.55±58.7872.72±53.670.1369.43±54.8678.43±58.9072.12±52.030.1639.60±40.2872.77±43.76107.4±58.26<0.001 Vegetable (g)25.06±34.4321.01±29.3720.62±28.830.1225.19±32.5422.36±31.9919.19±28.120.0611.09±20.8522.27±30.3233.17±35.86<0.001 Dairy (g)35.60±28.5919.04±19.1414.47±15.86<0.00125.18±24.5523.15±24.1420.67±21.980.0235.72±27.2420.83±20.4112.53±15.69<0.001 Grain (g)38.25±18.1056.05±20.2684.67±32.87<0.00157.82±32.3059.30±31.9562.11±29.160.5058.86±31.7758.56±29.7961.85±31.930.43 Carbohydrate (g)64.82±23.6968.83±23.7973.36±25.530.1964.57±24.2168.40±24.7673.97±23.930. 0169.21±25.1966.22±22.5771.65±25.660.39 Protein (g)12.39±5.1712.66±6.5813.46±4.980.80 13±7.0812.75±5.2212.77±4.720.1913.13±4.9312.26±4.7513.13±7.200.41 Fat (g)12.41±5.3414.50±23.2914.07±7.550.3713.09±8.6213.42±7.5814.48±22.300.7714.75±22.7712.58±7.0313.69±8.190.27 Total energy intake (kcal/day)387.7±163.1430.1±148.7498.5±152.60.15478.2±162.1441.6±160.6396.5±151.10.10442.5±176.1409.3±123.1464.6±174.80.22 Values are presented as number (%) or mean±standard deviations. P-values were obtained using the chi-square test. *P-values were obtained using the chi-square test; †P-values were obtained using analysis of covariance; ‡Underlying diseases included diabetes, hypertension, dyslipidemia, cardiovascular disease, cancer, and respiratory dis- ease; §Adjusted for age, sex, and total energy intake. T, tertile.
Table 2 shows the general characteristics, anthropometric char- acteristics, and dietary intake of participants for the three breakfast dietary patterns. Education level differed across tertiles of the di- etary pattern “bread and grains, meat products, and coffee” (P=
0.009); participants with higher education showed greater adher- ence to this dietary pattern. Analysis of covariance after controlling for age, sex, and total energy intake showed that mean intake of dairy products decreased while intake of grains increased with greater adherence to the “bread and grains, meat products, and cof- fee” dietary pattern. People in the highest tertile of the “sweets, tea and coffee” dietary pattern showed lower intake of dairy products and higher intake of carbohydrates. In addition, higher intake of fruit, vegetables, and lower intake of dairy products was observed in people with greater adherence to the “fruits, vegetables, and eggs”
dietary pattern. There were no differences in the means of other variables across the three major dietary patterns.
Multivariable-adjusted means for anthropometric measures and indices across tertiles of breakfast patterns are presented in Supple- mentary Table 1. Higher adherence to the dietary pattern of “bread and grains, meat products, and coffee” was associated with a higher WHR (P=0.03). However, there was no significant relationship after controlling for confounding factors. The other dietary patterns did not show any significant relationships with any of these vari- ables.
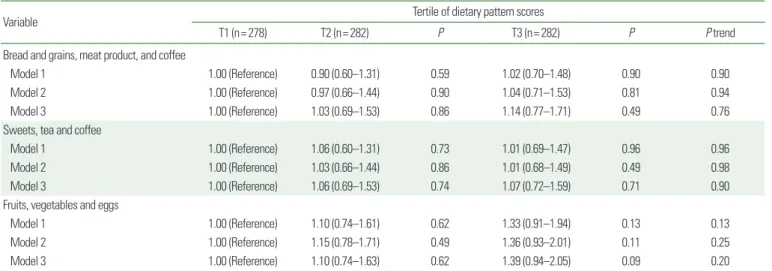
Unadjusted and adjusted odds ratios for general obesity among tertiles of dietary patterns are presented in Table 3. There was no significant relationship between general obesity and any of the di- etary patterns in the unadjusted model, and this remained true after adjusting for confounding factors.
Table 4 shows the unadjusted and adjusted odds ratios for cen- tral obesity among dietary pattern score tertiles. Adherence to the dietary pattern of “sweets, tea and coffee” yielded a 1.8-fold (P=
0.001) greater chance of a greater WC. However, the chance of central obesity in the two other dietary patterns showed no signifi- cant difference across tertiles of dietary patterns in the unadjusted and adjusted models. The chance of developing central obesity, de- fined as a WHR ≥ 0.90 for men and ≥ 0.85 for women showed that those who were in the highest tertile of the dietary pattern of
“bread and grains, meat products, and coffee” compared to those in the first tertile had a lower chance of central obesity (WHR ≥ 0.90 for men and ≥ 0.85 for women; odds ratio, 0.66; 95% confidence interval, 0.47–0.92). However, after adjusting for confounding fac- tors, the chance of central obesity increased by 1.67-fold (P=0.03) when defined based on WHR ( ≥ 0.90 for men and ≥ 0.85 for women). Finally, we found no significant relationship between ad- herence to any other dietary pattern and the chance of central obe- sity in the crude or adjusted models.
Table 3. Odds ratios and 95% confidence intervals for general obesity (BMI ≥ 30 kg/m2) across tertiles of dietary pattern scores
Variable Tertile of dietary pattern scores
T1 (n= 278) T2 (n= 282) P T3 (n= 282) P P trend
Bread and grains, meat product, and coffee
Model 1 1.00 (Reference) 0.90 (0.60–1.31) 0.59 1.02 (0.70–1.48) 0.90 0.90
Model 2 1.00 (Reference) 0.97 (0.66–1.44) 0.90 1.04 (0.71–1.53) 0.81 0.94
Model 3 1.00 (Reference) 1.03 (0.69–1.53) 0.86 1.14 (0.77–1.71) 0.49 0.76
Sweets, tea and coffee
Model 1 1.00 (Reference) 1.06 (0.60–1.31) 0.73 1.01 (0.69–1.47) 0.96 0.96
Model 2 1.00 (Reference) 1.03 (0.66–1.44) 0.86 1.01 (0.68–1.49) 0.49 0.98
Model 3 1.00 (Reference) 1.06 (0.69–1.53) 0.74 1.07 (0.72–1.59) 0.71 0.90
Fruits, vegetables and eggs
Model 1 1.00 (Reference) 1.10 (0.74–1.61) 0.62 1.33 (0.91–1.94) 0.13 0.13
Model 2 1.00 (Reference) 1.15 (0.78–1.71) 0.49 1.36 (0.93–2.01) 0.11 0.25
Model 3 1.00 (Reference) 1.10 (0.74–1.63) 0.62 1.39 (0.94–2.05) 0.09 0.20
Values are presented as odds ratio (95% confidence interval). Odds ratios and confidence intervals were obtained using binary logistic regression. Model 1, unadjusted; Model 2, age, sex, education (categorical), marriage, life-style, smoking; Model 3, Model 2+physical activity and total energy intake.
BMI, body mass index; T, tertile.
DISCUSSION
In the present study, we identified three major dietary patterns by factor analysis: the “bread and grains, meat products, and coffee”
dietary pattern, the “sweets, tea and coffee” dietary pattern, and the
“fruits, vegetables, and eggs” dietary pattern. According to our re- sults, greater adherence to the dietary pattern of “sweets, tea and coffee” was associated with increased WC. In addition, a significant relationship was found between the dietary pattern of “bread and grains, meat products, and coffee” and WHR even though no sig- nificant relationship was observed between general obesity and breakfast dietary patterns.
Breakfast is traditionally considered not only the first meal, but also the most important meal of the day.
26Previous studies have re-
ported that eating breakfast regularly leads to better diet quality,
27with reduced risk of obesity as well as cardio-metabolic diseases.
28van der Heijden et al.
29showed that eating breakfast has a role in preventing weight gain while other studies have highlighted how not eating breakfast is associated with an increased risk of over- weight and obesity,
30type 2 diabetes,
31and cardiovascular diseas- es.
32Therefore, eating a healthy breakfast has empirical, positive health consequences.
33In this study, we evaluated diet quality of breakfast in terms of di- etary patterns. Knowledge of dietary patterns, which take into con- sideration different aspects of dietary behaviors, can provide more accurate data for evaluating the relationship between diet and health state compared to the study of nutrients or foods in isolation.
34Identifying dietary patterns is also considered the best approach to
Table 4. Odds ratios and 95% confidence intervals for central obesity across tertiles of dietary pattern scoresVariable Tertile of dietary pattern scores
T1 (n= 278) T2 (n= 282) P T3 (n= 282) P P trend
Waist circumference (cm) > 102 cm for men and > 88 cm for women Bread and grains, meat product, and coffee
Model 1 1.00 (Reference) 0.80 (0.57–1.11) 0.19 0.90 (0.65–1.26) 0.55 0.55
Model 2 1.00 (Reference) 0.86 (0.60–1.23) 0.42 0.93 (0.65–1.33) 0.71 0.74
Model 3 1.00 (Reference) 0.87 (0.61–1.25) 0.47 0.96 (0.67–1.40) 0.86 0.78
Sweets, tea and coffee
Model 1 1.00 (Reference) 1.22 (0.87–1.71) 0.23 1.66 (1.19–2.32) 0.003 0.23
Model 2 1.00 (Reference) 1.26 (0.88–1.81) 0.19 1.78 (1.24–2.55) 0.002 0.006
Model 3 1.00 (Reference) 1.30 (0.90–1.88) 0.15 1.80 (1.61–2.59) 0.001 0.005
Fruits, vegetables, and egg
Model 1 1.00 (Reference) 0.86 (0.61–1.20) 0.37 1.04 (0.75–1.45) 0.80 0.80
Model 2 1.00 (Reference) 0.87 (0.61–1.24) 0.46 1.10 (0.77–1.57) 0.59 0.40
Model 3 1.00 (Reference) 0.86 (0.60–1.23) 0.42 1.11 (0.77–1.58) 0.56 0.35
Waist to hip ratio > 0.90 for males and > 0.85 for females Bread and grains, meat product, and coffee
Model 1 1.00 (Reference) 0.66 (0.47–0.92) 0.01 1.68 (1.49–1.96) 0.02 0.02
Model 2 1.00 (Reference) 0.74 (0.52–1.05) 0.10 1.69 (1.49–1.98) 0.04 0.10
Model 3 1.00 (Reference) 0.73 (0.51–1.04) 0.08 1.67 (1.47–1.97) 0.03 0.08
Sweets, tea and coffee
Model 1 1.00 (Reference) 1.17 (0.84–1.63) 0.33 1.18 (0.85–1.65) 0.31 0.31
Model 2 1.00 (Reference) 1.16 (0.82–1.63) 0.39 1.21 (0.85–1.71) 0.27 0.52
Model 3 1.00 (Reference) 1.16 (0.82–1.64) 0.39 1.22 (0.85–1.73) 0.26 0.51
Fruits, vegetables, and eggs
Model 1 1.00 (Reference) 0.85 (0.61–1.18) 0.33 1.02 (0.73–1.43) 0.86 0.86
Model 2 1.00 (Reference) 0.91 (0.65–1.29) 0.62 1.04 (0.74–1.47) 0.79 0.73
Model 3 1.00 (Reference) 0.92 (0.65–1.30) 0.65 1.05 (0.74–1.48) 0.77 0.75
Values are presented as odds ratio (95% confidence interval). Odds ratios and confidence intervals were obtained using binary logistic regression. Model 1, unadjusted; Model 2, age, sex, education (categorical), marriage, life-style, smoking; Model 3, Model 2+physical activity and total energy intake.
T, tertile.