Effect of Heart Rate and Body Mass
Index on the Interscan and Interobserver Variability of Coronary Artery Calcium Scoring at Prospective ECG-Triggered 64-Slice CT
Objective: To test the effects of heart rate, body mass index (BMI) and noise level on interscan and interobserver variability of coronary artery calcium (CAC) scoring on a prospective electrocardiogram (ECG)-triggered 64-slice CT.
Materials and Methods: One hundred and ten patients (76 patients with CAC) were scanned twice on prospective ECG-triggered scans. The scan parameters included 120 kV, 82 mAs, a 2.5 mm thickness, and an acquisition center at 45%
of the RR interval. The interscan and interobserver variability on the CAC scores (Agatston, volume, and mass) was calculated. The factors affecting the variability were determined by plotting it against heart rate, BMI, and noise level (defined as the standard deviation: SD).
Results: The estimated effective dose was 1.5 ±0.2 mSv. The mean heart rate was 63 ±12 bpm (range, 44-101 bpm). The patient BMIs were 24.5 ±4.5 kg/m2 (range, 15.5-42.3 kg/m2). The mean and median interscan variabilities were 11%
and 6%, respectively by volume, and 11% and 6%, respectively, by mass.
Moreover, the mean and median of the algorithms were lower than the Agatston algorithm (16% and 9%, respectively). The mean and median interobserver vari- ability was 10% and 4%, respectively (average of algorithms). The mean noise lev- els were 15 ±4 Hounsfield unit (HU) (range, 8-25 HU). The interscan and inter- observer variability was not correlated with heart rate, BMI, or noise level.
Conclusion: The interscan and interobserver variability of CAC on a prospec- tive ECG-triggered 64-slice CT with high image quality and 45% of RR acquisition is not significantly affected by heart rate, BMI, or noise level. The volume or mass algorithms show reduced interscan variability compared to the Agatston scoring (p < 0.05).
he measurement of coronary artery calcium (CAC) can improve risk prediction in conventional intermediate-risk patients, and should be considered in individuals with an intermediate risk of experiencing a coronary event (1.0% to 2.0% annual rate of coronary heart disease death or myocar- dial infarction) for clinical decision-making with regard to refinement of risk assess- ment (1). Monitoring CAC is suggested to assess the progression and regression of coronary atherosclerosis, thereby documenting risk factors and lipid-lowering pharma- cologic therapy (2). In this regard, the two major key requirements for the examina- tion are low interscan variability and low radiation exposure.
Many factors are suggested to influence interscan variability in CAC, including the scoring method, motion artifact, signal-to-noise ratio, partial volume effects, triggering Jun Horiguchi, MD1
Noriaki Matsuura, MD2 Hideya Yamamoto, MD3 Masao Kiguchi, RT1 Chikako Fujioka, RT1 Toshiro Kitagawa, MD3 Katsuhide Ito, MD2
Index terms : Coronary artery Calcium
Computed tomography (CT) Heart rate
Body mass index
DOI:10.3348/kjr.2009.10.4.340
Korean J Radiol 2009;10:340-346 Received December 1, 2008; accepted after revision February 19, 2009.
1Department of Clinical Radiology, Hiroshima University Hospital, Hiroshima, 734-8551, Japan; 2Department of Radiology, Division of Medical Intelligence and Informatics, Programs for Applied Biomedicine, Graduate School of Biomedical Sciences, Hiroshima University, Hiroshima, 734-8551, Japan;
3Department of Molecular and Internal Medicine, Division of Clinical Medical Science, Programs for Applied Biomedicine, Graduate School of Biomedical Sciences, Hiroshima University, Hiroshima, 734-8551, Japan
Address reprint requests to :
Jun Horiguchi, MD, Department of Clinical Radiology, Hiroshima University Hospital, 1-2-3, Kasumi-cho, Minami-ku, Hiroshima, 734-8551, Japan.
Tel. 81 82 2575257 Fax. 81 82 2575259
e-mail: [email protected]
T
errors, point of image acquisition, varying analysis tools (3), as well as the total amount of CAC (4). Motion artifacts are deeply associated with the temporal resolution of the CT scanner and movement of the coronary artery;
the latter tending to accelerate as heart rate increases. A high signal-to-noise ratio is important, i.e. low noise, because hyperattenuating noise may be misjudged as CAC.
This factor is considered to be linked with the patient’s body mass index (BMI). The purpose of this prospective study was to assess the effect of heart rate, BMI and image noise as a function of interscan and interobserver variabil- ity of CAC scoring on a prospective electrocardiogram (ECG)-triggered 64-slice CT. Also in addition, we investi- gated the effect of the CAC scoring algorithm.
MATERIALS AND METHODS
Patient
This study is a subgroup analysis of a previously published paper (5) investigating the CAC scoring of 1.25 mm and 2.5 mm thick images on a prospective ECG- triggered 64-slice CT. Our Institutional Review Board approved the study and written informed consent was received from all patients involved after the nature of the procedure had been fully explained (including radiation dose information). For nine months, 110 consecutive physician-referred patients (64 males and 36 females, 67
± 10 years old: range, 42-83 years) who were suspected of having coronary artery disease were included in this study. Two repeated sequential scans, with a rest period of around 1 minute in between, were performed using a 64- slice CT scanner (LightSpeed VCT; GE Healthcare, Waukesha, WI) with no change in subject positioning. The table was advanced by 1 mm during the repeated scans to mimic patient movement. The scans were performed 4 to 5 seconds after held their breath on inspiration in order to minimize the change in heart rate during the scan (6).
Prospective ECG-Triggered Sequential CT Protocol Each patient underwent a prospective ECG-triggered sequential half-scan and obtained 2.5-mm thick images so that the center of the temporal window corresponded to 45% of the RR interval. The scanning parameters had a gantry rotation speed of 0.35 sec/rotation, 120 kV, and 350 mA. The matrix size was 512×512 pixels and the display field of view was 26 cm. The medium reconstruc- tion kernel of “Std (standard)” was used and the temporal resolution was 175 msec.
Radiation Dose
The dose-length product (DLP) displayed on the Dose
Report of the CT scanner was recorded. A reasonable approximation of the effective dose (E) could be obtained using the following equation:
E = k×DLP
where E = Effective dose estimate and k = 0.017 mSv×
mGy-1×cm-1. This value is applicable to chest scans and is the average of the male and female models (7).
Calcium Scoring
The Agatston (8), as well as calcium volume and mass (9) were determined on a commercially available external workstation (Advantage Windows Version 4.2, GE Healthcare, Waukesha, WI) and CAC-scoring software (Smartscore Version 3.5) according to the following equations:
1. Agatston score = slice increment / slice thickness×
∑(area×cofactor)
2. Volume =∑(area×slice increment)
3. Mass =∑(area×slice increment×mean CT density)×
calibration factor (10)
All CT scans were independently scored by two radiolo- gists with seven and one year(s) of experience in measur- ing CAC, respectively.
The Interscan and Interobserver Variability For patients with positive CAC measurement on all scores, the interscan and interobserver variability was calculated by using the percent difference between the calcium scores:
1. Interscan variability = (absolute [scan1-scan2] / [scan1 + scan2]×0.5)×100
2. Interobserver variability = (absolute [observer 1- observer 2] / [observer 1 + observer 2]×0.5)×100 where observer 1 is the CAC score measured by observer 1.
Using a two-factor factorial analysis of variance (ANOVA), the interscan variability was compared
between the CAC scoring algorithms and observers as well as the interobserver variability between the CAC scoring algorithms and the scans.
Effect of Heart Rate, Body Mass Index and Noise Level on Interscan and Interobserver Variability
The image noise, expressed as the standard deviation (SD) of the CT values in the regions of interest set in the aorta at the level of the left coronary artery, was measured by observer 1 (Fig. 1). In order to determine the factors influencing the interscan and interobserver variability, targeting the patients with CAC, the variability was plotted against the heart rate, BMI and SD. To determine the relationship between SD and BMI and between SD and
body weight for all patients, the SD was plotted against the BMI and body weight, as described by Mahnken et al. (11).
Statistical Analyses
All statistical analyses were performed using a commer- cially available software package (Statcel2, oms-publishing, Saitama, Japan). The statistical analyses used included a two-factor ANOVA test and linear regression. When statis- tically significant results were observed by ANOVA, we conducted a post-hoc Scheffe、test for multiple pairwise comparisons. Statistical significance was set at p < 0.05.
RESULTS
All patients were able to hold their breath (around 13 sec) on the two scans. The patients’ body weight and BMI were 63 ± 12 kg (range, 34-96 kg) and 24.5 ± 4.5 kg/m2 (range, 15.5-42.3 kg/m2), while the patients’ mean heart rates were 63 ± 12 bpm (range, 44-101 bpm) on scan 1 and 62 ± 11 bpm (range, 36-100 bpm) on scan 2. The difference of mean heart rate between the two scans was 2
± 3 bpm. The DLPs displayed on the Dose Report on the CT scanner and the estimated effective doses were 90.2 ± 9.8 mGy×cm and 1.5 ± 0.2 mSv, respectively.
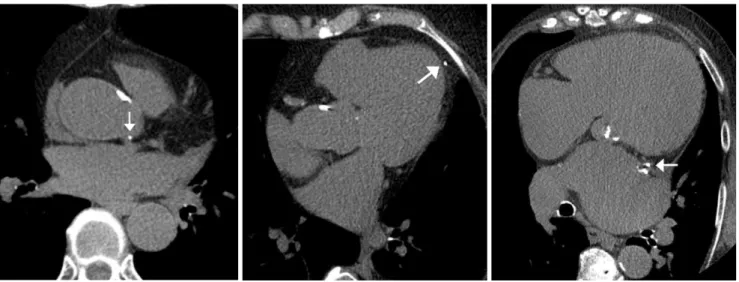
Seventy-six of the overall 110 patients had CAC deposits on the two scan images, whereas 34 patients had no CAC deposits on either scan. The calcium deposited over the aorta and left coronary artery, and calcium from the epicardium, mitral valve or left atrial wall mimicking the CAC were interpreted differently (Fig. 2). The propor- tion of patients with higher heart rates (> 65 bpm) was 32% (24 of 76 patients) and with high BMI (> 25) was 34% (26 of 76 patients). The Agatston, volume, and mass scores on the two observers are summarized in Table 1.
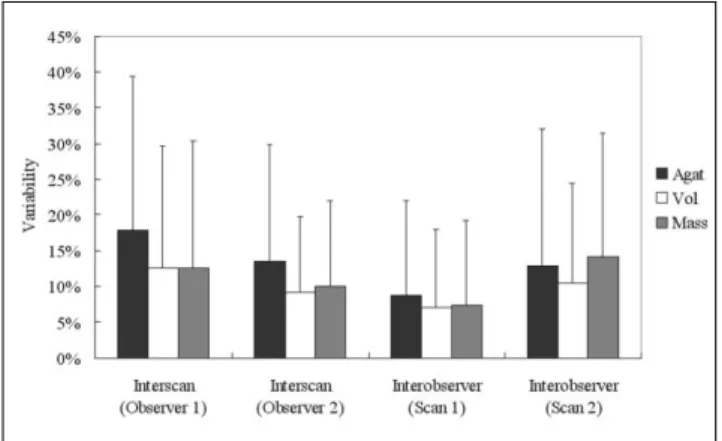
Interscan and Interobserver Variability (n=76) The interscan and interobserver variability for Agatston, volume, and mass scores is shown in Figure 3. The mean and median interscan variability for observer 1 was 18%
and 10% for Agatston, 12% and 8% for volume, as well as 12% and 7% for mass. In contrast, the mean and median interscan variability for observer 2 was 14% and 8% for Agatston, 9% and 5% for volume as well as 10%
Fig. 1. Measurement of image noise.
Region of interest (typically about 150 mm2) is set in ascending aorta on slice image at level of left coronary artery. Mean and standard deviation of CT values are 40 HU and 17 HU, respec- tively. Image noise is defined as standard deviation.
Fig. 2. Discrepancy in interpretation of calcium deposit.
A-C. Calcium (arrow in A) is interpreted to be located in aorta by one observer and in left main coronary artery by other observer;
calcium (arrow in B) interpreted to be in epicardium versus in left anterior descending artery; calcium (arrow in C) interpreted to be in left atrial wall versus in left circumflex artery.
A B C
and 6% for mass. The mean and median interobserver variability on scan 1 was 9% and 2% for Agatston, 7%
and 2% for volume, as well as 7% and 2% for mass. In contrast, the mean and median interobserver variability on scan 2 was 13% and 5% for Agatston, 10% and 4% for volume, as well as 14% and 8% for mass. The two-factor ANOVA results revealed that a statistically significant difference between scoring algorithms for interscan
variability (p < 0.05) and observers (p < 0.05). The post- hoc Scheffe、test revealed a statistically significant differ- ence between the Agatston and volume algorithms (p <
0.05) and between observer 1 and observer 2 (p < 0.05).
The two-factor ANOVA revealed no statistical significance for the interobserver variability between scoring
algorithms, however a significant difference was found between scans (p < 0.05). The Scheffe、test revealed a statistical significance between scan 1 and scan 2 (p <
0.05).
Effect of Heart Rate, Body Mass Index and Noise Level on Interscan and Interobserver Variability (n=76)
The noise levels were 15 ± 4 Hounsfield unit (HU) (range, 8-25 HU) for scan 1, and 14 ± 3 HU (range, 8-24
Fig. 3. Interscan and interobserver variability of Agatston, volume, and mass scores.
Graph shows interscan and interobserver variability (Agatston;
black, volume; white, mass; gray). Bars and vertical lines indicate mean and standard deviation, respectively. Interscan variability was different between scoring algorithms (p < 0.05) and observers (p < 0.05). Mean variability values are referenced in text.
A B
Fig. 4. Scatterplots show ratio (A) between heart rate (bpm) and interscan variability: r2 = 0.016, slope = -0.002 /bpm, intersection = 25%, p = 0.27 ratio (B) between body mass index (kg/m2) and interscan variability: r2 < 0.001, slope = 0.0003 /kg per millimeter squared, intersection = 12%, p = 0.94 and ratio (C) between noise level (HU) and interscan variability: r2 = 0.0007, slope = 0.0013 /HU, intersection = 11%, p = 0.82. Exceptional high variability is observed in case with low coronary artery calcium score.
C
Table 1. Agatston, Volume, and Mass Scores on Two Repeated Scans
Agatston Volume Mass
Reader 1
Scan 1 550 (197), 7-5423 445 (172), 8-4198 102 (37), 1-869 Scan 2 529 (212), 3-4676 430 (181), 7-3656 101 (41), 1-782 Reader 2
Scan 1 552 (197), 6-5844 447 (171), 8-4523 103 (37), 1-921 Scan 2 531 (209), 2-5086 433 (185), 5-4023 101 (40), 1-837 Note.─data are expressed as mean (median), range
HU) for scan 2. A regression analysis revealed that the interscan variability (n = 6, 3 CAC scoring algorithms×2 observers) was not significantly correlated with heart rate, BMI or noise level. For the representatives, the interscan variability for the mass score plotted against heart rate, BMI and noise level are shown in Figure 4. The interob- server variability (n = 6, 3 CAC scoring algorithms×2 scans) was not correlated with heart rate, BMI or noise level.
Relationship between Image Noise, Body Mass Index, and Body Weight (n=110)
The SD plotted against the BMI and body weight is shown in Figures 5 and 6. A regression analysis revealed a statistically significant influence of the patient’s BMI and body weight on the image noise (p < 0.05).
DISCUSSION
The present study demonstrates that interscan and interobserver variability of CAC measurements on a prospective ECG-triggered 64-slice CT with high image quality and 45% of RR acquisition, is not significantly affected by heart rate, BMI, or noise level.
Interscan and Interobserver Variability
We found promising results for volume or mass scoring with low interscan variability for the CAC measurements in the study (mean, 9-12%; median, 5-8%). In the latest study on multimanufacturer CT scanners (12), the mass algorithm has shown the least variability. The use of this standardization algorithm also enables a quantitative comparison of the CAC measured at different times and
using different CT scanner models. This facilitates a meaningful comparison for patient data (within a patient and across patients and institutions) (12). The interobserver variability was comparable to the results on electron-beam CT and a retrospective ECG-gated single-slice spiral CT (13), however the result seems to be a little high consider- ing the low interscan variability. The reason for this is not clear, however it may be due to the different interpretation of calcium measurements.
Effect of Heart Rate on Interscan and Interobserver Variability
Before the beginning of the study, we hypothesized that the variability would be influenced by heart rate, however it was actually not. As motion artifacts are one of the main factors contributing to an increase in the variability (3), accelerated gantry rotation speed leads to a reduction in variability. In addition, coronary artery motion tends to become faster as heart rate increases, however this is not necessarily always true and is not in a linear relationship.
The image quality of a coronary artery judged by motion artifacts is reported to degrade with a high heart rate in studies using a 64-slice CT coronary angiography (14, 15).
Similarly, the image quality of CAC measurements judged by motion artifacts, may also degrade with high heart rate.
However, the variability is significantly affected by the motion artifacts as well as partial volume effect or CAC measurement. We obtained a 45% RR image, which is indicated for coronary artery imaging in high heart rate patients, especially the right coronary artery. In summary, these are considered to be reasons for the lack of a signifi- cant difference for the variability between low and high heart rate groups. However, we need to perform a study with a large sample to further strengthen the conclusion.
Fig. 5. Scatterplot shows ratio between body mass index (kg/m2) and standard deviation (HU). r2 = 0.260, slope = 0.40 HU/kg per millimeter squared, intersection = 4.72 HU. Some exceptionally high (or low) standard deviations are due to individual body habitus (i.e., spinal spur is responsible for noisy image) or motion artifacts.
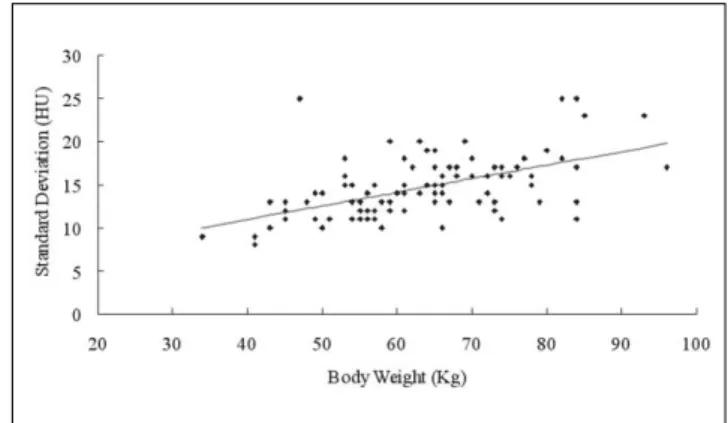
Fig. 6. Scatterplot shows ratio between body weight (kg) and standard deviation (HU). r2 = 0.301, slope = 0.16 HU/kg per millimeter squared, intersection = 4.67 HU.
Effect of Body Mass Index or Noise Level on Interscan and Interobserver Variability
Noise is a problematic issue as hyperdense noise may be misjudged as CAC (16). It is an especially serious concern for the electron-beam CT. The approximate noise level using a sharp reconstruction kernel is 24 HU, which was believed to be at the upper limit of acceptable noise levels (12). Apart from the design of the electron beam CT systems, which use a fixed tube current multi-slice CT, proportionally increases the number of X-ray photons for producing an image, leading to images with a better signal- to-noise ratio and higher spatial resolution when compared with current electron-beam CT scanners (17). The SD values in the study were controlled within 20 HU in most patients, which is considered to lead to no significant impact of BMI or noise level on the variability.
Relationship between Image Noise versus Body Mass Index and Body Weight
A positive slope (SD of BMI, 0.40; SD of body weight, 0.16) for the regression analysis between image noise versus BMI and body weight, suggests the need for the optimization of radiation dose based on physical constitu- tion. Previously published reports about the individual adjustment of the tube current, such as Mahnken et al.
(11), which used a body weight-adapted protocol (kilograms plus 33 mAs), showed an improved slope (SD of BMI, 0.19; SD of body weight, 0.054) compared to that on a fixed tube current (SD of BMI, 0.378; SD of body weight, 0.081; 133 mAs). In addition, Mu¨hlenbruch et al.
(18) showed an improved slope using automated attenua- tion-based tube current adaptation (SD of BMI, 0.25 to 0.51; depending on effective references of current time product, 150 mAs to 210 mAs) compared to that on a fixed tube current (SD/BMI, 1.30; 150 mAs). Lastly, Sevrukov et al. (19) showed a significant association between noise and BMI in an electron-beam CT study.
Limitations
Our data suggests that interscan and interobserver variability for the CAC measurement on prospective ECG- triggered 64-slice CT is not affected by heart rate;
however, a study with a larger patient population should be performed. We scanned 45% of RR images and found that the diastolic phase, which was most commonly used for cardiac imaging, needs to be further investigated. The diastolic-phase reconstruction may further decrease variability, especially in low heart rate patients. The interscan and interobserver variability was not affected by BMI or noise level, however it was in the result for high image quality, which was obtained using a higher dose (1.5
mSv) than an electron-beam CT (0.7 mSv) (7). We have to investigate to what level we can reduce the radiation dose.
Furthermore, the dose should be controlled on a per patient basis. Last, and most importantly, the variability results shown in the study were obtained from scans with the same positioning. Real world CAC examinations are performed on the order of years apart and the CT calibra- tion is different during the scans.
In conclusion, the interscan and interobserver variability of CAC measurements on a prospective ECG-triggered 64- slice CT with high image quality and 45% of RR acquisi- tion is not significantly affected by heart rate, BMI, or noise level. The volume or mass scoring for the CAC algorithms showed reduced interscan variability compared to Agatston scoring. The prospective ECG-triggered 64- slice CT using volume or mass scoring is recommended for monitoring CAC.
References
1. Greenland P, Bonow RO, Brundage BH, Budoff MJ, Eisenberg MJ, Grundy SM, et al. ACCF/AHA 2007 clinical expert consen- sus document on coronary artery calcium scoring by computed tomography in global cardiovascular risk assessment and in evaluation of patients with chest pain: a report of the American College of Cardiology Foundation Clinical Expert Consensus Task Force (ACCF/AHA Writing Committee to Update the 2000 Expert Consensus Document on Electron Beam Computed Tomography) developed in collaboration with the Society of Atherosclerosis Imaging and Prevention and the Society of Cardiovascular Computed Tomography. J Am Coll Cardiol 2007;49:378-402
2. Callister TQ, Raggi P, Cooil B, Lippolis NJ, Russo DJ. Effect of HMG-CoA reductase inhibitors on coronary artery disease as assessed by electron-beam computed tomography. N Engl J Med 1998;339:1972-1978
3. Qanadli SD, Mesurolle B, Aegerter P, Joseph T, Oliva VL, Guertin MC, et al. Volumetric quantification of coronary artery calcifications using dual-slice spiral CT scanner: improved reproducibility of measurements with 180 degrees linear interpolation algorithm. J Comput Assist Tomogr 2001;25:278- 286
4. Achenbach S, Ropers D, Mo¨hlenkamp S, Schmermund A, Muschiol G, Groth J, et al. Variability of repeated coronary artery calcium measurements by electron beam tomography.
Am J Cardiol 2001;87:210-213
5. Horiguchi J, Matsuura N, Yamamoto H, Hirai N, Kiguchi M, Fujioka C, et al. Variability of repeated coronary artery calcium measurements by 1.25-mm- and 2.5-mm-thickness images on prospective electrocardiograph-triggered 64-slice CT. Eur Radiol 2008;18:209-216
6. Horiguchi J, Shen Y, Hirai N, Yamamoto H, Akiyama Y, Ishifuro M, et al. Timing on 16-slice scanner and implications for 64-slice cardiac CT: do you start scanning immediately after breath hold? Acad Radiol 2006;13:173-176
7. Morin RL, Gerber TC, McCollough CH. Radiation dose in computed tomography of the heart. Circulation 2003;107:917- 922
8. Agatston AS, Janowitz WR, Hildner FJ, Zusmer NR, Viamonte M Jr, Detrano R. Quantification of coronary calcium using ultrafast computed tomography. J Am Coll Cardiol 1990;15:827-832
9. Yoon HC, Greaser LE 3rd, Mather R, Sinha S, McNitt-Gray MF, Goldin JG. Coronary artery calcium: alternate methods for accurate and reproducible quantitation. Acad Radiol 1997;4:666-673
10. Hong C, Bae KT, Pilgram TK, Suh J, Bradley D. Coronary artery calcium measurement with multi-detector row CT: in vitro assessment of effect of radiation dose. Radiology 2002;225:901-906
11. Mahnken AH, Wildberger JE, Simon J, Koos R, Flohr TG, Schaller S, et al. Detection of coronary calcifications: feasibility of dose reduction with a body weight-adapted examination protocol. AJR Am J Roentgenol 2003;181:533-538 12. McCollough CH, Ulzheimer S, Halliburton SS, Shanneik K,
White RD, Kalender WA. Coronary artery calcium: a multiinsti- tutional, multimanufacturer international standard for quantifi- cation at cardiac CT. Radiology 2007;243:527-538
13. Goldin JG, Yoon HC, Greaser LE 3rd, Heinze SB, McNitt-Gray MM, Brown MS, et al. Spiral versus electron-beam CT for coronary artery calcium scoring. Radiology 2001;221:213-221 14. Leschka S, Wildermuth S, Boehm T, Desbiolles L, Husmann L,
Plass A, et al. Noninvasive coronary angiography with 64- section CT: effect of average heart rate and heart rate variability
on image quality. Radiology 2006;241:378-385
15. Wintersperger BJ, Nikolaou K, von Ziegler F, Johnson T, Rist C, Leber A, et al. Image quality, motion artifacts, and reconstruc- tion timing of 64-slice coronary computed tomography angiog- raphy with 0.33-second rotation speed. Invest Radiol 2006;41:436-442
16. Bielak LF, Kaufmann RB, Moll PP, McCollough CH, Schwartz RS, Sheedy PF 2nd. Small lesions in the heart identified at electron beam CT: calcification or noise? Radiology 1994;192:631-636
17. Budoff MJ, Achenbach S, Blumenthal RS, Carr JF, Goldin JG, Greenland P, et al. Assessment of coronary artery disease by cardiac computed tomography: scientific statement from the American Heart Association Committee on Cardiovascular Imaging and Intervention, Council on Cardiovascular Radiology and Intervention, and Committee on Cardiac Imaging, Council on Clinical Cardiology. Circulation 2006;114:1761-1791 18. Mu¨hlenbruch G, Hohl C, Das M, Wildberger JE, Suess C, Klotz
E, et al. Evaluation of automated attenuation-based tube current adaptation for coronary calcium scoring in MDCT in a cohort of 262 patients. Eur Radiol 2007;17:1850-1857
19. Sevrukov A, Pratap A, Doss C, Jelnin V, Hoff JA, Kondos GT.
Electron beam tomography imaging of coronary calcium: the effect of body mass index on radiologic noise. J Comput Assist Tomogr 2002;26:592-597