A Study on Hydrographic Survey based on Acoustic Echo-Sounder and GNSS
Eung-Hyun PARK
1※·Dae-Hyun KIM
1·Hae-Yeon JEON
1Ho-Yun KANG
1·Kyung-Wan YOO
1음향측심기와 GNSS 기반의 수로측량에 관한 연구
박응현
1※·김대현
1·전혜연
1·강호윤
1·유경완
11)
ABSTRACT
In this study, In this study, the Datum Level–based hydrography surveying system and the ellipsoid-based system were analyzed to acquire more consistent depth data. For the study, the ellipsoid-based surveying for hydrography was conducted twice for the same track line. And the depth was calculated by correcting rise and fall of water level (water level change by tidal energy and other marine environmental energies) respectively by the traditional water level correction method and ellipsoidally referenced water level correction method. there is able to check that Ellipsoid-based hydrographic surveying data is more improved than Datum Level-based hydrographic surveying data in aspect of level difference phenomenon in the same area (surveying line). This result shows that if the Ellipsoid-based hydrographic surveying is performed, the sea level change (tidal energy and other marine environmental energy) of the survey area in real time could be reflected to more consistent generating bathymetric data.
KEYWORDS : Ellipsoid, Datum Level, GNSS, Tide, Depth, Bathymetry, Hydrography
요 약
본 연구는 현 기본수준면 기반의 수로측량 시스템과 타원체 기반의 수로측량 시스템을 분석하여 좀 더 일관성 있는 해저지형자료를 얻을 수 있는 방법에 대해 연구하였다. 이를 위해 타원체 기반 의 수로측량을 동일한 측선 라인에 대하여 왕복 수행하였다. 그리고 해수면의 승강현상(조석 에너 지 및 그 외 해양환경 에너지에 따른 해수면 변화)을 기본수준면 기반의 보정방법과 타원체 기반 의 수심 보정방법으로 각각 처리하여 수심을 산출 하였다. 분석결과, 동일 구역(측선)의 수심단차
2018년 08월 28일 접수 Received on August 28, 2018 / 2018년 09월 21일 수정 Revised on September 21, 2018 / 2018년 09월 21일 심사완료 Accepted on September 21, 2018
1 한국해양조사협회 Korea Hydrography and Research Association
※ Corresponding Author E-mail : [email protected]
현상이 기본수준면 기반의 산출물보다 타원체 기반의 산출물이 좀 더 향상된 것을 확인 할 수 있 었다. 이러한 결과는 타원체 기반의 수로측량을 수행할 경우 측량구역의 해수면 변동을 실시간으 로 반영함으로서 좀 더 일관성 있는 해저지형을 생성 할 수 있다고 사료된다.
주요어 : 타원체, 기본 수준면, GNSS, 조석, 수심, 측심, 수로측량
Introduction
South Korea owns 4.5 times maritime territory of the land area and Korea Hydrographic and Oceanographic Agency (below KHOA) conducts a hydrographic surveying every year for safety navigation information, the protection of the marine environment, and the development of marine resources.
A hydrographic surveying of consistent measurement depth means that it should be calculated by consistent depth even if the same area(track line) is surveyed several times at different points in time(it is assumed that it will not change according to the time of the bathymetry).
However, since the water level(tide, ocean current, water level change, etc.) rise and fall occurs in time and area in South Korea, the height of water level is different at each measurement time even in same area(track line). Therefore, in order to calculate consistent depth, a correction of tide should be accompanied which is the largest energy among the energies generating water level rise and fall. Currently, South Korea has been conducting correction of tidal for the purpose of creating nautical charts for safety of navigations except for special purpose research such as a coastline survey. So the correction of tide of the
nautical charts is performed based on Datum Level(the water level with the lowest tide observation result for a certain period, below DL)
In principle, the data of tidal correction should be the same as time and area while conducting the hydrographic surveying. But in real case it is difficult to observe of tide for all sections in large-scale marine environments. Therefore, if there is a tide data by tide station near surveying area or tide pole observation(if there are tidal bench marks) or applying for constant for correction of tide, the tidal correction has been conducted. However, the above tidal correction method doesn’t correct for rise and fall of water level(water level change by tidal energy and other marine environmental energies) in real-time, so there is a limit to calculate consistent depth.
So, it is trying to study the ellipsoidally
referenced surveying system that utilizes
the vertical component of GNSS(Only the
horizontal component of GNSS is utilized
now). The ellipsoidally referenced
surveying system can calculate bathymetry
by ellipsoid-height received by the GNSS
antenna installed in the ship and the height
of the echo-sounder. In other words, it is
possible to correct rise and fall of water
level in time and area through storing the
GNSS data in real-time so, it can be
calculated by consistent measurement
bathymetry Thus, in this study, it consider the validity of consistent bathymetry data with comparing and analyzing the data obtained by conducting round-trip hydrographic surveying on the same area (track line) reference ellipsoid.
1. Overseas Status 1) FIG Publication
FIG(International Federation of Surveyors) published“Ellipsoidally Referenced Surveying for Hydrography”with the support of a number of hydrographers and hydrographic organizations around the world. It also includes technical contents and research contents through each case. The U.S.
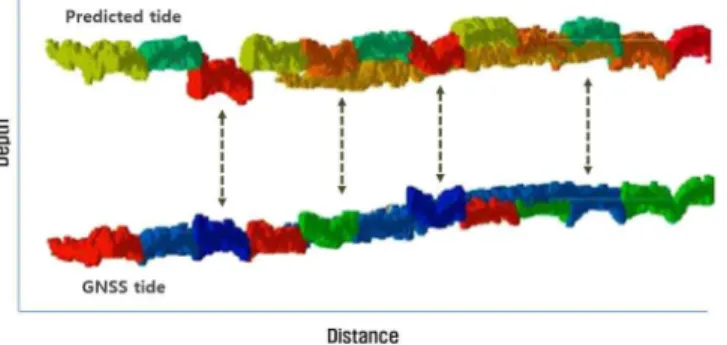
Naval Oceanographic Office(NAVOCEANO) analyzed each track line continuation by the tidal correction method as shown in Fig 1(FIG, 2014). In Fig 1, the top image shows an end-on view of a dataset composed of multiple swaths that were corrected with predicted tide data. The bottom image shows the same dataset corrected by GNSS tide.
When tidal correction is conducted on
GNSS tide as hydrographic surveying data (Fig 1), provides batter each track line continuation than predicted tide data.
Experimental Section
1. Datum Level-based surveying for hydrography
The hydrographic survey(research) project generally conducts Datum Level-based surveying for hydrography except for the purpose of special survey. Fig.2 (A) is generalized representation of the vertical component that calculates the depth(Datum Level and sea bed) of DL-based. After the Water Level(Fig 2. (A), a) is observed by using the echo- sounder, in order to calculate the Depth(Fig 2. (A), c) of DL- based it should conduct tidal correction.
The magnitude of the tide correction(Fig.
2 (A), b) is classified. as the height(tide) of the water surface generated by the tidal energy and the height(±α) generated by the energy corresponding to the marine environment. Depending on the hydrographic surveying environment, if the tidal energy
FIGURE 1. Comparison between predicted tides (upper) and
GNSS tides (lower)
is large, the magnitude of ±α will be insignificant, but for accurate tidal correction, correction of the water level change according to the marine environment should also be accompanied. However, in real case since‘±α’doesn’t be classified and doesn’t be observed, only the amount of change in water level by tidal energy should be corrected. Currently, in South Korea, the amount of change of the water level by tidal energy is calculated using the standard tidal application network (below TideBed) established by KHOA developed a TideBed system to complement this because it does not observe the change of water level by tidal energy in time and area while conducting the hydrographic surveying. This system can calculate tidal data through applying constant for correction of tide(time difference for tide, height ratio for tide) to hydrographic survey area referenced the standard tide station.
2. Ellipsoid-based Bathymetric Surveying As mentioned above, the tidal correction can be performed using the TideBed system. However, if the hydrographic surveying is measured at same area in different times, it is difficult that calculating the depth(Fig 2, c) consistently at same area because of the height of Fig 2, (b) can not be calibrated consistently.
Therefore, Ellipsoid-based hydrographic surveying to complement these limitations began to emerge. Fig 2. (B) shows the vertical components calculated by height of ellipsoid and sea bed by hydrographic surveying based on ellipsoid. Since the GNSS antenna installed in the surveying vessel receives the Ellipsoid height(Fig 2.
(B), a) in real time, the Ellipsoid height(Fig 2. (B), a) also can measure the same displacement. Therefore, the bathymetric height(Fig 2. (B), d) is not changed because of the water level(Fig 2.
(B), C) and Ellipsoid height(Fig 4, a) has negative correlation each other. This is, FIGURE 2. (A) DL-based Vertical components.
(B) Ellipsoid-based Vertical components.
even if several hydrographic surveying is performed at same area in different times, the sea level change can be observed temporally and spatially, it would be calculated consistent bathymetric data.(But, there some calibration need to vertical change as Dynamic Draft.) In addition, if the users are applicating the Ellipsoid- based hydrographic surveying data as the depth of nautical chart, Datum Level(DL) conversion is needed. And if SEP(e, separation model) is applied at the bathymetric height(d) of Fig 2. (B), it can be calculated as the depth based on Datum Level(DL).
3. Analysis Method
In order to analyze the consistent depth data, we carried out round-trip survey on the same area(surveying line) according to each hydrographic surveying method in Section 2.1 and 2.2. And in order to surveying the sea level, R2Sonic’s MBES model‘SONIC 2020’was used and position information and vessel’s motion calibration is made by Applanix’s POS
MV system. Also, the position information (x,y,z) was received (4Hz) using the RTK(Real Time Kinematic) principle. The obtained data were classified and analyzed for the same vertex by each surveying line.
1) Data processing
In order to calculate the Datum Level and the height of Ellipsoid-based hydrographic surveying, data processing was performed as shown in Fig. Data processing software uses CARIS’s HIPS
& SIPS 7.1 and it is the most well- designed program for handling large amounts of signals that acquired from MBES.
Results and Discussion
1. Analysis of data as Datum Level
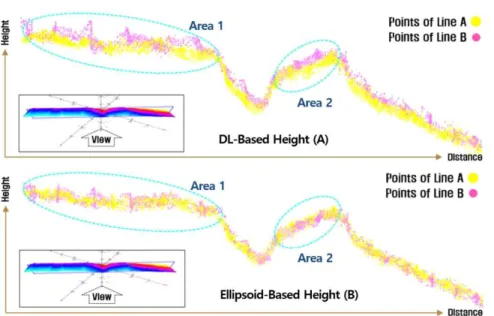
Fig. 4 (A) shows the height (depth) of
the Datum level reference, which are
classified surveying lines and tidal
correction using by constant for correction
at main tide station. Theoretically, the
FIGURE 3. Data Processing Flowchart
depths are calculated same value, because it is the surveying data from same area.
But there are generated level difference in the Fig 4. (A) area 1-2. In case of Fig 4.
(B), it shows the height(bathymetry) based on ellipsoid plane is plotted in surveying lines that same with Fig 4. (A).
It can be seen that the height which calculating based on Datum level is improved at the level difference(Fig 4. (B) area 1-2) the compare with the calculating the height based on ellipsoid plane.
In order to quantitatively analyze these level difference, first analyzing the height difference according to each Datum Level was analyzed as shown in Table 1. The
difference values were compared by extracting 30,358 identical vertices. When the height difference values were compared with each other, the ±3cm level difference was improved and the RMSE(mean square error) was improved about 2 times.
2. GNSS vertical motion effect (Heave) The data were acquired to the 1m depth zone same with 3.1, using the Real Time Kinematic(RTK) method of GNSS and set the EofE Ultrasonic’s SBES model
‘EA400’and Leica’s GPS model‘GS25’
to Jet ski. If hydrographic surveying with SBES is performed to shallow coast, it may not be possible to install a motion
Analysis DL-Based Ellipsoid-Based
Mean ±5cm ±2cm * RMSE : Root Mean Square Deviation
* Mean : Average by the absolute value
* Difference in height - Observation of line A–line B
Min -12cm -15cm
Max 24cm 21cm
RMSE 6 3