INTRODUCTION
Eutrophication can cause increase in primary productivity, reductions in transparency, oxygen depletion in water column, losses of suitable aqu- atic habitats and biodiversity, public health threat in freshwater systems (Portielje and Van der Molen, 1999). In lakes, eutrophication can directly affect autotrophic, heterotrophic and benthic mic- roorganism in aquatic habitats (Dodds, 2006).
Several methods to control eutrophication in reser-
voirs were introduced by Straskraba (1996) with ecotechnological methods and by Pütz and Ben- ndorf (1998) with pre-reservoir method. Environ- mental qualities of coastal estuarine systems have been a major global concern related to anthropo- genic inputs originated from inland (UNEP, 2006).
Reservoirs were constructed for irrigation, water supply and flooding control in Korea. Freshwater for water supply (mountain reservoirs and Nak- dong river system) has been very important for social economy (Chun et al., 2001). In general, res- ervoir dynamics are not controlled naturally due
─
─ 432 ──
* Corresponding author: Tel: +82-61-240-7312, Fax: +82-61-240-7301, E-mail: [email protected]
Long-term Paradigm Analyses of Chlorophyll a and Water Quality in Reservoir Systems
Bach, Quang-Dung, Yongsik Shin1,
*
and Eunsook Song2(Center for Environmental Research, Vietnam Institute of Meteorology, Hydrology and Environment, 62/23 Nguyen Chi Thanh Road, Dong Da District, Hanoi, Vietnam
1Division of Ocean System Engineering, Mokpo National Maritime University, Mokpo 530-729, Korea
2Coastal Estuarine Research Center, Mokpo National Maritime University, Mokpo 530-729, Korea)
During the period of past fifteen years (1992~~2006), variations of chlorophyll a in relation with water quality in freshwater reservoirs were investigated. This study compared total nitrogen (TN), total phosphorus (TP), chlorophyll a, Secchi depth (SD) and total suspended solids (TSS) between terrestrial freshwater reservoir and coas- tal freshwater reservoir systems based on their location. Regression analyses (linear and non-linear regressions) were applied for all study sites to examine relationship and interaction of these factors in the freshwater systems from in-land to coasts. The results demonstrated that chlorophyll a was significantly correlated to total phospho- rus (R2==0.94, P⁄⁄0.0001) and was remarkably related to TSS increase (R2==0.63, P⁄⁄ 0.0001) in the selected reservoirs. The TN : TP ratio in the reservoir systems was higher than Redfield ratio (16 : 1) indicating that the reservoirs are potentially experiencing P limitation. Water quality of coastal freshwater reservoir system was more significant- ly decreased than the reservoirs located in in-land during the past fifteen years. The strict management of nutrient discharge into freshwater systems should implement- ed in the coastal reservoirs since the freshwater is introduced into coastal estuarine systems.
Key words : long-term data, water quality, chlorophyll a, nutrient limitation, coastal estuarine systems
to unique properties different from natural lakes.
However, their principles of ecological processes and controlling factors are similar to natural lakes.
Eutrophication paradigm for freshwater reser- voir such as Daecheong reservoir was developed by Jones et al. (1997) and An and Park (2002). In this study, long-term and multi-reservoir study allows us not only to assess the risk of eutrophica- tion-related problems in entire reservoirs but also to identify the characteristics of nutrient loading which must be controlled to maintain desirable water quality. We also aimed to evaluate the vari- ations of total nitrogen, total phosphorus, chloro- phyll a, Secchi disk depth and total suspended solids for a comparison between terrestrial and coastal freshwater reservoir systems.
MATERIALS AND METHODS
Based on the location of the reservoirs, the Ok- chong, Andong, Juam and Daecheong reservoirs located in in-land were selected for terrestrial freshwater reservoir systems and Asan, Sapkyo,
Geum, Youngsan and Nakdong located in coastal estuarine areas were grouped into coastal fresh- water reservoir systems (Fig. 1). Total nitrogen (TN), total phosphorus (TP), chlorophyll a, Secchi disk depth (SD) and total suspended solids (TSS) were analyzed for water quality of the reservoirs.
Data were chosen from 3 stations for each reser- voir. Monthly data (1992~2006) including chloro- phyll a, TN, TP, SD and TSS were obtained from water quality monitoring program (Korea Ministry of Environment) and precipitation from Korea Meteorological Administration. TN, TP and Chlo- rophyll a (chl a) was measured by using spectrop- hotometric analyses and Secchi disk was used to measure water transparency. TSS was determined by using procedure for total suspended solids.
Ratios of TN : TP were analyzed to examine the potential nutrient limitation of N and P. Nitrogen is considered to be limited if the ratios are lower than redfield ratio (Redfield, 1958), 16 : 1 and P is limited if the ratios are higher than 16 : 1. Further details of collection and analyses of water quality data were described in http://water.nier.go.kr.
Statistical analysis and paradigm (linear and non- linear regressions) were applied for all data to examine the correlationships of parameters in the freshwater systems.
RESULTS
1. Comparisons between terrestrial reservoirs and coastal reservoirs
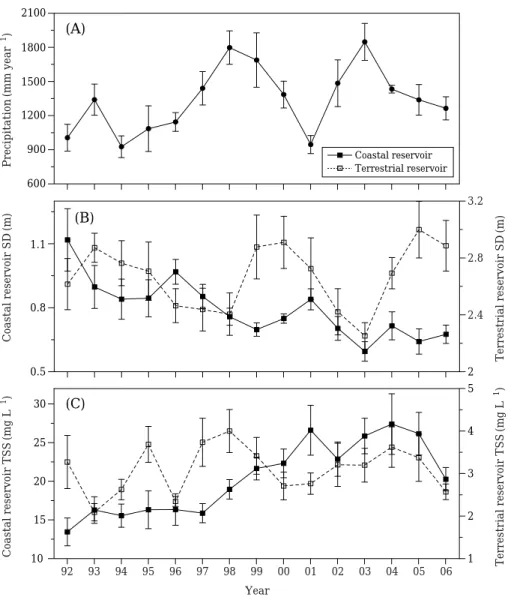
In terrestrial reservoirs, annual mean Secchi disk depth ranged from 2.2 to 3.2 m.
High precipitation and low transparency were observed in terrestrial reservoirs such as in 1997, 1998 and 2003 (Fig. 2A-B). In coastal reservoirs, annual Secchi depth ranged from 0.55 to 1.3 m.
The gradual decrease of transparency was obser- ved for coastal reservoirs over fifteen years (Fig.
2B). Annual mean TSS was higher in coastal res- ervoirs (12~31 mg L
-1) than terrestrial reservoirs (2~4.5 mg L
-1). In coastal reservoirs, TSS signif- icantly increased from 12 mg L
-1in 1992 up to 31 mg L
-1in 2004.
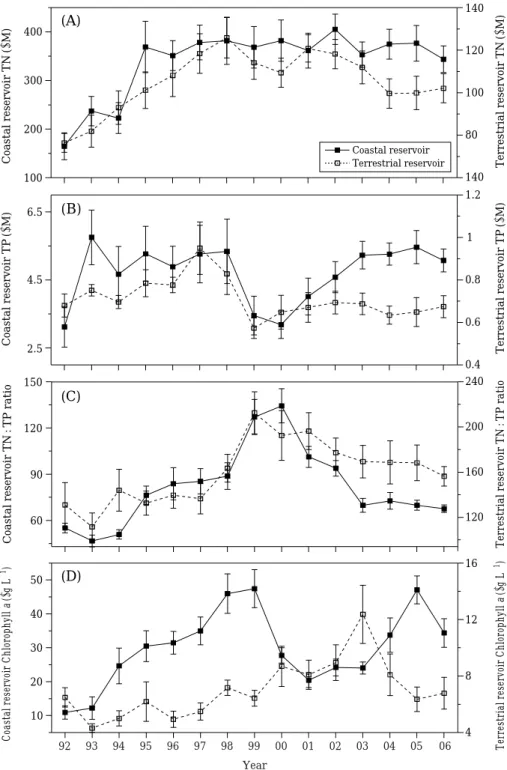
The annual mean variations of TN, TP and chl a between terrestrial reservoirs and coastal reservo- irs are shown in Fig. 3. In coastal reservoirs, TN, TP and chl a concentrations were evidently higher than those in terrestrial reservoirs (Fig. 3A, 3B,
Fig. 1. The study sites in terrestrial (▲) and coastal (●) reservoirs located in inland and coastal areas.
Ansan
Sapgyo
Daecheong Andong
Geum
Okchong
Nakdong
Juam Youngsan
3D). Inversely, TN : TP ratio was higher in terres- trial reservoirs ranging from 110 to 230 (Fig. 3C).
TN and TP had similar variation patterns in both of terrestrial reservoirs and coastal reservoirs (Fig.
3A, 3B). TN concentration increased from 1992 to 1995 and stabilized (350~400 μM) from 1995 to 2006 in coastal reservoirs. TN concentration inreased from 1992 to 1998 up to 125 μM and slightly decreased from 1998 to 2006 in terrestrial reservoirs. Concentration of TP was high from 1993 to 1998 period, and it declined during 1999~
2000 period in both of terrestrial reservoirs and coastal reservoirs. In period of 2001~2006, TP concentration was high in coastal reservoirs but
low in terrestrial reservoirs. In Fig. 3C, TN : TP ratio increased from 1992 to 2000 and decreased from 2000 to 2006 in coastal reservoirs. The TN : TP ratio increased from 1992 to 1999 and decreased during 1999~2006 in terrestrial reser- voirs. The annual mean variation of chl a concen- tration in coastal reservoirs was different from that in terrestrial reservoirs (Fig. 3D). In coastal reservoirs, the chl a concentration increased from 12 μg L
-1(1992) to 47 μg L
-1(1999) and rapidly decreased during 2000~2003 period and increased again during 2004~2006. In terrestrial reservoirs, chl a concentration gradually increased from 4 to 8 μg L
-1and peaked in 2003 (~12 μg L
-1).
600
1.1
0.8
0.5 900 1200 1500 1800 2100
2
10 15 20 25 30
(A)
(B)
1 2 3 4 5
(C)
Precipitation(mm year-1)Coastal reservoir TSS(mg L-1)Coastal reservoir SD(m) Terrestrial reservoir TSS(mg L-1)Terrestrial reservoir SD(m)
3.2
2.8
2.4 Coastal reservoir
Terrestrial reservoir
92 93 94 95 96 97 98 99 00 01 02 03 04 05 06 Year
Fig. 2. Variations of annual means for precipitation, Secchi disk depth (SD) and annual mean total suspended solids (TSS) collected from all study sites during the past fifteen years (1992~2006).
2. Relationships between nitrogen, phosphorus and chlorophyll a
In this study, TN : TP ratios ranged from 28 to 439 for all reservoirs. The TN : TP ratio was gen-
erally higher than Redfield ratio (~ 16 : 1) and re- vealed a positive correlation between TN and TP (Fig. 4A). Regression analysis of log-transformed TN : TP against TP indicated TN : TP was negati- vely correlated with TP (Fig. 4B). Inversely, the
(A)(B)
(C)
10 20 30 40 50
4 8 12 16
(D)
400
300
200
100
6.5
4.5
2.5
150
120
90
60 Coastal reservoir TP(μM)Coastal reservoir TN:TP ratioCoastal reservoir Chlorophyll a(μg L-1) Coastal reservoir TN(μM)
0.4 240
200
160
120 0.6 0.8 1
Terrestrial reservoir TN(μM)Terrestrial reservoir TP(μM)Terrestrial reservoir TN:TP ratioTerrestrial reservoir Chlorophyll a(μg L-1) 140
120
100
80
140 1.2 Coastal reservoir
Terrestrial reservoir
92 93 94 95 96 97 98 99 00 01 02 03 04 05 06 Year
Fig. 3. Variations of annual means for TN, TP, TN : TP ratio, Chl a collected from all study sites during the past fifteen years (1992~2006).
ratio was not correlated with TN (Fig. 4C). The increase of chl a concentration was slightly affect- ed by the decrease of TN : TP ratio (Fig. 4D).
Linear relationship was observed between log- transformed annual mean chl a and log-transfor- med annual mean TN concentrations for all study sites (Fig. 5A). Strong curvilinear relationship was fit between log-transformed annual mean chl a and log-transformed annual mean TP (Fig. 5B) as follows.
Log
10(Chl a)= =0.99
++0.88 Log
10(TP) -0.39 Log
10(TP)
2, R
2= =0.94
3. Relationships between physio-chemical and biological parameters
In the reservoirs, inter-relations between physi- cal, chemical and biological factors including total phosphorus, total nitrogen, Secchi disk depth, chl
a concentration and total suspended solids wereanalyzed (Fig. 6). Transparency of water (SD) was
1.9 2.2 2.5 2.8
2.5
2
1.5
1
0.5
0 Log10 Chl a(μg L-1)
2.5
2
1.5
1
0.5
0 Log10 Chl a(μg L-1)
Log10 TN (μM)
Log10 TP (μM)
-0.6 -0.2 0.2 0.6 1
(A)
(B)
Fig. 5. Relationship between log-transformed Chl a and log-transformed TN, TP concentrations (annual means) respectively collected from terrestrial and coastal freshwater reservoirs (1992~2006).
1.2 1.6 2 2.4 2.8
(A)
(B)
(C)
(D)
0.5 1 1.5
2 800
600
400
200
2.8
2.4
2
1.6
1.2 0 TN(μM)Log10(TN:TP ratio)Log10(TN:TP ratio)Log10 Chl a (μg L-1)
Log10 TP (μM)
Log10 TN (μM)
Log10(TN : TP ratio) TP (μM)
Redfield ratio (16 : 1 by moles)
0 4 8 12
-0.4 0 0.4 0.8 1.2
1.6 2 2.4 2.8 3.2
1.2 1.6 2 2.4 2.8
Fig. 4. Relations of TN vs. TP concentrations, log-transfo- rmed TN : TP molar ratios vs. log-transformed TN, TP (annual means) collected from terrestrial and coastal freshwater reservoirs (1992~2006).
Linear paradigm:
Log10Chl a==-1.17++1.01 Log10(TN) R2==0.52, P⁄0.0001
Quadratic paradigm:
Log10Chl a==0.99++0.88 Log10 (TP)-0.39 Log10 (TP)2 R2==0.94, P⁄0.0001
Log10(TN : TP)==2.11-0.41 Log10(TN) R2==0.61, P⁄0.0001
Log10(TN : TP)==2.65-0.28 Log10(TN) R2==0.13, P⁄0.0001
Log10(Chl a)==2.59-0.74 Log10(TN : TP) R2==0.16, P⁄0.0001
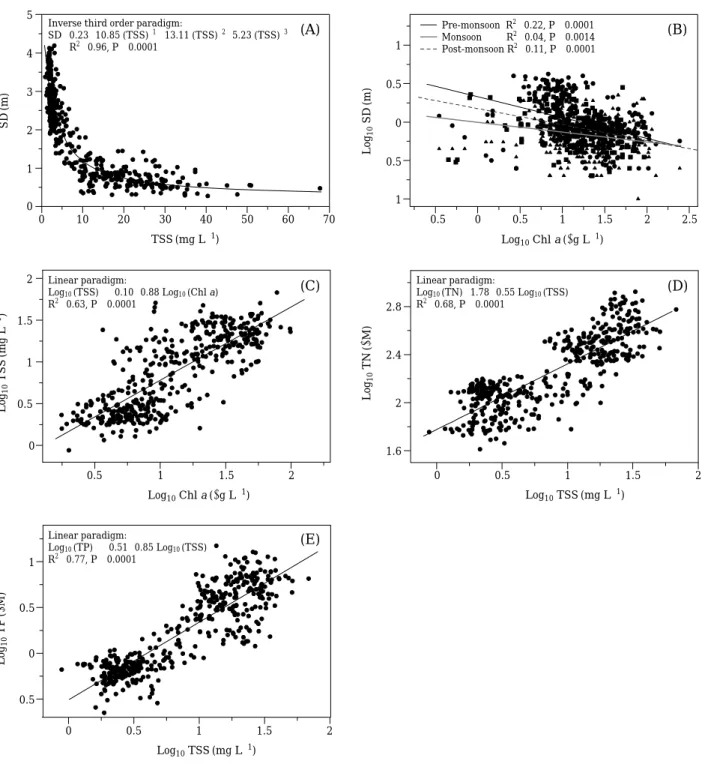
related with TSS by inverse third order (Fig. 6A).
SD= =0.23
++10.85 (TSS)-13.11 (TSS)
-2+
+
5.23 (TSS)
-3, R
2= =0.96
Log-transformed SD appeared to have negative
relationship with log-transformed chl a (Fig. 6B) and chl a concentration was positively correlated with TSS (Fig. 6C). Log-transformed annual mean data of TN and TP concentrations were also posi- tively correlated with log-transformed annual
0 1
1
1 1.5 2 2.5
0.5
0.5 0
0 -0.5
-0.5 -1 2
3 4 5
1.6 2 2.4 2.8
0 0.5
-0.5 1
0.5 1 1.5 2 0 0.5 1 1.5 2
0 0.5 1 1.5 2
SD(m)
0 10 20 30 40 50 60 70
TSS (mg L-1)
(A) (B)
(C)
(E)
(D)
Log10 SD(m)
Log10 Chl a (μg L-1)
Log10 Chl a (μg L-1)
Log10 TSS(mg L-1) Log10 TN(μM)
Log10 TP(μM)
Log10 TSS (mg L-1)
0 0.5 1 1.5 2
Log10 TSS (mg L-1)
Fig. 6. Relationship between annual means of parameters including Secchi disk depth (SD), TSS, Chl a, TN and TP collect- ed from terrestrial and coastal freshwater reservoirs (1992~2006). Correlation of SD vs. Chl a was shown for the period of pre-monsoon (Jan~Jun, ●), monsoon (Jul~Aug, ▲) and post-monsoon (Sep~Dec,■).
Inverse third order paradigm:
SD==0.23++10.85 (TSS)-1-13.11 (TSS)-2++5.23 (TSS)-3 R2==0.96, P⁄0.0001
Pre-monsoon R2==0.22, P⁄0.0001 Monsoon R2==0.04, P⁄0.0014 Post-monsoon R2==0.11, P⁄0.0001
Linear paradigm:
Log10(TSS)==-0.10++0.88 Log10(Chl a) R2==0.63, P⁄0.0001
Linear paradigm:
Log10(TN)==1.78++0.55 Log10(TSS) R2==0.68, P⁄0.0001
Linear paradigm:
Log10(TP)==-0.51++0.85 Log10(TSS) R2==0.77, P⁄0.0001
mean TSS (Fig. 6D, E).
DISCUSSION
In coastal reservoirs, the variations of annual mean chl a concentration may be affected by both phosphorus and TN : TP ratio. In this study, the peak of TN : TP ratio appeared due to TP decline and was coincident with the collapse of chl a con- centration in 2000. The collapse was gradually restored after several years when TP increased and TN : TP ratios decreased. Smith (1982) also emphasized that algal biomass in lakes was dep- endent both on the phosphorus concentration and the TN : TP ratio. In terrestrial reservoirs, the variation of chl a was not related to TN and TP variations in long-term basis. Based on the crite- ria from Marshall and Peters (1989), the coastal reservoirs were eutrophic (mean chl a concentra- tion ¤12 μg L
-1) and the terrestrial reservoirs were oligotrophic or mesotrophic (mean chl a con- centration ⁄7 μg L
-1).
Redfield ratio has widely been used to assess the nutrient limitation of aquatic ecosystem (Redfield, 1958; Smith, 2006). The TN : TP ratio in the reservoir systems was higher than Redfield ratio indicating that the reservoirs are potentially experiencing P limitation. Sakamoto (1966) docu- mented that strong P limitation was observed when TN : TP ratio was higher than 17 : 1 in lakes.
Therefore, phosphorus is considered as the limit- ing factor for primary production in the reservoirs.
Phosphorus variations are sensitive to variations in the TN : TP ratios in reservoir systems (Fig. 4B).
The similar results have been documented by An and Park (2002) for Daecheong reservoir. Fisher
et al. (1995) reported that the restriction of phyto-plankton growth in inland waters was due to nutrient limitation. The strong P limitations were also common in freshwater lakes of the north tem- perate region (Arhonditsis and Brett, 2005). Phos- phorus loadings from external (anthropogenic emission) or internal (recycling nutrient in ecosys- tem) processes affected phytoplankton growth, and biomass accumulation. However, external P loading was related to discharge or land use and internal P loading was strongly related to season (Steinman et al., 2009).
The curvilinear relationship of data analysis suggests that the relationship between Chl a and TP was weaker than between Chl a and TN. This
is probably due to a different mechanism between N and P in nutrient cycles. The curvilinear relati- onship of phytoplankton and phosphorus was also documented by An and Park (2002). They argued that rapid flushing and high inorganic suspended solids during wet seasons modified Chl a-TP rela- tionship.
By enhancing biological activity, macro-nutrient enrichment is typically related to remarkable cha- nges in the shift in phytoplankton species composi- tion (Bellinger et al., 2006; Dong et al., 2008). In the freshwater, the cyanobacteria including harm- ful species were typically dominant (Reeders et
al., 1998; Gobler et al., 2007). In addition, the eut-rophication causes difficulties for drinking water treatment processes such as purifications of toxin, inorganic and organic matters (Vorobieva et al., 1996).
The variations of SD and TSS in coastal reser- voirs have rapidly changed during the recent fif- teen years. This indicates that water qualities of coastal reservoirs were typically impacted by dis- charge sources from upstream. The results from Fig. 6 imply that the increase of TSS caused rapid decrease in water transparency and TSS had posi- tive correlations with Chl a, TN and TP. Roozen
et al. (2003) also showed that inorganic suspendedsolids affecting turbidity had a positive correlation with phytoplankton biomass in lakes. Based on the results, we conclude that inter-reaction among TSS, nutrients and phytoplankton biomass esti- mated by chlorophyll a were evident and eutrophi- cation caused rapid changes of water quality para- meters in the study reservoirs.
Kronvang et al. (2005) showed that the reducing
duty of TN and TP discharges from point sources
to the Danish aquatic environment has reduced
69% of TN and 82% of TP after 13 year implemen-
tation. In Korea, nutrient loadings from non-point
sources are potentially increasing and freshwater
discharges into coastal water through embankm-
ents are high during summer monsoon and they
are related to annual precipitation intensity. The
increases in nutrient concentrations of freshwater
due to nutrient inputs from urban and agriculture
can cause essential increase of nutrient loading
into coastal waters. Therefore, the reductions in
major sources of nutrient loading (N, P) to streams
may contribute to the declines in riverine and lake
nutrient concentrations and improvements in tro-
phic conditions in freshwater systems as well as
coastal estuarine systems.
In conclusion, this study contributes to better understanding the freshwater reservoir systems in which nutrient enrichment can modify primary production (chlorophyll a). Two primary nutrients (N, P) were related to aquatic primary production in the study reservoirs however P may be more important source since TP significantly influenced TN : TP ratio and the reservoirs experience mostly P limitation. Chlorophyll a was related more lin- early to nitrogen increase than to phosphorus in- puts probably due to a different mechanism bet- ween N and P in nutrient cycles. Eutrophication was evident in the coastal reservoir systems com- pared to terrestrial systems and generally related to deteriorated conditions such as increase of TSS and decrease of water transparency. This can shift freshwater ecosystem in the coastal area but also impact coastal marine habitats since the fresh- water is introduced into marine systems.
ACKNOWLEDGEMENTS
This project was supported by Honam Sea Grant R & D Program fund of (2008). This work was supported by the Korea Science and Engineering Foundation (KOSEF) grant funded by the Korea government (MEST) (R01-2008-000-20388-0).
LITERATURE CITED
An, K.G. and S.S. Park. 2002. Indirect influence of the summer monsoon on chlorophyll-total phospho- rus models in reservoirs: a case study. Ecol. Model.
152: 191-203.
Arhonditsis, G.B. and M.T. Brett. 2005. Eutrophication model for Lake Washington (USA): Part II-model calibration and system dynamics analysis. Ecol.
Model. 187: 179-200.
Bellinger, B.J., C. Cocquyt and C.M. O
’
Reilly. 2006.Benthic diatoms as indicators of eutrophication in tropical streams. Hydrobiol. 573: 75-87.
Chun, K.C., R.W. Chang, G.P. Williams, Y.S. Chang, D. Tomasko, K. LaGory, J. Ditmars, H.D. Chun and B.K. Lee. 2001. Water quality issues in the Nakdong River Basin in the Republic of Korea.
Environ. Eng. Pol. 2: 131-143.
Dodds, W.K. 2006. Eutrophication and trophic state in rivers and streams. Limnol. Oceanogr. 51: 671- 680.
Dong, X., H. Bennion, R. Battarbee, X. Yang, H. Yang and E. Liu. 2008. Tracking eutrophication in Taihu Lake using the diatom record: potential and prob-
lems. J. Paleolimnol. 40: 413-429.
Fisher, T.R., J.M. Melack, J.U. Grobbelaar and R.W.
Howarth. 1995. Nutrient limitation of phytoplank- ton and eutrophication of inland, estuarine, and marine waters. p. 301-322. In: Phosphorus in the global environment (Tiessen, H. ed.). John Wiley and Sons, New York.
Gobler, C.J., T.W. Davis, K.J. Coyne and G.L. Boyer.
2007. Interactive influences of nutrient loading, zooplankton grazing, and microcystin synthetase gene expression on cyanobacterial bloom dynamics in a eutrophic New York lake. Harm. Alg. 6: 119- 133.
Guo, N. and P. Xie. 2006. Development of tolerance against toxic Microcystis aeruginosa in three clado- cerans and the ecological implications. Environ.
Pollut. 143: 513-518.
Jones, J.R., M.F. Knowlton and K.G. An. 1997. Devel- oping a paradigm to study and model the eutrophi- cation process in Korean reservoirs. Korean J. Lim- nol. 30: 463-471.
Kronvang, B., E. Jeppesen, D.J. Conley, M. Sønderg- aard, S.E. Larsen, N.B. Ovesen and J. Carstensen.
2005. Nutrient pressures and ecological responses to nutrient loading reductions in Danish streams, lakes and coastal waters. J. Hydrol. 304: 274-288.
Marshall, C.T. and R.H. Peters. 1989. General patt- erns in the seasonal development of chlorophyll a for temperate lakes. Limnol. Oceanogr. 34: 856-857.
Mitraki, C., T.L. Crisman and G. Zalidis. 2004. Lake Koronia, Greece: Shift from autotrophy to heterot- rophy with cultural eutrophication and progressive water-level reduction. Limnol.-Ecology and Mana- gement of Inland Waters 34: 110-116.
Oberholster, P.J., A.M. Botha and T.E. Cloete. 2006.
Use of molecular markers as indicators for winter zooplankton grazing on toxic benthic cyanobacteria colonies in an urban Colorado lake. Harm. Alg. 5:
705-716.
Portielje, R. and D.T. Van der Molen. 1999. Relation- ships between eutrophication variables: from nutri- ent loading to transparency. Hydrobiologia 408/
409: 375-387.
Pütz, K. and J. Benndorf. 1998. The importance of pre- reservoirs for the control of eutrophication of reser- voirs. Wat. Sci. Tech. 37: 317-324.
Redfield, A.C. 1958. The biological control of chemical factors in the environment. Amer. Sci. 46: 205-222.
Reeders, H.H., P.C.M. Boers, D.T. van der Molen and T.H. Helmerhorst. 1998. Cyanobacterial dominance in the lakes Veluwemeer and Wolderwijd, The Netherlands. Wat. Sci. Tech. 37: 85-92.
Roozen, F.C.J.M., G.J. Van Geest, B.W. Ibelings, R.
Roijackers, M. Scheffer and A.D. Buijse. 2003. Lake age and water level affect the turbidity of floodpl- ain lakes along the lower Rhine. Fresh. Biol. 48:
519-531.
Sakamoto, M. 1966. Primary production by phytopla-
nkton community in Japanese lakes and its depen- dence on lake depth. Arch. fur Hydrobiol. 62: 1-28.
Smith, V.H. 1982. The nitrogen and phosphorus depen- dence of algal biomass in lakes: An empirical and theoretical analysis. Limnol. Oceanogr. 27: 1101- 1112.
Smith, V.H. 2006. Responses of estuarine and coastal marine phytoplankton to nitrogen and phosphorus enrichment. Limnol. Oceanogr. 51: 377-384.
Sommaruga, R. 1995. Microbial and classical food webs: A visit to a hypertrophic lake. FEMS Micro- biol. Ecol. 17: 257-270.
Steinman, A., X. Chu and M. Ogdahl. 2009. Spatial and temporal variability of internal and external phosphorus loads in Mona Lake, Michigan. Aquat.
Ecol. 43: 1-18.
Straskraba, M. 1996. Ecotechnological methods for managing non-point source pollution in watersheds, lakes and reservoirs. Wat. Sci. Tech. 33: 73-80.
UNEP, 2006. Marine and coastal ecosystems and hu- man wellbeing: A synthesis report based on the findings of the Millennium Ecosystem Assessment.
United Nations Environment Programme.
Vorobieva, L.V., G.V. Selyuzhitskii and G.I. Chernova.
1996. Ecologic and hygienic evaluation of Lake Ladoga as a source of drinking water. Hydrobiol.
322: 137-141.
(Manuscript received 2 November 2009, Revision accepted 7 December 2009)