A STUDY ON THE CORRELATION BETWEEN GROUND SUBSIDENCE AREA NEAR ABANDONED UNDERGROUND
COAL MINE AND GEOPHYSICAL PROSPECTING DATA USING GIS
Ki-Dong Kim * , Jong-Kuk Choi, Joong-Sun Won
Department of Earth System Sciences, Yonsei University 134 Shinchon-dong, Seodaemun-ku, Seoul 120-749, Korea
Tel : +82-2-2123-2673 Fax: +82-2-313-2549 e-mail : [email protected]
ABSTRACT:
To estimate presumptive local ground subsidence area near Abandoned Under ground Coal Mine(AUCM) at Samcheok city in Korea, the geological properties of existing ground subsidence area and the geophysical prospecting data were analyzed using GIS. The electrical resistivity survey and seismic reflection survey database were constructed from investigation reports and factors which are related with ground subsidence such as geological map, topological map, land use map, lineament map, groundwater level, RMR (Rock Mass Rating), mining tunnel map and slope database were constructed also to make a comparative study of each parameters. As a result of the spatial analysis of existing ground subsidence area, 9 major factors causing ground subsidence were extracted and a connection between the structure of underground and the ground subsidence was determined from the analysis of geophysical prospecting data.
The estimation of presumptive ground subsidence area was performed using the correlation between the result from neural network analysis of 9 factors and the scrutiny of geophysical prospecting data.
KEY WORDS: ground subsidence, abandoned underground coal mine, geophysical prospecting data, GIS
1. INTRODUCTION
Since 1989, almost all of underground coal mines were abandoned and few are remaining, and the occurrence of ground subsidence around abandoned coal mine area has become a serious social problem in Korea recently.
However, quantitative assessment of predicted ground subsidence area is difficult especially in coal mining area where structure of geology is very complicated. To predict the probability of ground subsidence empirically with (1)intact strength of the rock, (2)stress field, (3)geological structure of the rock, (4)depth of the mining horizon, (5)areal extent of mining, and (6)volume extracted per unit area of mining was suggested within surprisingly narrow limits considering the form of the input data (Goel, 1982). The National Coal Board published a basic technique to find out estimated area of influence by ground subsidence with height of cavity, width of mined panel and inclined angle of coal seam (National Coal Board, 1975).
The prediction method for subsidence area is very dependent on a structure of local geology and coal mining method, but above empirical methods were developed under condition of horizontal coal seam and longwall working dominant in Europe. In Korea, due to the mixed structure of geology there are various widths of coal seam, irregular inclined angle of coal seam and strata and slant-chute block caving method has been
using. As a result, a sink-hole type subsidence is general therefore, another estimation method of regional ground subsidence is necessary.
Initial quantitative assessment of ground subsidence near abandoned underground coal mine at Samcheok city in Korea using GIS and Neural network analysis was conducted to predict the ground subsidence area (Kim, 2005). The purpose of this study is to perform a comparative analysis between the predicted ground subsidence area and the scrutiny of electrical resistivity and seismic reflection survey data of existing subsidence area adjacent to the predicted area using GIS at Samcheok city.
2. GEOLOGICAL SETTING
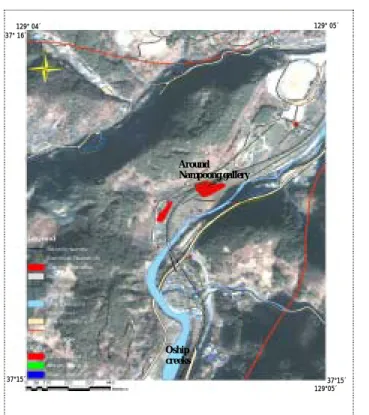
The coal resource of South Korea almost consists of anthracite and 85% of them had been deposited during the upper Paleozoic era and the lower Mesozoic era in the Jangseong Formation of the Pyeongan Supergroup (Geological Society of Korea, 1999). The study area is located around the Nampoong gallery on the Jangseong Formation. Along the study area the Oship fault, the Oship creeks, Youngdong rail road, and no. 38 local road pass by (CIPB : Coal Industry Promotion Board , 1999).
The location map and electrical resistivity survey and
seismic reflection survey lines of this study appear in
Figure 1.
Refer to above factors the image and the attribute database of existing ground subsidence area were constructed as displayed in Table 2.
129° 05´
129° 04´
37° 16´
Table 2. Constructed GIS Database Including Factors Connected with Ground Subsidence of Study Area.
Category Factors Remark
Geology Type of strata Geology
Lineaments Bufferig of fault line
DEM TIN process to get elevation data Topography
Slope Analyze slope by degree Land use Land use Classification of 12 landuse types
Depth of drift DEM minus Water level of drift Mining
Tunnel map Height of drift Disregard this factor. Almost 2.5 ~ 3m along the study area
RMR IDW Interpolated from 28 bore holes Ground water
lever IDW Interpolated from 24 bore holes Borehole
∗Permeability IDW Interpolated from 25 bore holes
∗
35 boreholes from investigation in 1999, some boreholes do not have value of relating factors.
Around Nampoong gallery
Oship creeks
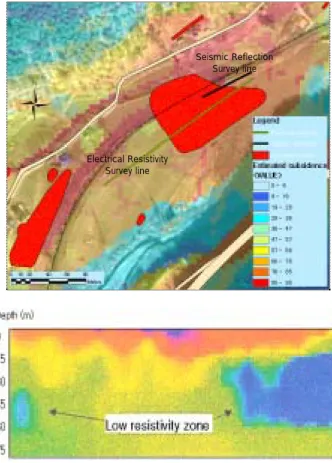
Most literatures said that major factor of ground subsidence is scope of mined cavities. Therefore, constructing database of depth and width of mined cavities is very important work during this study. To achieve the object, (1)GPS measurement was used to find out an exact position of a minehead and (2)vectorizing a hard copy of mined tunnel map with it. (3)After converting the vectorized mined tunnel map to an ASCII grid file, minus it with DEM raster data. There were 35 boreholes at the study area but some boreholes did not have values, so Inverse Distance Weighting(IDW) interpolation method was used to contour the value and reclassified it using ArcGIS. Then, weights result from neural network analysis were given to the above factors separately to produce a presumptive ground subsidence area map as shown in Figure 2 (Kim, 2005).
37°15´ 37°15´
129°05´
Figure 1. Location Map of Study Area.
3. METHOD AND DATA
This study was conducted with calculated weights from backpropagation neural network analysis and the review of seismic reflection and electrical resistivity survey data using GIS. Image database and attribute database concerning about ground subsidence were constructed and analyzed by ArcGIS. One for each line were selected among 6 electrical resistivity survey lines and 3 seismic reflection survey lines near Nampoong gallery, and the analysis of underground structure from them was compared with the ground subsidence area.
GIS Database 3.1
Many studies indicated important factors related with ground subsidence around coal mines(Waltham, 1989).
Table 1. shows factors commonly affect the sink-hole
type ground subsidence according to time (CIPB, 1997). Survey area
Table 1. Factors Affect Sink-hole Type Ground Subsidence.
Occurrence of Ground
Subsidence Progress Ground
Collapse During time after abandoned mine
z
Mechanical character of Rock mass
z
Flow of ground water
z
Structure of geology (joint, fault, dyke)
z
Caving method
z
Rate of caving
z
Back filling
z
Flow of ground water
z
Structure of geology
z
Rate of cubical expansion
z
Rate of mining
z
Mining depth
z