125
포항 지진의 진원 깊이 연구
정태웅1*·이영민2·모하메드 자파르1·정진아3
1세종대학교 에너지자원공학과
2지질자원연구원
3경북대학교 자연과학대학 지구시스템과학부
A Study of Hypocentral Depth of Pohang Earthquake
Tae Woong Chung1*, Youngmin Lee2, Muhammad Zafar Iqbal1, and Jina Jeong3
1Department of Energy & Mineral Resources Engineering, Sejong University
2Korea Institute of Geoscience and Mineral Resources (KIGAM)
3School of Earth System Sciences, College of Natural Science, Kyungpook National University
요 약: 2017년 11월 15일 포항지진(규모 5.4)은 깊이효과로 경주지진(규모 5.8) 보다 피해가 더 컸으나, 정확한 깊이가 확증되지 않고 있다. 진원 깊이를 진원재결정을 통하여 역산한 결과, 대부분의 모델의 진원 깊이가 얕은 표층으로 도출 된 반면, 지각구조가 가장 근접한 모델은 6.0 ~ 11.5 km 구간의 깊이로 산출되었다. 지온분석에서는 7.5 km 근방에서 300
oC 의 온도가 관찰되어 지진유발층의 사례에 입각한 포항지진의 진원은 근접한 모델로 얻어진 7 km 근방인 것으로 추 정되어진다.
주요어: 포항지진, 근접한 모델, 진원깊이, 지온분석, 7 km
Abstract: 2017 Pohang earthquake (M 5.4) was more disastrous than 2016 Gyeongju earthquake (M 5.8), partly because of its shallow focal depth. However, precise focal depth of Pohang earthquake is still controversial. Close crustal model showed 6 ~ 11.5 km in relocation depth, whereas other models showed almost surface range. Geothermal study indicated temperature of 300
oC at depth of 7.5 km. Related with observations of seismogenic layer, the focal depth of Pohang earthquake seems to be 7 km depth as obtained by close model.
Keywords: Pohang earthquake, close model, focal depth, geothermal study, 7 km
서 론
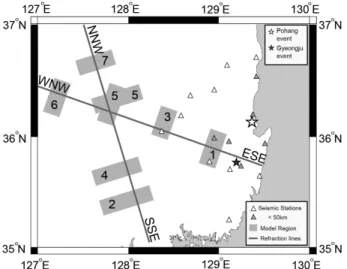
2017년 11월 15일 오후 2시 29분, 경상북도 포항시 흥해읍 남송리에서 규모 5.4의 포항지진이 발생하였다(Fig. 1). 이 지 진은 진동이 심하여 건물 외벽이 무너지고 가옥이 파손되어 천여명의 이재민이 발생하는 사태가 발생하였다. 앞서 포항지 진 남동쪽 42 km 부근에서 2016년 9월 12일 오후 8시 32분 에 규모 5.8의 경주지진(Fig. 1) 이 발생한 바 있는데, 경주지
진은 포항지진보다 규모가 컸지만 진동이 덜하여 이재민이 발 생하지는 않았다. 이러한 피해 차이는 경주지진이 암반지역에 서 발생한 반면, 포항지진은 해안 매립이 곳곳에서 이루어진 지반효과의 차이가 거론되었지만 진원의 깊이 차이도 큰 작용 을 하였으리라 여겨지고 있다. 즉, 경주지진은 진원 깊이가 15 km 이상(Chung and Iqbal, 2017)인 반면, 포항지진은 7 km로 알려지고 있다. 그런데 경주지진은 관측점이 사방에 고루 분포 되어 비교적 신뢰할만한 진원깊이인 반면, 포항지진의 깊이는 해양 방향 관측자료가 없어서 진원 결정의 신뢰성이 문제가 되고 있다. 또한, 포항지진 지역에서 때마침 운영된 이동식지 진계에 의해 진원 깊이가 7 km 보다 더 얕을 가능성이 제기 되고 있으나(김광희, 개인교신), 본진의 진폭이 포화된 관계로 확실한 해석이 안되고 있다.
이러한 피해지진이 세계도처에서 빈발하면서 대부분의 육지 지진이 발생되고 있는 지진유발층(Seismogenic Layer)에 대한 관심이 커지고 있다(e.g. Pace et al., 2006). 지진유발층은 지 각의 3 ~ 4 km 깊이의 상층부 경계와 지역에 따라 크게 변하
Received: 6 March 2018; Revised: 8 May 2018; Accepted: 8 May 2018
*Corresponding author E-mail: [email protected]
Address: Department of Energy & Mineral Resources Engineering, Sejong University, Seoul 05006, Korea
ⓒ2018, Korean Society of Earth and Exploration Geophysicists
This is an Open Access article distributed under the terms of the Creative Commons Attribution Non-Commercial License (http://creativecommons.org/
licenses/by-nc/3.0/) which permits unrestricted non-commercial use, distribution, and reproduction in any medium, provided the original work is properly cited.
단 보
는 하층부 경계에 지진의 90%가 발생하는 대륙지각의 층구조 를 일컫는다. 작은 지진은 지진유발층의 상층부에 주로 발생하 고 하층부로 갈수록 규모가 커지는 것은 잘 알려져 있으며 (e.g. Jackson and White, 1989), 미국 캘리포니아 지방의 지진 유발층에서 규모 5 이상의 중규모 지진이 깊이 9 km 경계부 이상에서 빈발한다는 것이 밝혀진 바 있다(Mori and Abercrombie, 1997).
지진유발층은 지온과 밀접한 관계가 있는 것이 관찰되고 있 는데(Bonner et al., 2003), 특히 온도 300oC는 석영 성분의 유 동성 발생으로 지각의 취성-연성 변화와 관련지어진 온도(e.g.
Hirth and Tullis) 로서 300oC 부근에서 큰 지진이 발생하는 것 으로 설명되고 있다(e.g. Sibson, 1983; Scholz, 1988). 최근 경
주지진의 경우 여진 깊이의 상한선이 12 km이고 이 상한선 깊 이는 300oC의 지온으로 해석되었다(Chung et al., 준비중).
포항지역은 한반도에서도 지열류량이 높은 지역(Kim and Lee, 2007)으로 최근까지 지열발전이 추진되었으며, 경주지진 의 12 km 깊이보다는 300oC 지온이 얕을 것으로 추정된다. 본 연구에서는 경주지진에 사용된 진원재결정 해석(Chung and Iqbal, 2017)을 통하여 포항지진의 진원 깊이에 대한 문제를 검 증하고 지온 해석을 통하여 지진유발층에 입각한 포항지진의 지온 깊이를 구명하고자 한다.
진원재결정 해석
진원재결정은 한반도 굴절파 탐사 자료(Cho et al., 2006;
2013)를 바탕으로 한 Asep and Chung (2016)의 7개의 모델에 대하여 진원깊이를 정량적인 역산으로 평가하였다. 즉, 기상청 의 국가지진종합시스템 자료(http://necis.kma.go.kr/)를 이용하 여 거리 120 km 이내의 P파와 S파의 초동을 대상으로 HYPO71 (Lee and Lahr, 1975)을 이용하여 7개의 모델에 대 하여 진원 재결정 역산을 시행하였다. 또한 추가적으로 Chang
& Baag (2006)의 남한 모델(이하 C&B모델)과 Kim et al.
(2011)의 경상분지 1차원 모델(이하 K2011모델)에 대하여서도 시행하였다(Fig. 2). HYPO71에 입력되는 S파 속도 모델은 Wadati 다이아그램(Wadati, 1933), 즉 P파 주시시간에 대한 초 기미동 지속시간의 분포에 대한 최소자승 직선의 기울기가 VP/Vs –1 임을 이용하였다(Fig. 3).
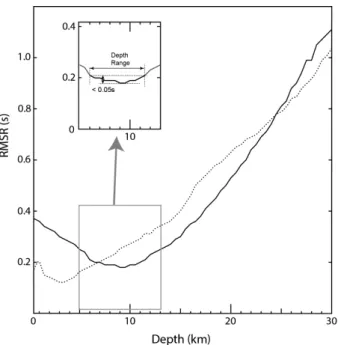
HYPO71의 깊이에 대한 신뢰도 문제(Liernert et al., 1986) 는 다음과 같이 깊이를 고정하여 진앙과 진원시를 일일이 구 하는 역산을 통하여 극복하였다. 즉, 0.5 km에서 30 km까지 의 진원 깊이를 0.5 km 간격으로 나누어 60 개의 깊이에 대하 여 HYPO71을 시행, 각 깊이에 대한 진앙과 관측값과 계산값
Fig. 1. Map showing Gyeongju earthquake, two refraction lines,
seven models, and seismic stations (Grey triangles denote stations presenting data with hypocentral range < 50 km).
Fig. 2. Velocity structure obtained from two lines (two profiles are upper and lower) in Fig. 1, showing models from 1 to 7 (diagram after Asep and Chung, 2016). Models by Chang and Baag (2006), and Kim et al. (2011) are shown as C&B and K2011, respectively.
Fig. 3. Example of Wadati diagram used to obtain for S-wave
velocity in model calculations. 17 arrival data were used.
의 주시 잔차가 최소가 되는 깊이를 조사하였다. 이러한 역산 방법은 최근 인도에서 다수의 관측망 자료를 이용하여 1 km 깊이구간으로 행해진 바 있다(Saikia et al., 2014). 인도의 연 구는 최소 잔차가 되는 하나의 깊이를 결정한 반면, 본 연구는 잔차의 범위를 고려하여 최소 잔차값과의 차이가 0.05초 이내 가 되는 좌우 잔차값 범위를 깊이의 신뢰구간으로 정하였다 (Fig. 4).
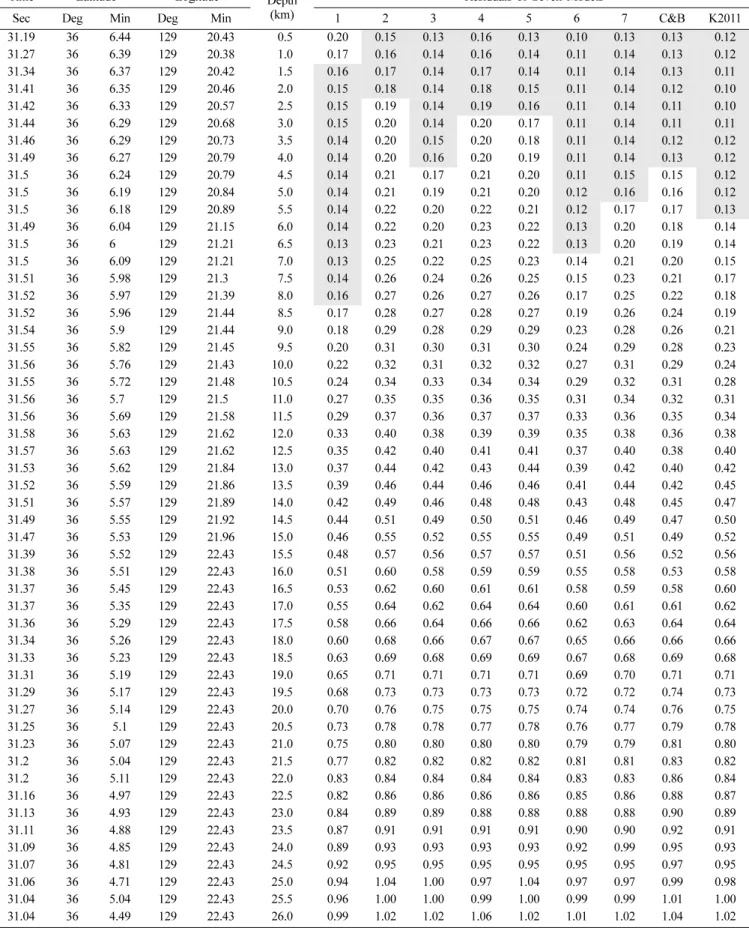
한반도 지각구조에 입각한 7모델의 최소잔차가 일정값 이상 (0.02초)으로 차이가 나지 않으면 인근 모델이 채택이 되는데, 대부분의 지진(90프로 이상)이 발생한 지역의 인근 모델이 채 택되는 것이 확인 된 바 있다(Asep and Chung, 2016). 포항지 진의 경우, 가장 근접한 모델 1 은 최소잔차가 0.18로 모델 2, 3, 5가 일정값 0.02초) 넘게 잔차가 적은 것이 확인되었다. 그 러나, 이 세 모델은 표층(0.5 km)에서 최소잔차의 진원깊이가 구해져서 타당하지 않은 결과이다. C&B모델과 K2011모델도 각각 3 km, 4 km로 매우 얕은 곳에 구하여졌다. 반면에 지진 에 가까운 모델 1 의 최소잔차는 깊이 9.0, 9.5 km에서 0.18이 고 0.05초 이내의 잔차범위가 6.0 ~ 11.5 km인 결과가 제시되 었다(Table 1). 50 km 이내의 여섯 관측점만을 사용한 경우는 모델 1 이외의 모든 값이 표층에 진원깊이 범위가 구해졌다
Fig. 4. Example showing residuals for model 1 (solid) and Chang
and Baag (2006)’s model (dotted) shown in Table 1. The inset indicates focal depth uncertainty (depth range) of model 1, the residuals of which is selected as less than the minimum value plus 0.05.
Table 1. Inversed parameters of Pohang earthquake. Epicenters with origin time (sec) is obtained from model 1. Residuals are compared for model 1 ~ 7, Chang and Baag (20006), and Kim et al. (2011). Grey color regions denote the depth range (Fig. 4).
Time Latitude Logitude Depth
(km)
Residuals of Seven Models
Sec Deg Min Deg Min 1 2 3 4 5 6 7
31.19 36 6.44 129 20.43 00.5 0.37 0.15 0.15 0.16 0.14 0.17 0.16
31.27 36 6.39 129 20.38 01.0 0.36 0.16 0.15 0.17 0.15 0.17 0.16
31.34 36 6.37 129 20.42 01.5 0.34 0.17 0.15 0.18 0.16 0.17 0.16
31.41 36 6.35 129 20.46 02.0 0.33 0.18 0.15 0.18 0.16 0.17 0.16
31.42 36 6.33 129 20.57 02.5 0.32 0.19 0.15 0.19 0.17 0.17 0.16
31.44 36 6.29 129 20.68 03.0 0.30 0.20 0.15 0.20 0.18 0.17 0.16
31.46 36 6.29 129 20.73 03.5 0.29 0.20 0.16 0.20 0.18 0.17 0.15
31.49 36 6.27 129 20.79 04.0 0.28 0.20 0.17 0.20 0.19 0.17 0.15
31.50 36 6.24 129 20.79 04.5 0.27 0.20 0.18 0.20 0.20 0.17 0.16
31.50 36 6.19 129 20.84 05.0 0.25 0.21 0.19 0.21 0.20 0.17 0.17
31.50 36 6.18 129 20.89 05.5 0.24 0.21 0.19 0.21 0.20 0.16 0.18
31.49 36 6.04 129 21.15 06.0 0.21 0.21 0.19 0.21 0.21 0.16 0.19
31.50 36 600. 129 21.21 06.5 0.20 0.21 0.20 0.22 0.21 0.16 0.19
31.50 36 6.09 129 21.21 07.0 0.20 0.22 0.20 0.22 0.21 0.16 0.20
31.51 36 5.98 129 21.30 07.5 0.19 0.22 0.21 0.22 0.22 0.18 0.20
31.52 36 5.97 129 21.39 08.0 0.19 0.26 0.21 0.23 0.22 0.18 0.21
31.52 36 5.96 129 21.44 08.5 0.19 0.26 0.22 0.23 0.23 0.17 0.21
31.54 36 5.90 129 21.44 09.0 0.18 0.26 0.22 0.24 0.26 0.20 0.22
31.55 36 5.82 129 21.45 09.5 0.18 0.27 0.23 0.27 0.26 0.19 0.22
31.56 36 5.76 129 21.43 10.0 0.19 0.27 0.26 0.27 0.27 0.21 0.24
31.55 36 5.72 129 21.48 10.5 0.19 0.27 0.26 0.28 0.27 0.22 0.24
31.56 36 5.70 129 21.50 11.0 0.20 0.28 0.27 0.28 0.28 0.23 0.25
31.56 36 5.69 129 21.58 11.5 0.21 0.28 0.27 0.29 0.28 0.23 0.25
31.58 36 5.63 129 21.62 12.0 0.23 0.29 0.28 0.29 0.29 0.24 0.28
31.57 36 5.63 129 21.62 12.5 0.24 0.31 0.29 0.30 0.30 0.25 0.28
31.53 36 5.62 129 21.84 13.0 0.25 0.32 0.29 0.30 0.31 0.27 0.29
(Table 2).
지열 해석
포항 지진이 발생한 지역의 지중 온도 (T) 분포를 규명하기 위해 다음과 같은 1차원 수치 모델링을 수행하였다(식 1).
(1)
여기서 T 는 깊이 x의 온도, λ는 열전도도, A는 열생산율을 나타낸다. 수치모델링의 입력 자료는 포항 지진의 진앙을 중심 으로 반경 약 10 km 이내의 퇴적암과 화강암의 열전도도, 열 생산율, 지열류량 자료를 수집하여(http://kgris.kigam.re.kr) 각 자료의 평균과 표준오차(standard error)를 구하여 각 자료의
최소값(Mean − Standard Error)과 최대값(Mean + Standard Error)을 구하여 평균 지중온도와 최대 및 최소 지중온도 산출 에 사용하였다(Table 3). 지중온도 계산에 사용된 지열류량, 열 전도도, 열생산율 자료의 측정 방법은 Kim and Lee (2007)에 의하여 자세히 기술되었다. 그리고 제3기 퇴적암과 백악기 기 반암의 경계는 과거의 시추 자료를 이용하여 결정된 217 m를 사용하여 두 개의 지층으로 구성된 모델을 사용하였다(Ahn et al., 2015). 산출된 평균 지중 온도는 평균 지열류량, 평균 열전 도도, 평균 열생산율을 사용하여 계산 되었고, 최소 지중 온도 의 계산에는 최소 지열류량, 최대 열전도도, 최소 열생산율을 사용하였으며, 최대 지중 온도는 최대 지열류량, 최소 열전도 도, 최대 열생산율을 사용하여 계산 되었다.
그 결과, 깊이에 따른 분포곡선(Fig. 4)에서 7.5 km 깊이에 서 300oC 온도가 구해졌다. 그리고 최소와 최대 지열자료를
∂x∂ --- λ ∂T
---∂x
⎝ ⎠
⎛ ⎞ + A = 0
Table 1. Continued.
Time Latitude Logitude Depth
(km)
Residuals of Seven Models
Sec Deg Min Deg Min 1 2 3 4 5 6 7
31.52 36 5.59 129 21.86 13.5 0.26 0.33 0.30 0.32 0.32 0.28 0.30
31.51 36 5.57 129 21.89 14.0 0.27 0.33 0.31 0.33 0.33 0.29 0.30
31.49 36 5.55 129 21.92 14.5 0.29 0.35 0.32 0.34 0.34 0.30 0.32
31.47 36 5.53 129 21.96 15.0 0.30 0.36 0.34 0.35 0.35 0.31 0.33
31.39 36 5.52 129 22.43 15.5 0.33 0.36 0.36 0.36 0.37 0.34 0.34
31.38 36 5.51 129 22.43 16.0 0.35 0.37 0.37 0.37 0.37 0.35 0.36
31.37 36 5.45 129 22.43 16.5 0.36 0.39 0.38 0.38 0.39 0.37 0.37
31.37 36 5.35 129 22.43 17.0 0.38 0.40 0.39 0.40 0.40 0.38 0.38
31.36 36 5.29 129 22.43 17.5 0.41 0.42 0.41 0.41 0.41 0.39 0.39
31.34 36 5.26 129 22.43 18.0 0.43 0.42 0.42 0.43 0.43 0.41 0.41
31.33 36 5.23 129 22.43 18.5 0.45 0.44 0.43 0.43 0.44 0.43 0.42
31.31 36 5.19 129 22.43 19.0 0.48 0.45 0.45 0.45 0.45 0.44 0.44
31.29 36 5.17 129 22.43 19.5 0.50 0.47 0.47 0.47 0.47 0.46 0.45
31.27 36 5.14 129 22.43 20.0 0.53 0.48 0.49 0.48 0.48 0.48 0.47
31.25 36 5.10 129 22.43 20.5 0.55 0.50 0.51 0.50 0.50 0.50 0.49
31.23 36 5.07 129 22.43 21.0 0.58 0.51 0.53 0.51 0.51 0.51 0.50
31.20 36 5.04 129 22.43 21.5 0.60 0.53 0.55 0.53 0.53 0.53 0.51
31.20 36 5.11 129 22.43 22.0 0.64 0.55 0.58 0.55 0.55 0.55 0.53
31.16 36 4.97 129 22.43 22.5 0.66 0.57 0.61 0.57 0.57 0.57 0.55
31.13 36 4.93 129 22.43 23.0 0.69 0.58 0.64 0.58 0.58 0.59 0.57
31.11 36 4.88 129 22.43 23.5 0.71 0.60 0.66 0.60 0.60 0.61 0.59
31.09 36 4.85 129 22.43 24.0 0.74 0.62 0.69 0.62 0.62 0.63 0.63
31.07 36 4.81 129 22.43 24.5 0.78 0.64 0.72 0.64 0.64 0.65 0.65
31.06 36 4.71 129 22.43 25.0 0.81 0.69 0.75 0.67 0.69 0.67 0.67
31.04 36 5.04 129 22.43 25.5 0.83 0.69 0.78 0.69 0.69 0.69 0.69
31.04 36 4.49 129 22.43 26.0 0.88 0.72 0.81 0.74 0.72 0.72 0.72
31.01 36 4.84 129 22.43 26.5 0.90 0.74 0.83 0.73 0.74 0.74 0.75
31.01 36 4.73 129 22.43 27.0 0.94 0.76 0.86 0.76 0.77 0.78 0.78
31.03 36 4.13 129 22.43 27.5 0.99 0.79 0.88 0.78 0.79 0.81 0.81
31.09 36 4.02 129 22.43 28.0 0.99 0.82 0.91 0.82 0.82 0.83 0.84
31.04 36 400. 129 22.43 28.5 1.05 0.85 0.94 0.84 0.85 0.86 0.87
31.03 36 3.97 129 22.43 29.0 1.07 0.87 0.97 0.87 0.88 0.89 0.89
31.02 36 3.95 129 22.43 29.5 1.09 0.90 1.01 0.89 0.90 0.92 0.92
3100. 36 3.92 129 22.43 30.0 1.11 0.92 1.04 0.92 0.93 0.98 0.95
Table 2. Inversed parameters of Pohang earthquake based on near stations with hypocentral range within 50 km. Parameters are the same with Table 1.
Time Latitude Logitude Depth
(km)
Residuals of Seven Models
Sec Deg Min Deg Min 1 2 3 4 5 6 7 C&B K2011
31.19 36 6.44 129 20.43 00.5 0.20 0.15 0.13 0.16 0.13 0.10 0.13 0.13 0.12
31.27 36 6.39 129 20.38 01.0 0.17 0.16 0.14 0.16 0.14 0.11 0.14 0.13 0.12
31.34 36 6.37 129 20.42 01.5 0.16 0.17 0.14 0.17 0.14 0.11 0.14 0.13 0.11
31.41 36 6.35 129 20.46 02.0 0.15 0.18 0.14 0.18 0.15 0.11 0.14 0.12 0.10
31.42 36 6.33 129 20.57 02.5 0.15 0.19 0.14 0.19 0.16 0.11 0.14 0.11 0.10
31.44 36 6.29 129 20.68 03.0 0.15 0.20 0.14 0.20 0.17 0.11 0.14 0.11 0.11
31.46 36 6.29 129 20.73 03.5 0.14 0.20 0.15 0.20 0.18 0.11 0.14 0.12 0.12
31.49 36 6.27 129 20.79 04.0 0.14 0.20 0.16 0.20 0.19 0.11 0.14 0.13 0.12
31.50 36 6.24 129 20.79 04.5 0.14 0.21 0.17 0.21 0.20 0.11 0.15 0.15 0.12
31.50 36 6.19 129 20.84 05.0 0.14 0.21 0.19 0.21 0.20 0.12 0.16 0.16 0.12
31.50 36 6.18 129 20.89 05.5 0.14 0.22 0.20 0.22 0.21 0.12 0.17 0.17 0.13
31.49 36 6.04 129 21.15 06.0 0.14 0.22 0.20 0.23 0.22 0.13 0.20 0.18 0.14
31.50 36 600. 129 21.21 06.5 0.13 0.23 0.21 0.23 0.22 0.13 0.20 0.19 0.14
31.50 36 6.09 129 21.21 07.0 0.13 0.25 0.22 0.25 0.23 0.14 0.21 0.20 0.15
31.51 36 5.98 129 21.30 07.5 0.14 0.26 0.24 0.26 0.25 0.15 0.23 0.21 0.17
31.52 36 5.97 129 21.39 08.0 0.16 0.27 0.26 0.27 0.26 0.17 0.25 0.22 0.18
31.52 36 5.96 129 21.44 08.5 0.17 0.28 0.27 0.28 0.27 0.19 0.26 0.24 0.19
31.54 36 5.90 129 21.44 09.0 0.18 0.29 0.28 0.29 0.29 0.23 0.28 0.26 0.21
31.55 36 5.82 129 21.45 09.5 0.20 0.31 0.30 0.31 0.30 0.24 0.29 0.28 0.23
31.56 36 5.76 129 21.43 10.0 0.22 0.32 0.31 0.32 0.32 0.27 0.31 0.29 0.24
31.55 36 5.72 129 21.48 10.5 0.24 0.34 0.33 0.34 0.34 0.29 0.32 0.31 0.28
31.56 36 5.70 129 21.50 11.0 0.27 0.35 0.35 0.36 0.35 0.31 0.34 0.32 0.31
31.56 36 5.69 129 21.58 11.5 0.29 0.37 0.36 0.37 0.37 0.33 0.36 0.35 0.34
31.58 36 5.63 129 21.62 12.0 0.33 0.40 0.38 0.39 0.39 0.35 0.38 0.36 0.38
31.57 36 5.63 129 21.62 12.5 0.35 0.42 0.40 0.41 0.41 0.37 0.40 0.38 0.40
31.53 36 5.62 129 21.84 13.0 0.37 0.44 0.42 0.43 0.44 0.39 0.42 0.40 0.42
31.52 36 5.59 129 21.86 13.5 0.39 0.46 0.44 0.46 0.46 0.41 0.44 0.42 0.45
31.51 36 5.57 129 21.89 14.0 0.42 0.49 0.46 0.48 0.48 0.43 0.48 0.45 0.47
31.49 36 5.55 129 21.92 14.5 0.44 0.51 0.49 0.50 0.51 0.46 0.49 0.47 0.50
31.47 36 5.53 129 21.96 15.0 0.46 0.55 0.52 0.55 0.55 0.49 0.51 0.49 0.52
31.39 36 5.52 129 22.43 15.5 0.48 0.57 0.56 0.57 0.57 0.51 0.56 0.52 0.56
31.38 36 5.51 129 22.43 16.0 0.51 0.60 0.58 0.59 0.59 0.55 0.58 0.53 0.58
31.37 36 5.45 129 22.43 16.5 0.53 0.62 0.60 0.61 0.61 0.58 0.59 0.58 0.60
31.37 36 5.35 129 22.43 17.0 0.55 0.64 0.62 0.64 0.64 0.60 0.61 0.61 0.62
31.36 36 5.29 129 22.43 17.5 0.58 0.66 0.64 0.66 0.66 0.62 0.63 0.64 0.64
31.34 36 5.26 129 22.43 18.0 0.60 0.68 0.66 0.67 0.67 0.65 0.66 0.66 0.66
31.33 36 5.23 129 22.43 18.5 0.63 0.69 0.68 0.69 0.69 0.67 0.68 0.69 0.68
31.31 36 5.19 129 22.43 19.0 0.65 0.71 0.71 0.71 0.71 0.69 0.70 0.71 0.71
31.29 36 5.17 129 22.43 19.5 0.68 0.73 0.73 0.73 0.73 0.72 0.72 0.74 0.73
31.27 36 5.14 129 22.43 20.0 0.70 0.76 0.75 0.75 0.75 0.74 0.74 0.76 0.75
31.25 36 5.1 129 22.43 20.5 0.73 0.78 0.78 0.77 0.78 0.76 0.77 0.79 0.78
31.23 36 5.07 129 22.43 21.0 0.75 0.80 0.80 0.80 0.80 0.79 0.79 0.81 0.80
31.20 36 5.04 129 22.43 21.5 0.77 0.82 0.82 0.82 0.82 0.81 0.81 0.83 0.82
31.20 36 5.11 129 22.43 22.0 0.83 0.84 0.84 0.84 0.84 0.83 0.83 0.86 0.84
31.16 36 4.97 129 22.43 22.5 0.82 0.86 0.86 0.86 0.86 0.85 0.86 0.88 0.87
31.13 36 4.93 129 22.43 23.0 0.84 0.89 0.89 0.88 0.88 0.88 0.88 0.90 0.89
31.11 36 4.88 129 22.43 23.5 0.87 0.91 0.91 0.91 0.91 0.90 0.90 0.92 0.91
31.09 36 4.85 129 22.43 24.0 0.89 0.93 0.93 0.93 0.93 0.92 0.99 0.95 0.93
31.07 36 4.81 129 22.43 24.5 0.92 0.95 0.95 0.95 0.95 0.95 0.95 0.97 0.95
31.06 36 4.71 129 22.43 25.0 0.94 1.04 1.00 0.97 1.04 0.97 0.97 0.99 0.98
31.04 36 5.04 129 22.43 25.5 0.96 1.00 1.00 0.99 1.00 0.99 0.99 1.01 1.00
31.04 36 4.49 129 22.43 26.0 0.99 1.02 1.02 1.06 1.02 1.01 1.02 1.04 1.02
(지열류량, 열전도도, 열생산율) 이용하여 산출된 7.5 km 깊이 에서의 최소 온도는 277oC이며 최대 온도는 331oC이다.
토의 및 결론
9가지 지각구조 모델에서 C&B모델이 최소잔차를 보였다.
Asep and Chung (2016)의 모델이 잔차가 크게 나온 것은 진 원지역이 Asep and Chung (2016)의 모델 영역에서 벗어나 있 는데다가 Cho et al. (2006)의 모델에서 시사된 바, 급격한 해
안지각으로의 변형이 예상되는 지역이기 때문인 것으로 여겨 진다. 그러나, 포항지역에 지리적으로 가장 근접한 모델 1 이 외의 8 모델의 진원깊이가 4 km보다 얕은데다가 50 km 이내 의 관측값은 더욱 얕은 범위에 머물러 타당하지 않은 것으로 판단된다. 이와같이 모델 1의 최소잔차가 큰 것과 다른 모델 깊이가 타당하지 않게 도출되는 문제점은 해양쪽 방향의 관측 점 자료가 없는 관계로 판단된다. 향후 관측점 가까이에 설치 되었던 이동식지진계 자료의 처리가 진행되면 보다 정확한 깊 이가 얻어질 것이며, 이 연구 결과의 모델 의존성이 입증될 것 으로 기대된다. 한편, 진원 깊이에 대한 다른 지구물리학적인 정보로 지온 조사를 행한 결과, 진원깊이 7 km 근방에서 300oC 온도가 도출되었다. 지진유발층에서 관찰되어 온 자연 지진의 온도 연관성에 비추어 포항지진의 진원 깊이는 여타모 델에서 제시된 지표부근이 아니라 모델 1에서 제시된 7 km 근 방이 타당할 것으로 사료된다.
감사의 글
본 연구는 기상산업진흥원 KMIPA2015-7080의 지원으로 이루어졌음을 밝힙니다.
References
Ahn, H.-S., Park, J.-Y., Kim, J.-M., and Kim, J.-C., 2015, Three-dimensional geologic modeling of the Pohang Basin distributed in Haedo-Dong, Pohang-Si, J. Geol. Soc. Korea, 51, 21-36 (in Korean with English abstract).
Asep, N. R., and Chung, T. W., 2016, Depth dependent crustal scattering attenuation revealed by using single or few events
Table 2. Continued.
Time Latitude Logitude Depth
(km)
Residuals of Seven Models
Sec Deg Min Deg Min 1 2 3 4 5 6 7 C&B K2011
31.01 36 4.84 129 22.43 26.5 1.01 1.04 1.05 1.04 1.04 1.03 1.04 1.06 1.04
31.01 36 4.73 129 22.43 27.0 1.04 1.06 1.07 1.06 1.13 1.06 1.11 1.08 1.06
31.03 36 4.13 129 22.43 27.5 1.07 1.09 1.09 1.08 1.09 1.08 1.08 1.10 1.09
31.09 36 4.02 129 22.43 28.0 1.10 1.18 1.12 1.17 1.11 1.10 1.11 1.12 1.11
31.04 36 400. 129 22.43 28.5 1.14 1.13 1.14 1.13 1.13 1.12 1.13 1.15 1.13
31.03 36 3.97 129 22.43 29.0 1.17 1.15 1.16 1.15 1.15 1.15 1.15 1.17 1.15
31.02 36 3.95 129 22.43 29.5 1.19 1.18 1.18 1.17 1.18 1.17 1.17 1.19 1.17
3100. 36 3.92 129 22.43 30.0 1.24 1.20 1.20 1.20 1.20 1.23 1.20 1.21 1.20
Table 3. Heat flow, thermal conductivity, and heat production in the Pohang earthquake site.
Heat flow (mw/m
2) Thermal conductivity (W/mK) Heat production (µW/m
3) Tertiary rocks Cretaceous rocks Tertiary rocks Cretaceous rocks
Minimum 109.7 2.94 2.70 1.39 1.92
Maximum 119.1 3.26 3.04 1.97 2.50
Mean 114.4 3.10 2.87 1.68 2.21
Fig. 5. Minimum, maximum and mean temperature-depth curves in
the Pohang earthquake site.
in South Korea, Bull. Seismol. Soc. Amer., 106, 1499-1508.
Asep, N. R., Chung, T. W., Yoshimoto, K., and Son, B., 2015, Separation of intrinsic and scattering attenuation using single event source in South Korea. Bull. Seismol. Soc. Amer., 105, 858-872.
Bonner, J. L., Blackwell, D. D., and Herrin, E. T., 2003, Thermal constraints on earthquake depths in California, Bull. Seismol.
Soc. Amer., 93, 2333-2354.
Chang, S.-J., and Baag, C.-E., 2006, Crustal structure in southern Korea from joint analysis of regional broadband waveforms and travel times, Bull. Seismol. Soc. Amer., 96, 856-870.
Cho, H.-M., Baag, C.-E., Lee, J. M., Moon, W. M., Jung, H., Kim, K. Y., and Asudeh, I., 2006, Crustal velocity structure across the southern Korean Peninsula from seismic refraction survey, Geophys. Res. Lett., 33, L06307.
Cho, H.-M., Baag, C.-E., Lee, J. M., Moon, W. M., Jung, H., and Kim, K. Y., 2013, P and S-wave velocity model along crustal scale refraction and wide-angle reflection profile in the southern Korean peninsula, Tectonophysics, 582, 84-100.
Chung, T. W., and Asep, N. R., 2014, Multiple lapse time window analysis of the Korean Peninsula with considering focal depth, Geophys. and Geophys. Explor., 16, 293-299 (in Korean with English abstract).
Chung, T. W., and Iqbal, M. Z., 2017, Hypocentral depth determination of Gyeongju earthquake aftershock sequence, Geophys. and Geophys. Explor., 20, 1-7 (in Korean with English abstract).
Hirth, G., and Tullis, J., 1994, The brittle-plastic transition in experimentally deformed quartz aggregates, J. Geophys. Res., 99, 11731-11747.
Jackson, J. A., and White, N. J., 1989, Normal faulting in the upper continental crust: observations from regions of active
extension, J. Struct. Geol., 11, 15-32.
Kim, H. J., and Lee, Y., 2007, Heat flow in the Republic of Korea, J. Geophys. Res., 112, B05413.
Kim, S., Rhie, J., and Kim, G., 2011, Forward waveform modelling procedure for 1-D crustal velocity structure and its application to the southern Korean Peninsula, Geophys. J.
Int., 185, 453-468.
Lee, W. H. K., and Lahr, J. C., 1975, HYPO71 (Revised): A computer program for determining hypocenter, magnitude, and first motion pattern of local earthquakes, U. S. Geological Survey Open File Report, 75-311, 1-113.
Liernert, B. R., Berg, E., and Frazer, L. N., 1986, HYPOCENTER:
An earthquake location method using centered, scaled, and adaptively least squares, Bull. Seismol. Soc. Amer., 76, 771- 783.
Mori, J., and Abercrombie, R. E., 1997, Depth dependence of earthqake frequency-magnitude distributions in California:
Implication for rupture initiation, J. Geophys. Res., 102, 15081-15090.
Pace, B., Peruzza, L., Lavecchia, G., and Boncio, P., 2006, Layered Seismogenic Source Model and Probabilistic Seismic- Hazard, Bull. Seismol. Soc. Amer., 96, 107-132.
Saikia, U., Rai, S. S., Subrahmanyam, M., Dutta, S., Bose, S., Borah, K., and Meena, R., 2014, Accurate location and focal mechanism of small earthquakes near Idukki Reservoir, Kerala: implication for earthquake genesis, Current Science, 107, 1885-1891.
Scholz, C. H., 1988, The brittle-plastic transition and the depth of seismic faulting, Geol. Rundsch., 77, 319-328.
Sibson, R. H., 1983, Continental fault structure and the shallow earthquake source, J. Geol. Soc. London, 140, 741-767.
Wadati, K., 1933, On the travel time of earthquake waves (part II), Geophysical Magazine, 7, 101-111.