Association of FASN and SCD genes with fatty acid composition in broilers
Dyah Maharani1,2, Dong-Won Seo1, Nu-Ri Choi1, Shil Jin1, Muhammad Cahyadi1, Cheorun Jo1, Jun-Heon Lee1*
1Department of Animal Science and Biotechnology, Chungnam National University, Daejeon 305-764, Korea
2Faculty of Animal Science, Gadjah Mada University, Yogyakarta-55281, Indonesia
Received on 5 June 2013, revised on 1 August 2013, accepted on 2 August 2013
Abstract : Fatty acids (FAs) were considered in activating nuclear hormone receptors that play significant roles in the cellular lipid metabolism by the regulation of several genes. Previously, fatty acid synthase (FASN) and stearoyl-CoA desaturase (SCD) genes have been known to regulating the FA metabolism. In this study, associations of FASN and SCD genes with fatty acid (FA) composition in broilers were investigated. Tissue samples from 95 Cobb 500 broilers were used for DNA extraction. The g.1222 A>G SNP located in intron 42 of FASN gene and 2 SNPs in SCD gene, one in exon 2 (g.3728A>G) and the other in exon 4 (g.12903G>A), were subjected for genotyping using PCR-RFLP method. One of the SNPs in SCD gene, SNP g.3728A>G had significant association with myristoleic acid (C14:1; P<0.05), palmitic acid (C16:0; P<0.05), palmitoleic acid (C16:1; P<0.05) and saturated FA (SFA; P<0.05). However, the SNP g.1222A>G in FASN gene had only suggestive association with arachidic acid (C20:0; P=0.08). The findings in this study suggest that the SNP in exon 2 of SCD gene can be used as a molecular marker for selecting birds having desirable FA composition in broilers.
Key words : Broiler, FASN, Fatty acid composition, SCD
*Corresponding author: Tel: +82-42-821-5779 E-mail address: [email protected]
I. Introduction
The study investigating fat including fatty acid (FA) composition in meat is becoming more important because FAs are considered as the valuable com- ponents of meat that gives a large impact on human health. Chicken meat was considered having low saturated FA (SFA) and high polyunsaturated FA (PUFA), especially it has more in long-chain omega 3 PUFA eicosapentaenoic and docosahexaenoic acids than beef (Almeida et al., 2006). The high intake of polyunsaturated FA (PUFA) and monounsaturated FA (MUFA) can increase hepatic low density lipoprotein (LDL) receptor activity, which leads to the decrease in the circulating concentration of LDL cholesterol (Woolett et al., 1992). The diet replacement from red meat to the chicken meat was considered in decreasing
apolipoprotein B and total cholesterol levels in microalbuminuric (Gross et al., 2002). This may due to the different PUFA contents between chicken meat and red meat, which is the case of beef. Therefore, recently, the replacement of red meat with chicken (white) meat is becoming popular due to consumers’
demands for having healthy foods.
To produce and select the animals having desirable FA composition in meat, marker-assisted selection has been applied in breeding purpose by direct selection of genes that affect to meat quality. FASN gene is the multifunctional protein that plays important role in the biosynthesis of long-chain fatty acids. Therefore, this gene is widely used to study the associations with fatty acid composition in various species. The FASN gene has seven active sites that help to catalyze all the reaction steps in the conversion of acetyl-CoA and malonyl-CoA to palmitate (Royet al., 2005). Several reports indicated that the mutations in FASN gene were associated with
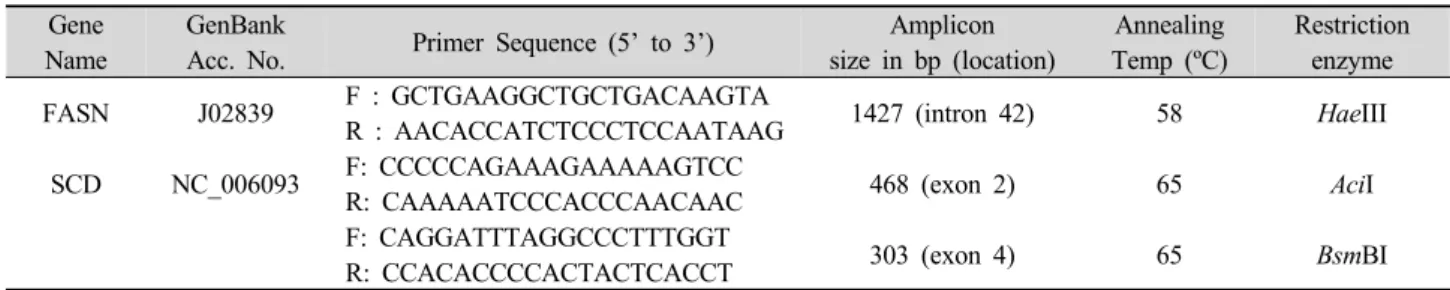
Table 1. Primers for PCR amplification and restriction enzyme information for genotyping of FASN and SCD genes in broiler chicken.
Gene Name
GenBank
Acc. No. Primer Sequence (5’ to 3’) Amplicon size in bp (location)
Annealing Temp (ºC)
Restriction enzyme
FASN J02839 F : GCTGAAGGCTGCTGACAAGTA
R : AACACCATCTCCCTCCAATAAG 1427 (intron 42) 58 HaeIII
SCD NC_006093 F: CCCCCAGAAAGAAAAAGTCC
R: CAAAAATCCCACCCAACAAC 468 (exon 2) 65 AciI
F: CAGGATTTAGGCCCTTTGGT
R: CCACACCCCACTACTCACCT 303 (exon 4) 65 BsmBI
fatty acid composition in cattle and pig (Bhuiyan et al., 2009; Lee et al., 2010; Zhang et al., 2008). Also, the polymorphisms in chicken FASN gene have been reported by Marrube et al. (2004) and this gene is located on chromosome 18 and had three TE domains in exons 40, 41 and 42 (Kasturi et al., 1988).
The SCD gene is encoding an enzyme that catalyzes the conversion of SFA into MUFA in mammalian adipocytes (Taniguchi et al., 2004) and catalyzes the delta (△) 9 desaturation of SFA and MUFA (Ohsakiet al., 2009). This SCD also contributes the synthesis of UFAs by insertion of a cis-double bond in the delta 9 position of FA substrate (Kim and Ntambi, 1999). This SCD gene has been extensively studied in cattle, compared with pig and chicken. The results indicated that this SCD gene has been linked to fatty acid composition in cattle (Matsuhashi et al., 2010; Ohsaki et al., 2009; Taniguchi et al., 2004). In pigs, the recent study reported the SCD gene was strongly affected in FA composition and melting point (Uemoto et al., 2010). However, none of study has been reported the polymorphisms of FASN and SCD gene and their associations with fatty acid composition in chicken.
Therefore, this study aimed to identify the relationships between the polymorphisms in both FASN and SCD genes with fatty acid compositions in broilers.
II. Materials and Methods
1. Animals and samples
Ninety five Cobb 500 broilers were used in this study. They were reared under the same feeding
conditions until 28 days of age which had approxi- mately 1.6 kg of slaughter weight. Tissues from thigh muscle were used for genomic DNA isolation and FA composition analysis.
2. FA analyses
Total lipids in each sample were extracted using chloroform-methanol (2:1, v/v) according to the pro- cedure of Folch et al. (1957). FA methyl esters were prepared from the extracted lipids with BF3-methanol (Sigma-Aldrich, St. Louis, MO, USA) and separated on a HP-6890N gas chromatograph (Hewlett-Packard, Palo Alto, CA, USA) as described previously (Jeon et al., 2010). A split inlet (split ratio, 50:1) was used to inject samples into a 30 m × 0.25 mm × 0.25 μm Omegawax 320 capillary column (Supelco, Bellefonte, PA, USA). The oven temperature regimen consisted of 150℃ for 3 min, an increase to 180℃ at 2.5℃ /min, 180℃ for 5 min, an increase to 220℃ at 2.5℃ /min, and 220℃ for 25 min. The inlet temperature was 210℃.
Air was the carrier gas at a constant flow of 0.7 mL/min.
3. DNA extraction and genotyping
Genomic DNAs were extracted from muscle samples and isolated by 20 mg/ml proteinase K digestion followed by phenol extraction. Primers and polymerase chain reaction (PCR) information for the FASN and SCD genes were shown in Table 1. The PCR mixture contained 50 ng genomic DNA, 10X buffer mix and 10 mM dNTPs (GenetBio, Daejeon, Korea). Amplifications
Table 2. Fatty acid composition in broiler chicken.
Trait Mean SD
Myristic acid (C14:0) Myristolenic acid (C14:1) Palmitic acid (C16:0) Palmitoleic acid (C16:1) Stearic acid (C18:0) Oleic acid (C18:1) Linoleic acid (C18:2) α Linolenic acid (C18:3) Arachidic acid (C20:0) Arachidonic acid (C20:4) Docosahexaenoic acid (C22:6) SFA1
MUFA2 PUFA3
0.89 0.19 24.27 4.58 10.74 37.62 16.90 0.64 0.09 3.49 0.54 36.00 42.41 21.59
0.18 0.07 1.13 1.07 2.53 3.59 1.54 0.15 0.03 1.33 0.21 3.07 4.46 2.72 SD is standard deviation of percentage fatty acid composition.
The superscripts 1, 2, 3 were total of saturated fatty acid (SFA), monounsaturated fatty acid (MUFA) and polyunsaturated fatty acid (PUFA), respectively.
were performed for 10 min at 94℃, 35 cycles of 30 s at 94℃, 30 s at the annealing temperature, and 30 s at 72℃, and a final extension of 10 min at 72℃ using either a GeneAmp PCR system 2700 (Applied Biosystems, Franklin Lakes, NJ, USA) or a C1000TM Thermal Cycler (BioRad Laboratories, Hercules, CA, USA). The PCR products were visualized in 1.5% standard agarose gels stained with ethidium bromide (GenetBio). Each PCR fragment was purified using an AccuPrep PCR Purification Kit (Bioneer, Daejeon, Korea). Purified PCR products were sequenced using the same primers for PCR reaction in a model 3730 XL automated DNA Sequencer (Applied Biosystems). The DNA sequences were analyzed with the BioEdit program ver. 7.00 (Tom Hall, Ibis Therapeutics, California, USA) and the single nucleotide polymorphisms (SNPs) were confirmed based on the electrophoregram results. The SNPs in FASN and SCD genes were genotyped by the PCR-restriction fragment length polymorphism (PCR-RFLP) method (Table 1). The restriction enzyme digestion was performed in 20 µl reaction volumes with approximately 15 µl of PCR products and 2 units of each restriction enzyme. The digested products were run on 3% agarose gels.
4. Statistical analysis
The effects of FASN and SCD genotypes on FA composition traits were tested using the general linear model (GLM) in the SPSS ver. 17.0 program (SPSS, Chicago, IL, USA). In order to test the pair wise differences between the effects of genotypes, Tukey’s test was also performed. The following model was used to test the association of the genotype with FAs composition:
Yi = µ + Gi + εi
Where, Y is the phenotypic data (FA composition) of sample i, µ is the overall mean, G is the genotype effect of sample i and ε is a random error.
III. Results and Discussion
1. Phenotypic profile
Table 2 shows the descriptive statistics for fatty acid composition in broiler chicken. Fourteen FAs including total SFA, PUFA and MUFA were detected in each sample. Total SFA contained four FAs, namely
Fig. 1. PCR-RFLP genotyping results for the FASN (A) and SCD(B) gene in broiler chicken.
myristic acid (C14:0), palmitic acid (C16:0) stearic acid (C18:0) and arachidic acid (C20:0), with an average level of 0.89%, 24.27%, 10.47% and 0.09%, respectively.
Total MUFA (C14:1; C16:1; C18:1) and PUFA (C18:2;
C18:3; C20:4; C22:6) were calculated by adding each of the three and four FAs, respectively. The results also indicated total SFA was lower than MUFA but higher than PUFA.
2. Genotypic profile
Initially, the 1427 bp PCR product of FASN gene was digested using HaeIII restriction enzyme. Four fragments, 780, 340, 240 and 67 bp, were identified in animals having the GG genotype, and three fragments, 780, 340 and 307 bp, were identified in AA genotype (Fig. 1). It should be noted that the small fragments (less than 100 bp) were not distinguishable in the gel pictures.
In FASN gene, the frequency of G allele (0.57) was higher than frequency of A allele (0.43) and the genotype frequencies were 0.15 (AA), 0.56 (AG) and 0.29 (GG), respectively. In this population, the frequency of heterozygous allele was higher than homozygous alleles. In contrast, the homozygous allele AA in chicken SCD gene was higher than heterozygous alleles. The GG genotype frequency was 50 percent less than that of AA genotype.
3. FASN and SCD gene effects to FA composition
Our results indicated that no association was observed between g.1222 A>G SNP in FASN gene and fatty acid composition (Table 3). Only animals having AA genotype had suggestive association with high arachidic acid (C20:0) (P=0.08). The lack of association might be explained that the SNP location is not located in the thioesterase (TE) domain of FASN gene.
Based on the previously study, TE domain within bovine FASN complex is responsible for termination of fatty acid synthesis (Zhang et al., 2008). In case of FASN gene in chicken liver, Kasturi et al. (1988) observed that TE domain was located in exon 40-42 that might be also responsible for fatty acid analysis in chicken. In addition, the lack of association might also be highlighted by the sample size that has often failed to validate the analysis. Even though there was no association between g. 1222 A>G SNP of FASN gene and fatty acid composition, this is the first report to investigate the SNP in FASN gene and the association test with fatty acid composition.
In the case of SCD gene, the SNPs were manually identified by direct sequencing using fifteen chicken DNA samples. As the results, five SNPs were detected in two exons (exon 2 and 4) and two introns (intron 2 and 5). The SNP g.37284A>G and g.12903G>A located in exon 2 and 4, respectively, were used for
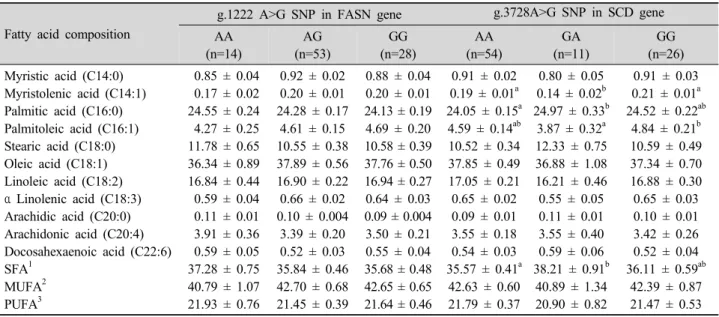
Table 3. The effect of the polymorphisms in FASN and SCD genes with fatty acid composition in broiler chicken.
Fatty acid composition
g.1222 A>G SNP in FASN gene g.3728A>G SNP in SCD gene AA
(n=14)
AG (n=53)
GG (n=28)
AA (n=54)
GA (n=11)
GG (n=26) Myristic acid (C14:0)
Myristolenic acid (C14:1) Palmitic acid (C16:0) Palmitoleic acid (C16:1) Stearic acid (C18:0) Oleic acid (C18:1) Linoleic acid (C18:2) α Linolenic acid (C18:3) Arachidic acid (C20:0) Arachidonic acid (C20:4) Docosahexaenoic acid (C22:6) SFA1
MUFA2 PUFA3
0.85 ± 0.04 0.17 ± 0.02 24.55 ± 0.24 4.27 ± 0.25 11.78 ± 0.65 36.34 ± 0.89 16.84 ± 0.44 0.59 ± 0.04 0.11 ± 0.01 3.91 ± 0.36 0.59 ± 0.05 37.28 ± 0.75 40.79 ± 1.07 21.93 ± 0.76
0.92 ± 0.02 0.20 ± 0.01 24.28 ± 0.17
4.61 ± 0.15 10.55 ± 0.38 37.89 ± 0.56 16.90 ± 0.22 0.66 ± 0.02 0.10 ± 0.004
3.39 ± 0.20 0.52 ± 0.03 35.84 ± 0.46 42.70 ± 0.68 21.45 ± 0.39
0.88 ± 0.04 0.20 ± 0.01 24.13 ± 0.19 4.69 ± 0.20 10.58 ± 0.39 37.76 ± 0.50 16.94 ± 0.27 0.64 ± 0.03 0.09 ± 0.004 3.50 ± 0.21 0.55 ± 0.04 35.68 ± 0.48 42.65 ± 0.65 21.64 ± 0.46
0.91 ± 0.02 0.19 ± 0.01a 24.05 ± 0.15a 4.59 ± 0.14ab 10.52 ± 0.34 37.85 ± 0.49 17.05 ± 0.21 0.65 ± 0.02 0.09 ± 0.01 3.55 ± 0.18 0.54 ± 0.03 35.57 ± 0.41a 42.63 ± 0.60 21.79 ± 0.37
0.80 ± 0.05 0.14 ± 0.02b 24.97 ± 0.33b
3.87 ± 0.32a 12.33 ± 0.75 36.88 ± 1.08 16.21 ± 0.46 0.55 ± 0.05 0.11 ± 0.01 3.55 ± 0.40 0.59 ± 0.06 38.21 ± 0.91b
40.89 ± 1.34 20.90 ± 0.82
0.91 ± 0.03 0.21 ± 0.01a 24.52 ± 0.22ab
4.84 ± 0.21b 10.59 ± 0.49 37.34 ± 0.70 16.88 ± 0.30 0.65 ± 0.03 0.10 ± 0.01 3.42 ± 0.26 0.52 ± 0.04 36.11 ± 0.59ab
42.39 ± 0.87 21.47 ± 0.53 Mean ± SE. are units of percentage fatty acid composition except for SFA, MUFA and PUFA.
a,bMean value with different superscript letters in the same row differ significantly at P<0.05.
The superscripts 1, 2, and 3 were total of saturated fatty acid (SFA), monounsaturated fatty acid (MUFA) and polyunsaturated fatty acid (PUFA), respectively.
genotyping using PCR-RFLP methods. The 468 bp (g.37284A>G) and 303 bp (g.12903G>A) of PCR products in SCD gene were digested using AciI and BsmBI restriction enzyme, respectively. Using SNP g.37284A>G, two fragments (328 and 140 bp) were identified in animals having the AA genotype, and three fragments, 236, 140 and 92 bp, were identified in GG genotype (Fig. 1).
The association analyses between SNPs in the chicken SCD gene and 14 FA traits were performed.
The differences in phenotypic means between the effects of the SNPs and FA composition traits were described in Table 2. The detailed analysis revealed that the g.3728A>G SNP of SCD gene was significantly associated with myristoleic acid (C14:1; P-value=
1.1x10⁻²), palmitic acid (C16:0; P-value=2.4x10⁻²), palmitoleic acid (C16:1; P-value=4.2x10⁻²) and saturated FA (SFA; P-value=3.5x10⁻²). The results indicated that the identified SNP was associated with an increase in palmitic acid and SFA but decrease in myristoleic acid in heterozygote animals. Moreover, the effect of the SNP in GG homozygous animals
indicated the increase in palmitoleic acid. Palmitoleic acid was considered to be having a positive effect in the reducing bad cholesterols (Nestel et al., 1994) and also in reducing fat deposition in blood vessels and blood clot formation (Grundy, 1994). Therefore, the selection of birds having palmitoleic acid may give a benefit for human health and the SNP in exon 2 in chicken SCD gene can be used as a marker for making breeding strategy in chicken industry. These results also suggest that confirmation study should be performed with more SNPs in candidate genes with large number of samples in the future.
IV. Conclusions
Fatty acid (FA) composition in meat is becoming more important in consumers’ point of view. Single nucleotide polymorphisms (SNPs) in two genes, fatty acid synthase (FASN) and stearoyl-CoA desaturase (SCD), have been investigated in chicken in order to identify the relationships with FA composition. As the results, the SNP g.3728A>G in SCD gene had significant
association with myristoleic acid (C14:1; P<0.05), palmitic acid (C16:0; P<0.05), palmitoleic acid (C16:1;
P<0.05) and saturated FA (SFA; P<0.05). This is the first results identifying SNPs in SCD gene and the significant association with FA composition in chicken.
Also, these findings will greatly contributing the development of molecular markers for meat quality in broilers.
Acknowledgements
This study was carried out with the support of “FTA Agriculture Research Project (Project No. PJ9070112013)”, RDA, Republic of Korea.
References
Almeida JCD, Perassolo MS, Camargo JL, Bragagnolo N, Gross JL. 2006. Fatty acid composition and cholesterol content of beef and chicken meat in Southern Brazil.
Brazilian Journal of Pharmaceutical Sciences 42:109-117.
Bhuiyan MSA, Yu SL, Jeon JT, Yoon D, Cho YM, Park EW, Kim NK, Kim KS, Lee JH. 2009. DNA polymorphisms in SREBF1 and FASN genes affect fatty acid composition in Korean cattle (Hanwoo). Asian-Australasian Journal of Animal Sciences 22:765-773.
Folch J, Lees M, Sloane Stanley GH. 1957. A simple method for the isolation and purification of total lipids from animal tissues. The Journal of Biological Chemistry 226:497-509.
Gross JL, Zelmanovitz T, Moulin CC, De-Mello V, Perassolo M, Leitao C, Hoefel A, Paggi A, Azevedo MJ. 2002.
Effect of a chicken based diet on renal function and lipid profile in patients with type 2 diabetes. Diabete Care 25:
645-651.
Grundy S.M. 1994. Influence of stearic acid on cholesterol metabolism relative to other long-chain fatty acids. The American Journal of Clinical Nutrition 60:986S-900S.
Jeon HJ, Choe JH, Jung Y, Kruk ZA, Lim DG, Jo C. 2010.
Comparison of the chemical composition, textural charac- teristics, and sensory properties of North and South Korean native chickens and commercial broilers. Korean Journal for Food Science of Animal Resources 30:171-178.
Kasturi R, Chirala S, Pazirandeh M, Wakil SJ. 1988. Charac- terization of a genomic and cDNA clone coding for the
thioesterase domain and 3' noncoding region of the chicken liver fatty acid synthase gene. Biochemistry 27:7778-7785.
Kim YC, Ntambi JM. 1999. Regulation of stearoyl-CoA desaturase genes: role in cellular metabolism and preadipocyte dif- ferentiation. Biochemical and Biophysical Research Com- munications 266:1-4.
Lee SH, van der Werf JH, Park EW, Oh SJ, Gibson JP, Thompson JM. 2010. Genetic polymorphisms of the bovine fatty acid binding protein 4 gene are significantly associated with marbling and carcass weight in Hanwoo (Korean Cattle). Animal Genetics 41:442-444.
Marrube G, Rozen F, Pinto GB, Pacienza N, Melo JE, Huguet MJ, Canet Z, Zandomeni R, Miquel MC. 2004. New polymorphism of FASN gene in chicken. Journal of Applied Genetics 45:453-455.
Matsuhashi T, Maruyama S, Uemoto Y, Kobayashi N, Mannen H, Abe T, Sakaguchi S, Kobayashi E. 2010. Effects of FASN, SCD, SREBP1 and GH gene polymorphisms on fatty acid composition and carcass traits in Japanese Black cattle. Journal of Animal Science 89:12-22.
Nestel P, Clifton P, Noakes M. 1994. Effects of increasing dietary palmitoleic acid compared with palmitic and oleic acids on plasma lipids of hypercholesterolemic men.
Journal of Lipid Research 35:656-662.
Ohsaki H, Tanaka A, Hoashi S, Sasazaki S, Oyama K, Taniguchi M, Mukai F, Mannen H. 2009. Effect of SCD and SREBP genotypes on fatty acid composition in adipose tissue of Japanese Black cattle herds. Animal Science Journal 80:225-232.
Roy R, Zaragoza P, Gautier M, Eggen A, Rodellar C. 2005.
Radiation hybrid and genetic linkage mapping of two genes related to fat metabolism in cattle: fatty acid synthase (FASN) and glycerol-3-phosphate acyltransferase mitochondrial (GPAM). Animal Biotechnology 16:1-9.
Taniguchi M, Utsugi T, Oyama K, Mannen H, Kobayashi M, Tanabe Y, Ogino A, Tsuji S. 2004. Genotype of stearoyl-coA desaturase is associated with fatty acid composition in Japanese Black cattle. Mammalian Genome 15:142-148.
Uemoto Y, Abe, Tameoka N, Hasebe H, Inoue K, Nakajima H, Shoji N, Kobayashi M, Kobayashi E. 2010. Whole-genome association study for fatty acid composition of oleic acid in Japanese Black cattle. Animal Genetics 42:141-148.
Woolett LA, Spady DK, Dietchy JM. 1992. Saturated and unsaturated fatty acid independently regulate low density lipoprotein receptor activity and production rate. Journal of Lipid Research 33:77-88.
Zhang S, Knight TJ, Reecy JM, Beitz DC. 2008. DNA polymorphisms in bovine fatty acid synthase are associated with beef fatty acid composition. Animal Genetics 39:
62-70.