DOI : http://dx.doi.org/10.5394/KINPR.2012.36.9.721
A Quantitative Marine Traffic Safety Assessment of the Vung Tau Waterway
Nguyen Xuan Thanh*, †Park Youngsoo, Park Jinsoo**
* Graduated School, Korea Maritime University, Busan 606-791, Republic of Korea
† Sea Training Center, Korea Maritime University, Busan 606-791, Republic of Korea
** Division of Navigation Science, Korea Maritime University, Busan 606-791, Republic of Korea
Abstract : Marine traffic safety of the Vung Tau Waterway, from port limit to Ganh Rai Gulf, plays a crucial role in the economic development of the important triangular economic zone in the south of Vietnam: Ho Chi Minh City, Dong Nai Province, Ba Ria-Vung Tau Province. This paper uses the IWRAP Mk2 program to assess marine traffic safety and shows that in the area there are three parts of fairway have highest risk of collision (from buoys No. 8-9 to buoys No. 1-2 of the Song Dinh fairway; from buoy No. 0 to buoys No.
8-9 and from buoys No. 6-9 to buoys No. 8-9A of the Sai Gon-Vung Tau fairway) and the two areas have highest risk of grounding (the Vung Tau coastline from Ganh Hao to Sao Mai and an area in the Ganh Rai Gulf). In addition, the result of a questionnaire survey on a group of Pilots shows that wind, current and rain/fog have considerable negative effect to ship handling of large vessels in this area.
This paper’s results will be used in the further research to discover solutions for improving marine traffic safety in the Vung Tau Waterway.
Key words : traffic safety, marine environment, marine traffic conditions, expert survey, IWRAP Mk2 program
* [email protected] 051)410-5085
†Corresponding author, [email protected] 051)410-5085
** [email protected] 051)410-4240
1. Introduction
Vung Tau Waterway is the main gate of the waterway traffic that connects the important triangular economic zone: Ho Chi Minh City, Dong Nai Province, Ba Ria-Vung Tau Province with other parts of Vietnam and other coun- tries in the world.
This area is an intersection of the three fairways so the numbers of passages of ocean vessels passing through this area is approximately equal to the total numbers of vessels that arrive/depart from ports in Ho Chi Minh City, Dong Nai Province and Ba Ria-Vung Tau Province.
The statistical data of Vietnam Maritime Administration (Cục Hàng hải Việt Nam, 2012a) in recent years shows:
(1) Number of vessels arrive/depart in 2009 increased 116% compared with 2007, reaching 21,991 passages.
In 2011, the number of passages decreased but still equal to 104% of those in 2007.
(2) The number of passages through Vung Tau-Thi Vai fairway increased rapidly, especially the group of vessels that have an LOA over 200m; they increased 25 times compared with 2007. This was due to the government’s plan to develop deep water ports along the Thi Vai river (Cục Hàng hải Việt Nam, 2012b).
In the near future, the world economy may recover. At
that time the number and size of vessels passing through this area will increase again, so the need for marine traffic safety in the area is becoming more and more urgent.
In the last 5 years (from 2007 to 2011) about 80% of ma- rine accidents in this area were collisions between two ships or between ships and other obstacles. That means the most of accidents were caused by marine traffic problems.
However, until now there has been no detailed study on marine traffic in this area. With a desire to identify marine traffic problems in the area, this paper studies and assesses the effect of marine environment and marine traffic con- ditions on marine traffic safety, namely:
(1) Areas that have traffic problems that should be fo- cused upon.
(2) Environment factors that have negative effects on ship handling.
The result of this paper will be the basis for further re- search on finding solutions for improving marine traffic safety in the Vung Tau Waterway.
The paper used statistical data from the Vietnam Maritime Administration, questionnaire survey results and interviews with fishermen, Coast Guard officers and Port Control officers. It also used the expert survey method and the IWRAP Mk2 program (IALA Waterway Risk Assessment Program) for quantitative assessment of
environmental factors’ effect and marine traffic conditions.
Because at present in Viet Nam, there is no data about traffic volume and distribution on each routes in the Vung Tau Waterway, so the AIS data that were collected during 20 days in this area will be used in the IWRAP Mk2 program.
2. Survey of Marine Environment
2.1 Research area
Vung Tau Waterway is the area in between of latitude 10-12.0N & 10-26.0N and longitude 106-54.0E & 107-08.0E.
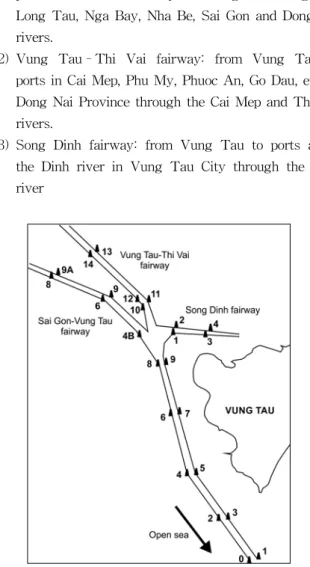
The three fairways in this area are:
(1) Sai Gon–Vung Tau fairway: from Vung Tau to ports in Ho Chi Minh City and Dong Nai through the Long Tau, Nga Bay, Nha Be, Sai Gon and Dong Nai rivers.
(2) Vung Tau–Thi Vai fairway: from Vung Tau to ports in Cai Mep, Phu My, Phuoc An, Go Dau, etc. in Dong Nai Province through the Cai Mep and Thi Vai rivers.
(3) Song Dinh fairway: from Vung Tau to ports along the Dinh river in Vung Tau City through the Dinh river
Fig. 1 The three fairways in the research area
2.2 Wind
There are two types of wind: NE and SW. Normally wind speed is less than 7 knots. Sometimes, gusts can reach up to 60 knots. But the maximum probability of wind
force more than force 4 is only 7% (World Weather, 2012).
From the pilot station at buoy No. 3 to Ganh Rai Gulf, the effect of wind is reduced because of the cover of Vung Tau and Can Gio land areas.
2.3 Current
Currents in this area are mostly caused by tidal stream (Nguyễn Vĩnh Phúc, 2012). The details of the tidal stream are:
(1) During 24 hours, the current’s direction changes four times and the maximum current speed at each time is also different, two times are high speed and two times are slow speed. Maximum current speed can reach up to 4 knots because of wide tide range.
(2) Among the three rivers in the area, Long Tau, Thi Vai and Dinh, the tidal stream in Long Tau is con- sidered as the strongest one.
(3) From buoy No. 0 to the port limit, current speed is slow due to the distance from the river mouths.
2.4 Rain and Fog
Located in the tropical monsoon region, there are only 2 seasons throughout the year: sunny and rainy season.
During the rainy season, from May to October, there are about 21 rainy days per month (World Weather, 2012).
However, rain usually comes as showers and lasts for only 1-2 hours.
The area rarely has fog, only about 10-12 days in a year and it only occurs during a few hours in the morning and afternoon.
250 200 150 100 50 0
1 2 3 4 5 6 7 8 9 10 11 12 Month
Average rainfall in July: 28 days
Fig. 2 Average rainfall in Vung Tau
2.5 Wave and Tide
From Ganh Rai Gulf to the pilot station at buoy No. 3, the wave height is usually less than 3m (MyForecast, 2012) so it almost has no effect on ocean vessels. From buoy No.
3 to the port limit, when there are gusts, waves will be
stronger and could affect ocean vessels with an LOA less than 100 m.
Tide does not directly affect ship handling but through the effect of current. Because the tide in this area is semi-diurnal and has a wide tide range it has very short time for deep draught vessel passing through narrow wa- ters in the area. It requires that Master and Pilot arrange a good plan for ship handling.
2.6 Width and Depth
According to the digital chart (ENC) of this area made by Southern Vietnam Maritime Safety Corporation, from buoy No. 0 to the port limit, the minimum depth on the chart is 13.8 m and it is open water area. So vessels with DWT up to 100,000 DWT (LOA: 300m, Breadth: 45m, Draft: 12m) can pass through this area safely.
From buoy No. 0 to buoys No. 8-9, the intersection of the three fairways, the width of the fairway is 350m and the depth of water is -14m. According to PIANC, It is safe for 100,000 DWT vessel passes through this area.
From buoys No. 8-9 to buoys No. 8-9A in Sai Gon-Vung Tau fairway, the depth of the fairway is -8.6m and the width is 350m. It’s also safe for 30,000 DWT ves- sels sailing in two-way traffic with a suitable draft.
From buoys No. 8-9 to buoys No. 13-14 of Vung Tau-Thi Vai fairway, the depth of water is -14m and the width is 400m. A 100,000 DWT vessel can pass through this area safely.
From buoys No. 8-9 to buoys No. 3-4 of Song Dinh fairway, the depth of water is -7m and the width is 150m.
It’s safe for 15,000 DWT cargo vessel to pass with a suit- able draft.
3. Investigation of Marine Traffic
3.1 Specifications
According to the traffic survey results, the marine traffic in this area consists of following traffic types:
1) Traffic of ocean vessels (domestic voyage vessel, ocean voyage vessel, off-shore supply vessel, etc.)
Ocean vessels usually pass the research area through 5 main routes as shown in Fig. 3.
(1) Route 1: from A to C and vice versa through the Sai Gon–Vung Tau fairway
(2) Route 2: from B to C and vice versa through the Sai Gon–Vung Tau fairway
(3) Route 3: from A to D and vice versa through the Thi Vai fairway
(4) Route 4: from B to D and vice versa through the Thi Vai fairway
(5) Route 5: from A to E and vice versa through the Song Dinh fairway
2) Traffic of inland waterway facilities (vessels that are less than 300GT, barges, wooden boats, etc.)
The number of inland waterway facilities that operate in the research area is small. Most of them are hydrofoil pas- senger vessels that operate between Ho Chi Minh City and Vung Tau City. The speed of these vessels is about 25 knots and there are about 40 passages per day. There are no night operations.
Fig. 3 Ocean vessels and off-shore fishing boats routes
A: to ports located in the middle and northern parts of Vietnam, China, Hong Kong, Taiwan, Korea, Japan, America, etc.
B: to ports located in Thailand, Cambodia, Singapore, Malaysia, Indonesia, Australia, India, Middle East, Europe, etc.
C: to ports located in Ho Chi Minh City and Dong Nai Province
D: to ports located in Dong Nai Province
E: to ports located in Ba Ria-Vung Tau Province, along the Song Dinh fairway
a: Cat Lo fishing port located in the Song Dinh fairway b: Sao Mai–Ben Dinh fishing ports located in the Ben
Dinh river
c: fishing boat anchorage located at Bai Truoc in Ba Ria-Vung Tau Province
d: to fishing grounds in Con Dao Island-Vietnam, Thailand, Malaysia, etc.
e: to fishing grounds in Philippine, Indonesia, etc.
f: to fishing grounds in the middle part of Vietnam 3) Traffic of off-shore fishing boats
In the Ba Ria-Vung Tau Province, there are 3 fishing support centers. Off-shore fishing boats often pass through the research area via the two routes shown in Fig. 3.
(1) Route 1: from (a), (b) vessels sail to point (1) at the position (10-22.5N, 107-22.5E) and alter their course to (d) for the fishing grounds. When arriving, they sail the opposite route.
(2) Route 2: from (a), (b), (c) vessels sail along coastal to point (2) and alter their course to (e) or (f) for the fishing grounds. They do the same route when arriving.
Fishing boats usually operate with a monthly cycle. They depart from the 16th to the 19th every month and return be- tween the 9th and the 13th of the next month, according to the lunar calendar. During this period there are about 300-500 passages of fishing boats passing through the re- search area per day.
4) Traffic of fishing boats that operate inside the research area
There are some fishing operations that operate inside the waterway of the research area as follows:
(1) By using fishing nets that were tied to a fixed pillar as shown in Fig. 4. These types of fishing operations have existed in the research area for many years so their positions are well known.
(2) By trawling and drift netting from buoy No. 3 to outside of port limit. Because trawling vessels move on the fairway with very slow speed and position of drift nettings changes day by day, they have a strong effect on ship handling of ocean vessels in the area.
Fig. 4 Fish trapping in Vung Tau area
Fig. 5 Drift netting
3.2 Traffic volume and Traffic distribution 1) Ocean vessels
The traffic volume of ocean vessels can be calculated based on information of the three port administrations (Cục Hàng hải Việt Nam, 2012a): Ho Chi Minh, Vung Tau and Dong Nai.
Figure 6 shows the number of passages on routes in re- cent years. It shows that the traffic volume of route No.1 is the highest. It was about 12,205 passages in 2011, 33 pas- sages per day on average. From 2007 to 2011, traffic vol- ume in route No. 3 increased about 130% per year. In aver- age, there were about 54 vessels passing this area per day in 2011.
Route 1
Route 2
Route 3 Route 4 Route 5
Fig. 6 The number of passages on routes in recent years
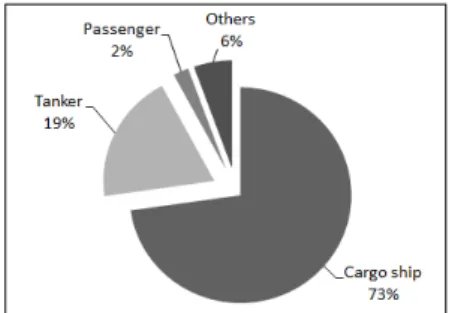
Most vessels in the Vung Tau Waterway carrying dan- gerous cargo are oil and chemical tankers. In 2011, they ac- count for 19% of all passages, as shown in Fig. 7.
Fig. 7 Types of vessels passing the area
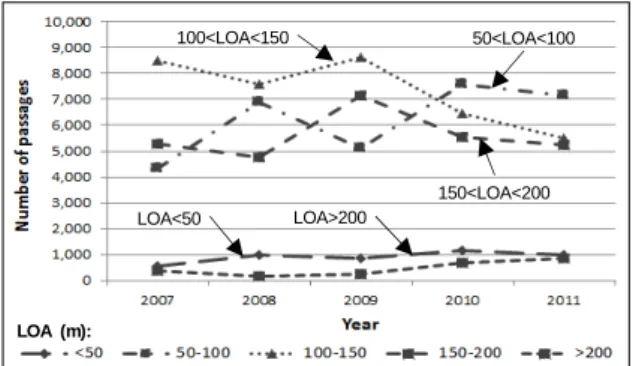
Figure 8 shows that the size of vessels passing this area is increasing. The number of passages by vessels that have an LOA from 100-150m is decreasing but the number of passages of vessels with an LOA over 200m is increasing.
LOA (m):
50<LOA<100
150<LOA<200 LOA>200
LOA<50 100<LOA<150
Fig. 8 Statistics of passages classified by LOA
Traffic distribution of ocean vessels was calculated based on AIS data in the 20 days from Sep. 11th to Sep 30th, 2012.
Most of the ocean vessels passing this area were over 300GT and were equipped with AIS according to IMO regulation.
Figures 9 & 10 show traffic distribution of ocean vessels from gate No. 1 to gate No.11 along the five main routes.
1
3 2 4
Fig. 9 Histogram of traffic of ocean vessels, from gate No.
1 to No. 4
8 9
11
6 7
5 10
4
Fig. 10 Histogram of traffic of ocean vessels, from gate No.
5 to No. 11
2) Inland waterway facilities
According to port control information, the number of inland waterway facilities such as barges, wooden boats and small cargo ships less than 300GT passing this area is very low.
Most passages are pilot boats and hydrofoil passenger ships.
This paper does not consider traffic of inland waterway facili- ties because of the negligible effect of this traffic type.
3) Off-shore fishing boats
Most fishing boats are not equipped with AIS, so in this paper, information of this type of traffic is based on col- lected information from Coast Guard officers and fishermen.
Fishing boats passing this area in a traffic area that is about one nautical mile wide along the two offshore fishing routes was displayed in section 3.1.
4) Fishing boats that operate inside the research area Like off-shore fishing boats, this type of traffic was dis- played in section 3.1. Its distribution is a traffic area that covers most of the area from buoy No.0 to Ganh Rai Gulf.
4. Assessment of effectiveness of marine environment and traffic conditions
to marine traffic safety
4.1 Marine environment
The effect of marine environment to marine traffic safety is assessed by its effect on ship handling in the area. In this paper, the expert survey method was used to assess this effect. A group of 30 pilots who work in the two pilot companies in this area, Vietnam Maritime Pilot Company No. 1 and New Port Pilot Company, were asked to answer a questionnaire consisting of 5 questions with 36 items.
Would you please evaluate the effect of CURRENT to ship handling when vessel sail FOLLOW CURRENT with following sizes of vessel. (-3: very negative effect/
-2: negative effect/ -1: maneuvering ability is worse, drifting/ 0: no effect/ 1: maneuvering ability is better, no drifting/ 2: positive effect/ 3: very positive effect)
a. Ballast vessel, LOA from 50 to 100 m
negative effect positive effect
<--->
(-3) (-2) (-1) (0) (1) (2) (3)
...
h. Full load vessel, LOA over 200 m
Fig. 11 A sample question in questionnaire
According to section 2 of this paper, only wind, current and rain/fog have a strong effect on ship handling. So the questionnaire was designed to focus on the evaluation of the marine environment factors described above.
Figure 11 shows a sample question for evaluation about the effect of currents. This effect is evaluated and graded in a seven levels Likert Scale; from “-3: very negative ef- fect” to “+3: very positive effect”.
Table 1 shows the working experience of the pilots who completed the survey.
Table 1 Working experience of pilots attended the survey
Pilot Company Number Experience
(years)
Pilot Company No. 1 11 18.6
New Port Pilot Company 19 11.6
Total 30 14.2
The reliability of the survey is tested by Cronbach’s Alpha method and results are presented in Table 2.
Table 2 Reliability statistic Cronbach's
Alpha
Cronbach's Alpha Based on Standardized Items
N of Items
0.944 0.955 36
Figure 12 shows that both NE and SW wind cause drift- ing effect to vessel. When vessel is in ballast condition this effect will be especially strong. If a ballast vessel sails at a slow speed, it is very difficult to keep her course.
1 2 3 4 1 2 3 4 1 2 3 4 1 2 3 4
Fig. 12 Effect of wind to ship handling
(from -3: very negative effect to +3: very positive effect)
In the case of sailing vessels that follow current, current has almost no effect on their maneuvering ability as shown in Fig. 13. When the vessels sail against current, then the drifting effect starts to occur. With ballast vessels, this ef- fect is almost the same on any size of vessels. But with a fully loaded vessel, this effect increases according to the
size of vessel. When the LOA of a vessel is over 150 m, current will cause strong drifting.
1 2 3 4 1 2 3 4 1 2 3 4 1 2 3 4
Fig. 13 Effect of current to ship handling
(from -3: very negative effect to +3: very positive effect)
Restricted visibility is one of the most important factors that affects ship handling. Figure 14 shows that rain and fog affect ship handling ability and this effect increases in proportion to the size of the vessel. It is very difficult for a look out on a small vessel (LOA from 50 to 100m) to see with the naked eye. On a large vessel (LOA over 150m) it is nearly impossible to see any targets without radar.
Fig. 14 Effect of rain and fog to ship handling (from -3: very negative effect to +3: very positive effect)
4.2 Assessment by IWRAP Mk2 program
Besides marine environment, traffic conditions are also an external factor that affects marine traffic safety. This paper uses the IWRAP Mk2 program for evaluating risk of collision and grounding in the area by calculating the fre- quency of collisions and grounding accidents.
1) Introduction about IWRAP Mk2 program
IWRAP Mk2 program (IALA, 2012) was developed by the Canadian Coast Guard, Technical University of Denmark and the Maritime Simulator Center Warnemende.
It was based on the IWRAP model.
In the IWRAP model, the frequency of accidents in a waterway can be calculated by a basic formula as follow:
λ = NG x P (1)
in here:
λ = frequency of collision or grounding accidents NG = geometric number of collision or grounding candi-
dates
P = causation factor
For calculating the NG value, the IWRAP model sepa- rates collisions and grounding accident by types as shown in Table 3. The NG value of a sub-type can be calculated based on specific scenarios for each one.
Table 3 Types of collision/grounding in IWRAP model Collision Head-on and Overtaking collision
Crossing collision Area collision Grounding Powered grounding
Drifting grounding
For calculating the causation factor, a causation possi- bility model was used. The IWRAP Mk2 program proposed to apply a Bayesian Networks model. It uses the default causation factor value as Table 4 (IALA, 2012).
Table 4 Default causation factor of IWRAP Mk2 program
Condition Causation
factor
Head on collisions 0.5 x 10⁻⁴
Overtaking collisions 1.1 x 10⁻⁴
Crossing collisions 1.3 x 10⁻⁴
Collisions in bend 1.3 x 10⁻⁴
Collisions in merging 1.3 x 10⁻⁴ Grounding-forget to turn 1.6 x 10⁻⁴
2) Prepare data: traffic routes, traffic volume and distribution for IWRAP Mk2 program
AIS data in the research area for 20 days from Sep. 10th to Sep. 30th, 2012 was used for plotting vessel AIS tracks by a dedicated program. The legs of the three fairways in the area were also drawn based on information from port administrations. Eleven gates along the three fairways were created for calculation. By using the program, traffic vol- ume, traffic distribution, average speed and average draft of vessels passing each gate were calculated and classified by ship type and LOA.
Traffic volume in a year was calculated by multi- plying the traffic volume of 20 days by 18.25 to make 365 days.
Fig. 16 Density plot, legs and traffic distribution
3) Create depth curves, run the model on IWRAP Mk2 program and analysis results
After drawing legs, the traffic volume and traffic dis- tribution were input into the IWRAP Mk2 program. Then the depth curves were drawn on top of a scan of BA chart No. 1016 and ENC chart of the area.
Fig. 17 Results of the IWRAP Mk2 program
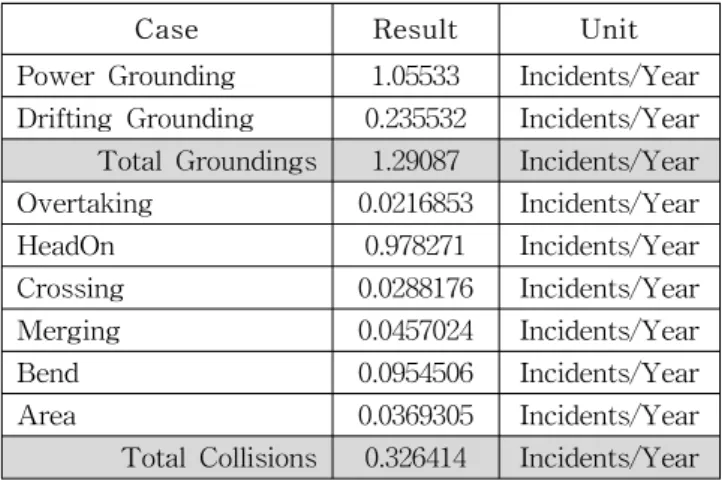
Table 5 Frequency of grounding and collision accident, calculated by IWRAP Mk2 program
Case Result Unit
Power Grounding 1.05533 Incidents/Year
Drifting Grounding 0.235532 Incidents/Year Total Groundings 1.29087 Incidents/Year
Overtaking 0.0216853 Incidents/Year
HeadOn 0.978271 Incidents/Year
Crossing 0.0288176 Incidents/Year
Merging 0.0457024 Incidents/Year
Bend 0.0954506 Incidents/Year
Area 0.0369305 Incidents/Year
Total Collisions 0.326414 Incidents/Year
After running the model, risk of collision and grounding in area was calculated and displayed as shown in Fig. 17 and Table 5.
According to Fig. 17, the area from buoy No.0 to buoys No. 8-9A, as shown in Fig. 18, has a higher risk of colli- sion and grounding than other areas in the waterway.
Based on Fig. 18, the area from buoys No. 8-9 to buoys No. 1-2 in the Song Dinh fairway has highest risk of collision. And the two other areas that also have risk of collision higher than the remaining areas locate along the Sai Gon-Vung Tau fairway from buoy No. 0 to buoys No.
8-9 and from buoys No. 6-9 to buoys No. 8-9A.
Fig. 18 also shows that area A and the Vung Tau coast- line from Ganh Hao to Sao Mai have highest risk of grounding in this waterway.
B.0 B.8-9
B.6-9 B.8-9A
B.1-2
B.4-5
Sao Mai
A
Ganh Hao
Fig. 18 IWRAP result from buoy No. 0 to No. 8-9A
5. Conclusion
By collecting environmental data, traffic data, applying questionnaire survey and using the IWRAP Mk2 program the effect of marine environment factors and marine traffic conditions to marine traffic safety in the Vung Tau Waterway was assessed. The results showed that:
(1) Wind, current and rain/fog have a considerable neg- ative effect on ship handling of large vessels.
(2) In this waterway, the part of the Song Dinh fairways from buoys No. 8-9 to buoys No. 1-2 has highest risk of collision. And the two other parts, from buoy No. 0 to buoys No. 8-9 and from buoys No. 6-9 to buoys No. 8-9A in the Sai Gon-Vung Tau fairway,
have lower risk of collision but still be higher than the remaining areas.
(3) Like this, the area A in Fig. 18 and the Vung Tau coastline from Ganh Hao to Sao Mai also have high- est risk of grounding in the waterway.
These results are the bases for further research to dis- cover solutions for improving marine traffic safety in the Vung Tau Waterway. In addition, the quantitative results of this paper are also the bases to evaluate the effectiveness of countermeasures by comparing their values.
References
[1] Cục Hàng hải Việt Nam(2012a), Thống kê số liệu, http://www.vinamarine.gov.vn/
[2] Cục Hàng hải Việt Nam(2012b), Quy hoạch-Dự án, http://www.vinamarine.gov.vn/
[3] IALA(2012), Iwrap wiki, http://www.iala-aism.org/wiki/
iwrap/index.php?title=Main_Page
[4] MyForecast(2012),Marine Forecasts-Vung Tau-Viet Nam, http://www.myforecast.com/bin/marine_forecast.m?city=
76847&metric=true#more
[5] Nguyễn Vĩnh Phúc(2012), “Luận văn dẫn tàu an toàn luồng Vũng Tàu-Thị Vải”, Khoa Hàng hải-Đại học GTVT TP.HCM, 2012, pp. 39-50
[6] World Weather(2012), Vung Tau Weather-Vietnam, http://www.worldweatheronline.com/v2/weather- verages.aspx?q=VTG
Received 16 October 2012 Revised 8 December 2012 Accepted 11 December 2012