• 검색 결과가 없습니다.

Identification of the Anthropogenic Land Surface Temperature Distribution by Land Use Using Satellite Images: A Case Study for Seoul, Korea

N/A
N/A
Protected

Academic year: 2021

Share "Identification of the Anthropogenic Land Surface Temperature Distribution by Land Use Using Satellite Images: A Case Study for Seoul, Korea"

Copied!
12
0
0

로드 중.... (전체 텍스트 보기)

전체 글

(1)

https://doi.org/10.7848/ksgpc.2017.35.4.249

Identification of the Anthropogenic Land Surface Temperature Distribution by Land Use Using Satellite Images: A Case Study for

Seoul, Korea

Bhang, Kon Joon

1)

·Lee, Jin-Duk

2)

Abstract

UHI (Urban Heat Island) is an important environmental issue occurring in highly developed (or urbanized) area such as Seoul Metropolitan City of Korea due to modification of the land surface by man-made structures. With the advance of the remote sensing technique, land cover types and LST (Land Surface Temperature) influencing UHI were frequently investigated describing that they have a positive relationship. However, the concept of land cover considers material characteristics of the urban cover in a comprehensive way and does not provide information on how human activities influence on LST in detail. Instead, land use reflects ways of land use management and human life patterns and behaviors, and explains the relationship with human activities in more details. Using this concept, LST was segmented according to land use types from the Landsat imagery to identify the human-induced heat from the surface and interannual and seasonal variation of LST with GIS. The result showed that the LST intensity of Seoul was greatest in the industrial area and followed by the commercial and residential areas. In terms of size, the residential area could be defined as the major contributor among six urban land use types (i.e., residential, industrial, commercial, transportation, etc.) affecting UHI during daytime in Seoul. For temperature, the industrial area was highest and could be defined as a major contributor. It was found that land use type was more appropriate to understand the human-induced effect on LST rather than land cover. Also, there was no significant change in the interannual pattern of LST in Seoul but the seasonal difference provided a trigger that the human life pattern could be identified from the satellite-derived LST.

Keywords : Landsat, Anthropogenic Heat, Surface Temperature, Land Cover, UHI

Original article

1. Introduction

UHI (Urban Heat Island) is an imaginary dome in which the air temperature is higher than its surrounding rural areas and causes uncomfortable environment for the inhabitants in cities. It typically occurs in highly developed urban areas in large cities due to the high heat-holding capacity of man- made structures such as concrete and asphalt structures. The UHI effect causes many problems, for instance, residents use more energy (Konopacki and Akbari, 2002) for air

conditioning or for more comfortable environment. This often causes more heat and pollutant emissions to the atmosphere, modifies the air circulation of the atmosphere, exacerbates the atmospheric or climate condition, and intensifies the UHI effect. After recognized in mid 1960s, the causes of UHI have not fully been understood until recently but main causes are considered to be materials of man-made structures and anthropogenic heat emission by energy consumption (Oke, 1982).

In early studies, many scientists provided information

This is an Open Access article distributed under the terms of the Creative Commons Attribution Non-Commercial License (http://

Received 2017. 07. 18, Revised 2017. 08. 04, Accepted 2017. 08. 30

1) Member, Dept. of Civil Engineering, Kumoh National Institute of Technology (E-mail: [email protected])

2) Corresponding Author, Member, Dept. of Civil Engineering, Kumoh National Institute of Technology (E-mail: [email protected])

(2)

on the possible influencing factors; for example, roughness of cities (Landsberg, 1956), earth-atmosphere interaction (Bornstein, 1968), heat radiation from urban surfaces (Atwater, 1972), wind speed, cloud cover, geographic location of a city, city size, status of the surface, pollutants, anthropogenic heat (Oke et al., 1991; Stanhill and Kalma, 1995), etc. The LST (Land Surface Temperature) distribution was later extensively observed with satellite images using the concept of land cover which indicates the thermal properties of the surface materials so that it is appropriate for studies on material characteristics like material emissivity. The first remote sensing on LST study was made by Rao (1972) using satellite-derived thermal data and many studies were conducted after that; for example, Kim (1992) analyzed surface energy composites for five land covers (i.e., buildings, asphalt, bare-soil, short grasses, etc.) with derived spectral albedo and temperatures and showed that the daytime heating in a metropolitan city occurred around mid-morning and was much warmer than the neighboring forest. Gallo et al. (1993) observed the UHI effect with the difference between the surface condition in urban and rural areas and by comparing NDVI (Normalized Difference Vegetation Index) with the minimum air temperature obtained from AVHRR. Lo et al.

(1997) reported that the higher vegetation index created lower radiant surface heat using the ATLAS data. Gallo and Owen (1998, 1999) attempted to relate NDVI to the radiant surface temperature and found that the urban–rural differences in the atmospheric temperature were linearly correlated to those in the NDVI and surface temperature. Owen et al.

(1998) also found that urbanization caused negative relation to fractional vegetation cover and positive relation to surface moisture availability by assessing the influence of urban land cover change relative to fractional vegetation cover, surface moisture availability, and surface radiant temperature.

Using modeling without in-situ measurements, the UHI magnitude was found to be inversely associated with rural temperature, while the spatial extent was independent of both heat island magnitude and rural temperature (Streutker, 2002). Weng et al. (2004) quantified the relationship between LST and NDVI using a spectral mixture model and Landsat ETM+ images. They found that LST had a slightly stronger correlation with the unmixed vegetation fraction than with

NDVI. These studies have been further advanced focusing on finding influential elements on UHI such as analyses on the relationship of UHI and land architecture (Li et al., 2016), spatiotemporal monitoring of UHI patterns (Sidique et al., 2016), responses of UHI to different land use types (Fu and Weng, 2017), etc. MODIS was often used to analyze UHI intensity in a larger scale analysis to understand, for example, the UHI effect on the southern Korean peninsula (Seo and Park, 2017).

So far, the concept of land cover, however, is frequently being used in mixture with that of land use due to the ambiguity between them because urban land cover includes the whole man-made materials like industrial, commercial, residential, transportation areas and does not consider detailed human activities on land. It is important that classification by land use type reflects human-induced effects because land use type explains the human life or behavior on land management in definition so that distinguishing the terms might be very useful in the UHI study on how human influence the relationship between LST and UHI. In other words, there is distinguishable difference between material characteristics of man-made structures and human activities in land management and this conceptual difference can provide important information to differentiate the human- induced heat from the land surface typically using satellite images that show snapshots of the ground truth. In fact, Roth et al. (1989) used the land use concept to understand LST on UHI and found that the temperature difference between urban and rural areas was typically greater at night than during daytime and daytime intra-urban thermal patterns are strongly associated with land use. Since this study, however, LST by land use types has been rarely studied with the remote sensing approach.

Using this concept, therefore, we observed the general

fact of LST by land cover and by land use and separated the

human-induced surface temperature from LST using GIS for

better understanding on the influence of the anthropogenic

heat from the surface typically in Seoul. Also, inter-annual

and seasonal variations of LST were observed to distinguish

the pattern of human activities.

(3)

2. Materials and Methods

2.1 Study area

Seoul Metropolitan City of Korea is approximately 605.27 km

2

and located at approximately N 37˚ 33’ in latitude and E 127˚ 00’ in longitude (Fig. 1(a)). It occupies 0.28% of the Korean peninsula and has an approximate population of 10,456, 000 (17, 275 persons/km

2

population density in 2008). Seoul is surrounded by several mountains to the north, east and south, and these neighboring hummocky features enclose a large flat basin forming Seoul.

Seoul has 25 administrative districts and plays an important role in the economic, financial and cultural facets for the comprehensive functionality of Korea (Fig. 1(b)). The percentages of Seoul residents by career are: 0.5% of the total residents work in the agricultural industry, 27.3% in manufacturing and 72.2% in the financial, commercial and service-related industries.

The annual average temperature is 12.2˚C, with an average of – 2.5˚C on January and the temperature is generally lower than other cities at the same latitude around the world. Seoul is influenced by the cold high atmospheric pressure originated from the Asian continent in winter and by the high humid air mass from ocean in summer, producing the continental climate where the annual temperature difference reaches 30˚C. The average annual precipitation is 1,300 mm with 72% of the seasonal distribution of precipitation occurring in June, July, August and September.

The UHI effect is especially important in Seoul, because

urbanization generated an uncomfortable environment for life in Seoul due to radical development and change from the 1960s to the 1980s. During the period, urbanization and population growth in Seoul rapidly modified the atmospheric environment and caused the development of problems such as urban heat islands, tropical nights, and air pollution. As a consequence, the increases in the annual average temperature of Seoul during the last century were 1.4 and 3.24 times greater than the averages of the Korean peninsula and the globe, respectively. Some studies on UHI in Seoul showed that its effect had a positive relationship with the previous- day maximum UHI intensity (Kim and Baik, 2002), and the surface settings (e.g. space between buildings, shadow, and building heights) of urban areas (Bhang and Park, 2009).

According to the report by Seoul Development Institute (2007), many efforts are recently being made to cope with the UHI effect in Seoul under the green growth policy of Korea.

For instance, solar panels have been installed and the absorbed energy is reused to produce hot water and heat buildings. Trees and green vegetation have been planted on tops of buildings.

According to the past record by Korean Meteorological Agency (https://data.kma.go.kr/cmmn/main.do), however, UHI and tropical nights are in fact increasing year by year, indicating an abnormal climate condition in Seoul.

2.2 Datasets

Three datasets were used: (i) Landsat images, (ii) IKONOS images obtained from Google Earth, and (iii) AWS (Automatic Weather System) measurements.

The Landsat images were used for land cover/land use classification and surface temperature extraction. The Landsat dataset is very useful typically for land use and land cover classification, vegetation segregation, chlorophyll-a detection, surface temperature extraction, etc. The datasets used in this study are Landsat 5 TM (Thematic Mapper) and 7 ETM+ (Enhanced Thematic Mapper Plus) imagery that are currently discontinued. The sensors of TM and ETM+ covered the range of visible light to near and thermal infrared. TM and ETM+ are essentially the same except that the ETM+ replaced the 120 m spatial resolution thermal band on TM with a 60 m.

Additionally, ETM+ has a panchromatic band (band 8) with a spatial resolution of 15 × 15 m which is sometimes useful in Fig. 1. The study area (Seoul) is located in the western part

of the Korean peninsula (the white circle in (a))

(a) Korean peninsula (b) Seoul metropolitan city

(4)

pan-sharpening for lower resolution bands. The swath widths of TM and ETM+ images are both 185 km, covering an area of 34 000 km

2

with a revisit cycle of approximately 16 days (Jensen, 2015). The SLC (Scan Line Corrector) in ETM+, a device compensating for the zig-zag scan pattern caused by the spacecraft motion (U.S. Geological Survey, 1998), failed on May 31, 2003 (U.S. Geological Survey, 2003). This failure of the SLC subsequently created void strips on the Landsat-7 images. There are several techniques that filling the void data strips, for example, the interpolation and replacement with other images for void pixels (U.S. Geological Survey, 2003), but in this study, this kind of manipulation was avoided to minimize error propagation during data processing. Instead, the Landsat-5 TM images were used as an alternative when they were available instead of the Landsat-7 ETM+ stripped images. The Landsat imagery was acquired free of charge from the GLOVIS and Earth Explorer databases (glovis.usgs.

gov or edcsns17.cr.usgs.gov) of the U.S. Geological Survey and NASA. The dataset used in this study was the Level 1G product, modified by both radiometric and geometric corrections (U.S. Geological Survey, 1998). Landsat-7 passes over the Seoul area at approximately 11 AM (between 10:58:57 ~ 11:04:03) when the surface illumination is almost at maximum in local areas (U.S. Geological Survey, 2017).

Table 1 shows the dates of Landsat images which are correspond to the dates of records of AWS in Seoul.

The IKONOS images were obtained from Google Earth and georegistered with the ground truth for the Landsat classification and feature identification. Also, the air temperatures from AWSs located at each district were utilized to observe the relationship between the atmospheric temperature and surface heat radiation.

2.3 Data processing 2.3.1 Image processing

We follow the typical procedures of image processing to obtain the reflectance values in the images; digital number conversion to radiance, atmospheric effect removal, and surface temperature retrieval. The DNs (Digital Numbers) in Landsat images (Level 1G product) were first converted to spectral radiance values using the following equation (USGS, 1998).

(1)

where is the spectral radiance at the sensor’s aperture in watts/m

2

·ster·μm, LMIN and LMAX are the minimum and maximum spectral radiances, and QCALMIN and QCALMAX are the minimum and maximum quantized pixel values. These are all listed in the metadata accompanied with the images. QCAL is the quantized image pixel value in DN.

Then, the atmospheric effect removal were applied using the FLAASH module in the ENVI software package.

The surface temperature (brightness temperature) was then calculated using the following equation (2) introduced in the Data Product section of Landsat-7 Science Data Users Handbook (USGS, 1998). The LST in Celcius was finally derived using the modified radiance values of the Landsat images by adding the conversion parameter (– 273.15) from Kelvin to Celcius.

(2)

where K

1

= 666.09 and K

2

= 1282.71 for Landsat-7 and K

1

= 607.76 and K

2

= 1260.56 for Landsat-5.

2.3.2 Classification of land cover and land use The IKONOS images from Google Earth were first stitched using GIMP (a GNU graphic software package) and georegistered to the Landsat image reference (UTM Zone 52, WGS84) by ArcGIS to identify the surface locations and materials. Also, land covers were classified with the Landsat 5 image obtained on Sep. 13, 2006 with the IKONOS images from Google Earth. For land cover, the Landsat images were classified into 50 unsupervised categories and they are Table 1. Dates of datasets from Landsat

Date Imaging

Sensor Date Imaging

Sensor

Sep.04, 2000 TM Jan. 5, 2005 ETM+

Sep.23, 2001 TM Sep. 13, 2006 TM

Sep.10, 2002 TM Aug. 23, 2007 ETM+

Jan. 25, 2002 TM Sep. 10, 2008 ETM+

Sep. 29, 2003 TM

(5)

reduced into 6 classes (forest, vegetation, urban, ground, water, and Others areas) by comparing each categories with the IKONOS image. The final classes were then checked if the accuracy satisfied 90% of the classification accuracy for each of the six land cover categories. This 6 class image was used as a mask to estimate LST of each category in Seoul.

Manual digitizing for land use data were also conducted based on the classification standard proposed by the Korean Ministry of Environment. The 2

nd

level classification standard includes 21 classes but some of them do not exist in Seoul.

Therefore, the total of 17 categories were used for land covers of Seoul: residential, industrial, commercial, entertainment, transportation, public, paddy field, ordinary field, green house field, broad leaf tree, needle leaf tree, mixed tree, natural vegetation, golf course, other vegetation, bare ground and inland water areas. Note that unidentifiable covers were excluded from the classification in the manual digitizing. The Han River encompassing the center of Seoul was excluded from the classification categories as well, so most of the water pixels were shallow and small inland streams, meaning that there is a high possibility to include other materials like vegetation, concrete, soil, etc.

3. Result and Discussion

The LST of Seoul was segmented by administrative district, land use, and land cover and visualized according to statistical characteristics. LSTs by land cover and land use showed huge variety in temperature and results of each segmentation are described in the following sections.

3.1 LST by land cover and land use

The LST by land cover in Seoul was extracted and we found that the LST distribution patterns in summer were almost identical every year except the strength of LST. Districts with high temperature were highly urbanized relative to other districts (i.e., Dongdaemum, Seongdong, and Yeoungdungpo) while low temperature districts had a lot of vegetation (i.e., Gangbuk, Nowon, and Seocho) correspondingly as shown in Fig. 2 and Fig.3. In Fig. 2, the surface temperatures of administrative districts with the large urban area was relatively high to other districts. It can be found that the general trends are essentially the same every year in Fig. 3.

Note that missing lines means ‘no data’ indicating the failure of scan line correction of Landsat ETM+.

Fig. 2. Composition of land cover types for each administrative district in Seoul (Unit: %)

(6)

In terms of land cover, the urban area was highest at 31.4˚C, followed by ground at 30.5˚C, vegetation at 29.9˚C, Others at 29.1˚C, and forest at 26.4˚C on Sep. 13, 2006 (Table 2). The water temperature of 27.2˚C was slightly higher than that of the forest area because the water pixels in the image were all inland streams with very shallow depths possibly including neighboring concrete or ground. As presented in many other studies, this result explains the surface material characteristics are highly influential on LST and finally intensifying the UHI effect in the urban area. The other images showed the same trend of temperature distribution for land use types.

The mean values of LSTs by land use in the urban area were also calculated for all of the images in the study and

the result on Sep. 10, 2002 was shown in Fig. 4. The surface temperature of the industrial area was highest among the urban land use types followed by the commercial, transportation, and residential. The green house field and ground were relatively high compared to the other land use types except urban covers. Also, the forest and agricultural areas showed a typical temperature distribution pattern indicating green vegetation is negatively proportional to the surface temperature, corresponding to other studies (Gallo and Owen, 1998, Weng et al., 2004). It should be noted that the temperatures of the golf course and other vegetation appeared relatively high because the golf course which means buildings or indoor practice areas excluding greed fields. Note that all of the ground types mixed with sparse vegetation were classified as other vegetation. Three major contributors on UHI can be defined such as the industrial, commercial, and residential ones which indicate different purposes of land use or different patterns of energy consumption by human.

Fig. 3. Average temperature for each administrative district in Seoul (Unit: °C)

Table 2. Surface temperatures for land cover on Sep. 13, 2006

Class Average Temperature Std. Dev.

Urban 31.4 1.67

Bare ground 30.5 1.91

Vegetation 29.9 1.93

Others 29.1 2.14

Water 27.2 1.35

Forest 26.4 2.08

(7)

3.2 Anthropogenic heat identification

The emissivity of concrete is approximately in the range of 0.9±0.5 similar to bare ground shown previously. We tried to identify the impact of the anthropogenic heat from the manmade surface. The LSTs by land use was illustrated in Fig. 5 using a boxplot. Note that the red plus (+) signs are outliers and the green line is the LST of bare ground including rock and soil with no vegetation in Fig.

5. We assumed that the emissivity of the urban surface is approximately equal including rock because pixels in urban land use types are mixed with various materials. For the bare ground, the upper bound of the boxplot can be represented as the rock temperature. Based on the assumption, the LST from rock was set as the reference LST unaffected by human activities and the urban area could be separated from the other land use types to show how urban land surface is influenced by human activities. The LSTs for each land use type in the urban provide important information about the dependency of land use types on human activities by referring to Fig. 5. For example, industrial area may consume the greatest energy for production among urban land use types. The commercial area might use more energy than the residential area during daytime probably because the area should maintain commercial facilities for business. The LST of the transportation area was around that of the residential.

The entertainment area had exceptionally low temperature in the same category because the area represents vegetated park along banks of the Han River and sports complex in parks. In general sense, it was also reasonable that the green house field was highest among the same category. These reflect how LST is changed by human activities (i.e., energy consumption) and using land use type, we could confirm that there should be direct relationship between human activities Fig. 4. Surface temperature for land use on Sep. 10, 2002 (Unit: °C)

Fig. 5. LST distribution for each land use types (Unit: °C)

(8)

and LST in which the anthropogenic effect can be separable.

Using the LST value of the rock temperature as reference, the LST of Seoul was mapped with blue and red colors for lower and higher temperatures, respectively (Fig. 6(a)). The relatively cool surface (blue color) was out of our concern because in theory the area does not influence the UHI effect.

The relatively hot surface (red color) might be defined as the most probable place heating up the atmosphere. There was a large area where LST was higher than the reference in the upper half of Seoul and this probably intensified the UHI effect during daytime, typically in Yongsan, Jung

Dongdaemun, and Seongdong because of the larger area with high temperature. Most of the red colors are in fact the residential, commercial, and industrial areas, which can possibly describe that the LST is primarily dominated due to these land use types. At first sight, the red area of each district in the upper half of Seoul was much wider than in the lower half and the residential area in the red was greater than in the upper half of Seoul. For instance, Yongsan, Dongdaemun, and Dobong have a wider residential area in red than Gangnam or Seocho. However, the actual size of the residential area in lower half (i.e., Gangnam and Seoch) is much wider than Yongsand and Dongdaemun. Supposing that the solar radiation is constant throughout Seoul, it can be suspected that the LST in the urban area is not only a function of the solar reradiation from the land surface but also of human activities on land such as life pattern and the human-induced heat can be termed as the anthropogenic land surface heat.

3.3 Relationship of LST with size and temperature of land use type

We separated the relatively hot surface using on residential, industrial and commercial areas to observe the relationship between LST and the size of each type. In Fig. 6(b), the residential area illustrated by the light blue color covers most of the high temperature area and the residential area can be considered to be the dominant contributor on UHI in size. It was also figured out that the significant size of the residential area in Gangnam and Seocho was marked as cool surface relative to other districts in the upper half of Seoul and this brought a suspicion that the human life pattern on energy consumption differentiated the LST distribution of the urban area. To identify, the electric power was obtained from Korea Electric Power Company (KEPCO) and compared with the areal fractions of the urban and the LST. The cumulative electric power used on September 10, 2002 for each district was closely correlated with areal fractions of the three land use types (i.e., 0.56, 0.49, and 0.78 for the residential, industrial, and commercial areas, respectively) and the commercial one was the most strongly correlated land use type to the energy consumption. This indicates human activities in terms of energy consumption in the urban are important. However, (a)

Fig. 6. Comparison of relatively cool and hot surfaces in Seoul

(b)

(9)

it should be noted that the consumption pattern might be different during day and night in each urban land use type and must include other types of energy such gasoline, natural gas, etc. so the result may not necessarily represent the actual relationship between the energy consumption and the land use type.

For Jung and Jongno, the relatively large portion of the red area was covered by the commercial and its LST was higher than that of the residential. Also, the west side of the Geumchon district (the red area in Fig. 6(a)) is packed with industrial and commercial facilities where the LST was very high. The industrial and commercial areas (the light blue area in Fig. 6(b)) were actually small in size but much higher in temperature relative to the residential and they can be considered as major contributors influencing UHI in terms of the LST intensity. We could therefore remark that UHI is strongly related to land use types and the most influential land cover types are typically the residential, industrial, and commercial types in Seoul. In summary, the UHI-influencing LST is actually a function of the LST intensity and the size of land use. In Seoul, the LST of the residential area is not

relatively high but the contribution of the area might be important in the UHI intensity because of its large size. The industrial and commercial ones are not significant in size but their LST might be more influential in temperature.

Additionally, the most influential district on UHI in Seoul could be identified using the areal fractions of the urban per the total size of Seoul (Fig. 7). The urban proportions of each district roughly follow the median LST of each district. For example, Gangnam and Songpa were highest at 2.69% and 2.43%, respectively and are in fact most frequently suffered by the tropical night every year. On the other hand, Dobong was the least UHI experiencing district during daytime, which are corresponding to the result on the areal fractions in Fig. 7.

3.4 Seasonal temperature variation by the anthropogenic LST

The interannual LST distributions on Sep. 4, 2000 and

Sep. 13, 2006 for summer and Jan. 29, 2002 and Jan. 5, 2005

for winter were observed. Note that the winter images did

not include snow cover. Interannual LST distributions in the

Fig. 7. The ratios of the urbanized areas including all built-up land covers relative to the whole area of Seoul (Unit: %)

(10)

same season had the same pattern in temperature distribution each year so that no significance existed as shown in Fig. 8.

For seasonal distributions, the LST pattern of Seoul was in general the opposite between summer (Fig. 8(a)) and winter (Fig. 8(b)). In other words, the LST of the urban area was typically hotter in summer and cooler in winter than that of the vegetated (or forest) so the LST effect on the daytime UHI of Seoul in winter could be considered not significant relative to in summer. The LST on Sep. 10, 2002 and Jan. 29, 2002 was normalized to identify the seasonal change in LST and means and standard deviations for the normalized LST difference (Sep. 10, 2002–Jan. 29, 2002) in the residential, industrial, and commercial areas were evaluated and showed 0.41 ± 0.53, 0.05 ± 0.66, 0.45 ± 0.50, respectively. The statistical value of 0.05 for the industrial area describes a possible scenario that the area consumes the consistent energy for

production in industrial buildings and facilities and emits a similar amount of the anthropogenic heat from the buildings throughout the year regardless seasons. Relatively, the other two areas had much greater variation and it was difficult to explain the reason. Considering the energy consumption pattern, the residential and commercial areas do not reflect steady and continuous use of energy by human activities.

Supposing that the material emissivity is a minor factor influencing LST because of the mixing in the urban area as described previously, the LST variation might be because the human life pattern among seasons causes the LST intensity, that is, the anthropogenic heat, by land use types.

4. Conclusion

Using Landsat imagery, the possible relationship between the surface heat distribution and the UHI effect during daytime was observed in three points: (1) the surface temperature distribution in Seoul according to land cover/use types, (2) the identification of the anthropogenic heat from the urban area and (3) interannual difference of LST on UHI in Seoul.

With respect to the surface heat radiation in Seoul, LST was associated to the land cover type, as shown in many other studies. Interesting characteristics with land use types were found in the LST distribution: the LST variation among land use types was existed due to human activities on the land surface. For example, the industrial area emitted the strongest heat and the commercial and residential ones were followed. This indicated that the most influential land use type on UHI might be the industrial area in LST. However, it was not true in Seoul because the LST distribution was also a function of area (or size) of each land use type. Using the GIS analysis, we found that three main contributors affecting on UHI in Seoul in terms of area were first the residential area then the commercial and industrial because industrial and commercial areas were relatively much smaller than the residential area. However, the LST contribution of area on UHI depends on how wide each land use type is in size.

The land use types further showed seasonal variations in the temperature distribution, which typically followed the human activities over the urban area. The industrial and Fig. 8. The LSTs of Seoul (a) in summer (September, 2002)

and (b) in winter (January, 2002) (a)

(b)

(11)

commercial areas were not relatively sensitive to seasonal variation because these areas were considered to emit relatively constant heat for year-round production and work environment regardless of the season but the residential area more reflected the daily life patterns of residents.

Acknowledgment

This paper was supported by Research Fund, Kumoh National Institute of Technology.

References

Atwater, M.A. (1972), Thermal effects of urbanization and industrialization in the boundary layer: a numerical study, Boundary-Layer Meteorology, Vol, 3, pp. 229-245.

Bhang, K.J. and Park, S.S. (2009), Evaluation of the surface temperature variation with surface settings on the urban heat island in Seoul, South Korea using Landsat-7 ETM+

and SPOT, IEEE Geoscience and Remote Sensing Letters, Vol. 6, pp. 708-712.

Bornstein, R.D. (1968), Observation of the urban heat island effect in New York City, Journal of Applied Meteorology, Vol. 7, pp. 575-582.

Fu, P. and Weng, Q. (2017), Responses of urban heat island in Atlanta to different land-use scenarios, Theoretical and Applied Climatology, https://doi.org/10.1007/s00704-017- 2160-3.

Gallo, K.P., Mcnab, A.L., Karl, T.R., Brown, J.F., Hood, J.J., and Tarpley, J.D. (1993), The use of NOAA AVHRR data for assessment of the urban heat island effect, Journal of Applied Meteorology, Vol. 32, pp. 899-908.

Gallo, K.P. and Owen, T.W. (1998), Assessment of urban heat islands: A multi-sensor perspective for the Dallas-Ft.

Worth, USA region, Geocarto International, Vol. 13, pp.

35-41.

Gallo, K.P. and Owen, T.W. (1999), Satellite-based adjustments for the urban heat island temperature bias, Journal of Applied Meteorology, Vol. 38, pp. 806-813.

Jensen, J.R. (2015), Instroductory Digital Image Processing:

A Remote Sensing Perspective, Pearson, New Jersey.

Kim, H.H. (1992), Urban heat island, International Journal

of Remote Sensing, Vol. 12, pp. 2319-2336.

Kim, Y. and Baik, J. (2002), Maximum urban heat island intensity in Seoul, Journal of Applied Meteorology, Vol.

41, pp. 651-659.

Konopacki, S. and Akbari, H. (2002), Energy Savings for Heat Island Reduction Strategies in Chicago and Houston (Including Updates for Baton Rouge, Sacramento, and Salt Lake City), Draft Final Report, LBNL-49638, University of California, Berkeley.

Landsberg, H.E. (1956), The Climate of Towns. Man's Role in Changing the Face of the Earth, The University of Chicago Press, Chicago, Illinois.

Li, L., Li, W., Middel, A., Harland, S.L., Brazel, A.J., and Turner II, B.L. (2016), Remote sensing of the surface urban heat island and land architecture in Phoenix, Arizona:

Combined effects of land composition and configuration and cadastral-demographic-economic factors, Remote Sensing of Environment, Vol. 174, pp. 233-243.

Lillesand, T.M., Kiefer, R.W., and Chipman, J.W. (2008), Remote Sensing and Image Interpretation, John Wiley &

Sons.

Lo, C.P., Quattrochi, D.A., and Luvall, J.C. (1997), Application of high-resolution thermal infrared remote sensing and GIS to assess the urban heat island effect, International Journal of Remote Sensing, Vol. 18, pp. 287- 304.

Oke, T.R. (1982), The energetic basis of the urban heat island, Quarterly Journal of the Royal Meteorological Society, Vol. 108, pp. 1-24.

Oke, T.R., Johnson, G.T., Steyn, D.G., and Watson, I.D.

(1991), Simulation of surface urban heat island, Boundary Layer Meteorology, Vol. 56, pp. 339-358.

Owen, T.W., Carlson, T.N., and Gillies, R.R. (1998), An assessment of satellite remotely-sensed land cover parameters in quantitatively describing the climatic effect of urbanization, International Journal of Remote Sensing, Vol 19, pp. 1663-1681.

Qin, Z. and Karnieli, A. (1999), Progress in the remote sensing of land surface temperature and ground emissivity using NOAA± AVHRR data, International Journal of Remote Sensing, Vol. 20, pp. 2367-2383.

Rao, P.K. (1972), Remote sensing of urban "heat islands"

(12)

from and environmental satellite, Bulletin of the American Meteorological Society, Vol. 53, pp. 647-648.

Roth, M., Oke, T.R., and Emery, W.J. (1989), Satellite- derived urban heat islands from three coastal cities and the utilization of such data in urban climatology, International Journal of Remote Sensing, Vol 10, pp. 1699-1720.

Seo, K.H. and Park, K.J. (2017), Analysis of urban heat island intensity among administrative district using GIS and MODIS Imagery, Journal of the Korean Association of Geographic Information Studies, Vol. 20, No. 2, pp. 1-16.

SDI, Seoul Development Institute (2007), Urban heat island mitigation plan of Seoul city, Seoul Policy Focus, Vol. 23.

Sidique, P., Huete, A., and Devadas, R. (2016), Spatiao- temporal mapping and monitoring of urban heat island patterns over Sydney, Australia using MODIS and Landsat-8, Procedings of 2016 4

th

International Workshop on Earth Observation and Remote Sensing Applications (EORSA), 4-6 July, Guangzhou, China, pp. 217-221.

Stanhill, G. and Kalma, J.D. (1995), Solar dimming and urban heating at Hong Kong, International Journal of Climatology, Vol. 15, pp. 933-941.

Streutker, D.R. (2002), A remote sensing study of the urban heat island of Houston, Texas, International Journal of Remote Sensing, Vol. 23, pp. 2595-5608.

U.S. Geological Survey (1998), Landsat 7 Science Data Users Handbook, U.S. Geological Survey, https://pubs.er.usgs.

gov/publication/7000070 (last date accessed: 18 July 2017).

U.S. Geological Survey (2003), Preliminary assessment of the value of Landsat 7 ETM+ data following Scan Line Corrector malfunction, USGS, NASA, and Landsat 7 Sceince Team.

U.S. Gelological Survey (2017), What are the acquisition schedules for the Landsat satellites? U.S. Department of the Interior, https://landsat.usgs.gov/what-acquisition- schedule-landsat (laste date accessed: 15 July 2017).

Weng, Q., Lu, D., and Schubring, J. (2004), Estimation of land

surface temperature-vegetation abundance relationship for

urban heat island studies, Remote Sensing of Environment,

Vol. 89, pp. 467-483.

수치

Table 1 shows the dates of Landsat images which are  correspond to the dates of records of AWS in Seoul.
Fig. 2. Composition of land cover types for each administrative district in Seoul (Unit: %)
Fig. 3. Average temperature for each administrative district in Seoul (Unit: °C)
Fig. 5. LST distribution for each land use types (Unit: °C)
+2

참조

관련 문서

This study examined the effect of different urban land cover types on the land surface temperature using MODIS, Landsat ETM+ and RapidEye satellite data.. As a result,

For the study, we observed the influence of the surface settings (i.e., geometric shape and color) on NDVI values in urban area and transition features between three land

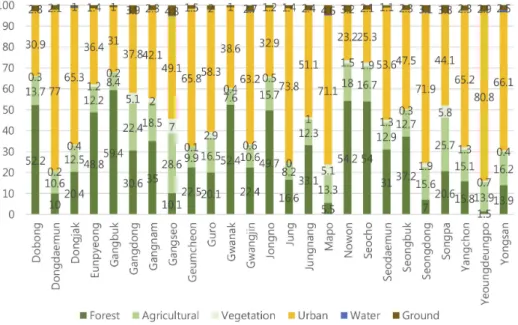
By analyzing the relationship between surface temperature and land use types, this study categorizes the eighteen urban land uses into 7-8 groups according