『지역연구』제31권 제3호 2015년 9월 Journal of the KRSA
vol.31, no.3, 2015 pp.99-112
Land Surface Temperatures of
Industrial Complexes in Jeonnam Using Landsat 7 ETM+ Satellite Images
Nguyen Truong Linh* ․ Tran Quang Huy** ․ Huh Jungwon*** ․ Han Dongyeob****
Abstract : Observation of land surface temperature in industrial areas is problematic, as it is not possible to construct a network of weather stations with sufficiently high density and continuous operation in such zones. Multiphase remote sensing data that cover a wide area and take a short time to process can enable the user to precisely and continuously measure the current and changing land surface temperatures in a certain region. Jeollanam-Do in South Korea is undergoing rapid industrialization, with the establishment of a number of industrial complexes, such as the Gwangyang Steelworks, Yeosu Industrial Complex, Yulchon Industrial complex, and Daebul Industrial Complex.
To look into the properties of industrial complex’s temperature, this study uses the thermal band of Landsat 7 ETM+ images acquired under thermal infrared wavelengths in order to calculate and compare the surface temperatures of the four above-named industrial complexes. From this, it is possible to obtain the basic information about industrial complex for environmental and natural resource management, which will aid industrial complex planners in developing methods of addressing environmental problems.
Key words : Remote Sensing, Landsat 7 ETM+, Thermal Band, Land Surface Temperature, Industrial Complex
This study was supported by 2015 Jeonnam Green Enviroment Center.
* Master student, Dep. of Civil and Environmental Eng., Chonnam National University, ([email protected]) ** Ph.D. student, Dep. of Civil and Environmental Eng., Chonnam National University, ([email protected]) *** Professor, Dep. of Marine and Civil Eng., Chonnam National University, ([email protected])
**** Associate Professor, Dep. of Marine and Civil Eng., Chonnam National University, ([email protected])
1. Introduction
Land Surface Temperature (LST) is defined as the temperature emitted by the surfaces of land objects. LST is an indicator of the energy balance at the surface, because it is one of the key parameters in the physics of land-surface processes, energy budget estimation, land cover assessment and other related earth surface characteristics. Further, it is a combination of the results of surface-atmosphere interactions and energy fluxes between the atmosphere and the ground (Akhoondzadeh and Saradjian, 2008).
Historically, it has been difficult to estimate the LST of an area. Initially, LST was calculated for a particular set of sample points, and the point data was generalized into area data. However, with the modern development of satellites and high resolution sensors it is now possible to estimate LST over a large region, through the use of thermal infrared band data supplied by satellites (Rajeshwari and Mani, 2014).
Many studies have been carried out to measure and understand LST. Considering Jubail City in Saudi Arabia, El-Nahry and Rashash (2010) used the equations set out by Weng et al. (2004), in addition to band 6 of Landsat Enhanced Thematic Mapper Plus (ETM+), in order to assess temperature differences within Jubail City and to compare the relationships between urban surface temperature and that of
other land cover types such as industrial and green areas. Their study revealed an increase in urban surface temperatures near to industrial areas, compared with suburban areas; the center of this heat island was located above the industrial area and its adjacent urban areas.
Additionally, buildings were identified as features that reflect a large amount of heat, and are therefore primarily responsible for the increased surface temperatures of urban areas compared to undeveloped areas and gardens. Li et al. (2009) analyzed the changing pattern of LST with changing land use in Shanghai, China, using Landsat TM images from two periods, and identified that the expansion of industrial areas and the Manhattanization of commercial buildings are the main causes of increasing LST.
In addition to this, Dugord et al. (2014) studied surface temperatures in Berlin, Germany using LST maps derived from two Landsat thermal satellite images acquired at 10 pm and 10 am on two subsequent summer days. They also examined land use patterns through the identification of land use types, landscape metrics, and structural parameters through statistical and GIS analysis. Using linear regressions, they determined that the degree of soil sealing was the best predictor of LST variation. Using this conclusion, they were able to examine the distribution of LST with regard to the underlying effects of urban land use
patterns, and identify areas at potential risk of heat stress, based on temperature distributions and demographic vulnerability (Dugord et al., 2014).
Although there have been many studies into surface temperature, most research has focused on urban areas, and particularly the urban heat island phenomenon in such regions (Rinner and Hussain, 2011; Van and Bao, 2010). As yet, few studies have investigated heavily industrialized zones or their influence on the surrounding environment.
This research aims to evaluate the use of Landsat 7 ETM+ data for identifying temperature differences in industrial areas, to analyze and compare industrial surface temperatures and land cover types, and to assess the impact of operations in industrial zones on the environment, as well as objects both inside and outside these areas. This information will assist industrial planners in developing methods of treating environmental problems.
2. Study Area and Satellite Image Data
1) Study Area
Jeollanam-do in South Korea is part of the Honam region, and is bounded to the west by the Yellow Sea, to the north by Jeollabuk-do
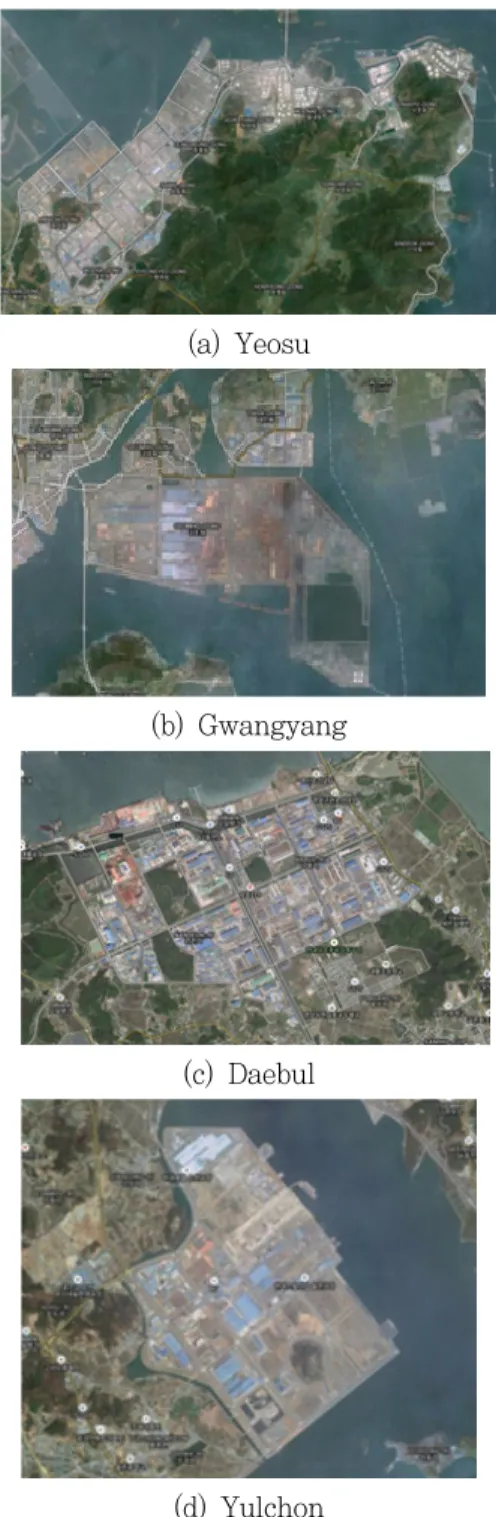
Province, to the south by the Jeju Strait, and to the east by Gyeongsangnam-do Province. Jeolla Nam is undergoing rapid industrialization with the development of a number of industrial complexes, such as Gwangyang Steelworks, the Yeosu Industrial Complex, the Yulchon Industrial Complex, and the Daebul Industrial Complex. As shown in Table 1, there are five national industrial complexes, eight general industrial complexes, and four agricultural industrial complexes (Kim and Ahn, 2013).
The Steelworks in Gwangyang is the largest steel plant in the world, possessing the most modern technology and the best facilities for steel manufacturing; its capacity for production of crude steel is 18,000,000 tons/year. The Yeosu Industrial Complex, which specializes in oil refining (650,000 barrels/day), fertilizers (1,360,000 tons/year), and petrochemicals (5,700,000 tons/year) has evolved into a global fine chemical industrial complex. The Daebul Industrial Complex provides industry shipbuilding and renewable energy, while the Yulchon Industrial Complex specializes in metals, machinery equipment, and electronic products.
<Table 1> Primary Jeollanam-do industrial complexes
Name Purpose Area(km²) Industry Yeosu National 50.25 Chemical
Gwangyang National 96.4 Steel
Samho National 2.9 Heavy Metal
Hampyeong
Bitgreen National 2.23 Automobile Deabul National 11,37 Shipbuilding
Boseong
Joseong Agricultural 0.06 Green Tea
Mokpo
Sanjeong Agricultural 0.012 Biotech
Damyang
(Eco) Agricultural 0.015 Process food
Gangjin
Chilryang Agricultural 0.035 Flower
Yeosu
Yulchon1 General 9.17 Auto,
motorbike
Jangheung General 2.9 Food
Naju Mirae General 2.95
Shipbuilding and automobile
part Gangjin General 0,66 Environment
Yeonggwang General 1.64 Electric Vehicle
Suncheon
Haeryong General 1.61 Magnesium alloy, ceramics
Jangseong
Nano General 0.9 Cosmetic
Hwasun General 0.76 Biomedical
(a) Yeosu
(b) Gwangyang
(c) Daebul
(d) Yulchon
Figure 1. Industrial complex study areas
2) Satellite Image Data
Remote sensing data was used for this study.
Landsat 7 satellite data was downloaded from the U.S. Geological Survey Global Visualization Viewer (GloVis) website (http://glovis.usgs.gov/;
accessed August 2015). We used Landsat images instead of the MODIS and COMS (Communication, Ocean and Meteorological Satellite) imagery with a spatial resolution of 1km. The ETM+ sensor scans a spectrum of eight bands with a high resolution, to provide images of the Earth surface with resolutions of 30 m for a multispectral image TM, and 15 m for a panchromatic image (LPSO). Table 2 presents the sensor characteristics for LANDSAT 7 ETM+.
<Table 2> Bands in Landsat 7 ETM+ sensor Band Wavelength(mm) Resolution(m)
Blue 0.45-0.52 30
Green 0.52-0.60 30
Red 0.63-0.69 30
Near IR 0.76-0.90 30
SWIR 1.55-1.75 30
Thermal IR 10.40-12.50 60
SWIR 2.08-2.35 30
Panchromatic 0.5-0.9 15
ENVI and IDL software were used to identify surface temperatures and analyze land coverage (ITT Visual Information Solutions, 2009). For this study, five Landsat images were used (Table 3).
<Table 3> Details of Landsat-7 ETM+ images used in this study
No Date Time
1 17/3/2010 10:57:48
2 5/4/2011 10:59:17
3 7/4/2012 10:59:44
4 9/3/2013 11:01:48
5 28/3/2014 11:02:36
3. Method
1) Method
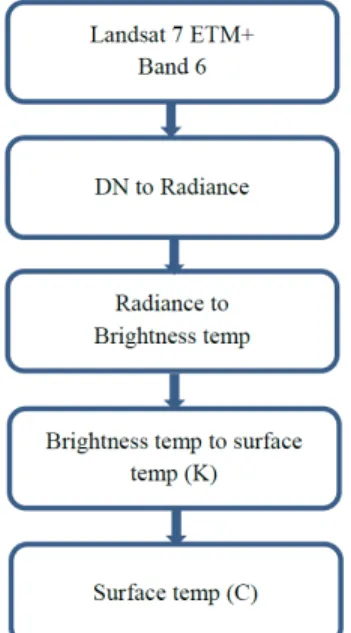
To calculate the surface temperature, this study employs the equations provided by Weng et al. (2004). The surface temperature was extracted from thermal Band 6 of the Landsat 7 ETM+ images. The equations are used to covert Landsat digital number (DN) pixel values to radiance. Radiance is then converted to brightness temperature, and finally brightness temperature is used to calculate surface temperature (Figure 2).
The Landsat ETM+ sensors acquire thermal temperature data and store this information as a DN ranging between 0 and 255 in the thermal band (Band 6.1 in ETM+). These DNs can then be converted to degrees Kelvin. The spectral radiance (Lλ) is calculated using the following equation (LPSO):
m ax m i n
m axm i n
× m i n m i n
where Lλ is the spectral radiance at the
sensor's aperture; DN is the quantized calibrated pixel value; Qcalmin is the minimum quantized calibrated pixel value corresponding to Lminλ (DN); Qcalmax is the maximum quantized calibrated pixel value corresponding to Lmaxλ (DN); Lmin is the spectral at-sensor radiance, scaled to Qcalmin; and Lmax is the spectral at-sensor radiance, scaled to Qcalmax.
Figure 2. Process of calculating the surface temperature
The equation to convert radiance to temperature was used as follows:
ln
where T is the temperature in Kelvin; K1 is 666.09; K2 is 1282.71 (USGS, 2001); and is
the spectral radiance.
Finally, the temperature in Celsius can be calculated as follows:
TC TK
2) Accuracy of Method
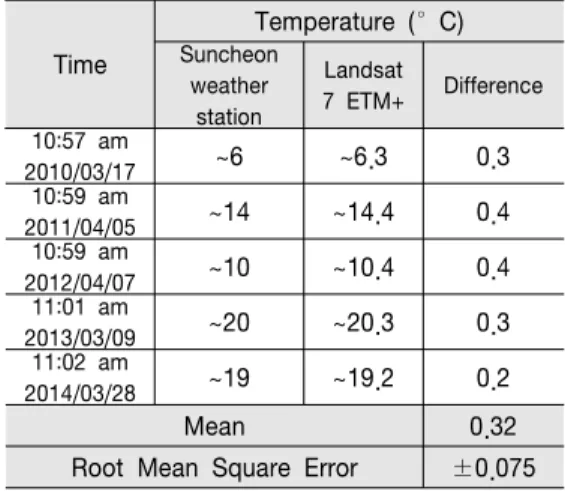
Table 4 presents temperature information from the five images corresponding to five subsequent years; all images were obtained around 11 am. On 2010/3/17 the real measured temperature at 11 am was around 6 degrees, while the temperature calculated from the Landsat 7 image at 10:57 am was around 6.32 degrees. Similarly, on 2011/4/5 the measured temperature at 11 am was around 14 degrees, while the calculated temperature at 10:59 am was around 14.36 degrees (The Weather Channel, LLC, 2015). This pattern was similar for all the other analyzed days, and the differences are not significant. From this, we can see that this method produces relatively accurate results.
Figure 3. Position of the Suncheon weather station
<Table 4> Comparison of surface temperatures measured at Suncheon weather station and temperatures calculated from Landsat 7 ETM+
images of the same area
Time
Temperature (°C) Suncheon
weather station
Landsat
7 ETM+ Difference 10:57 am
2010/03/17 ~6 ~6.3 0.3
10:59 am
2011/04/05 ~14 ~14.4 0.4
10:59 am
2012/04/07 ~10 ~10.4 0.4
11:01 am
2013/03/09 ~20 ~20.3 0.3
11:02 am
2014/03/28 ~19 ~19.2 0.2
Mean 0.32
Root Mean Square Error ±0.075
4. Result and Discussion
After collecting and processing the data from the Landsat 7 satellite images, we obtained the land surface temperatures. Figure 4 shows the spatial distribution of land surface temperatures in Gwangyang Steelworks in 2010. The brightest areas show where the temperatures are higher than around 25 degrees Celsius, whereas the darker areas have temperatures of around 7 to 10 degrees. With this image, the distribution of temperatures is very clear. In the true color satellite image, areas that are expected to show elevated surface temperatures are shown in red boxes. The thermal image on the right shows some dark stripes due to the fact that the Scan Line Corrector (SLC), which compensates for the forward motion of Landsat 7, failed on May
31, 2003. Without an operating SLC, the ETM+
line of sight now traces a zig-zag pattern along the satellite ground track. As a result, imaged area is duplicated, with a width that increases toward the full scene boundary.
Table 5 and Figure 5 show the average surface temperatures of the studied industrial complexes each year from 2010 to 2014. From this, it can be seen that the Gwangyang Steelworks has highest surface temperature among the four complexes, while Yulchon has the lowest surface temperature. The reason for this is that Gwangyang is steel factory, and during the processing of steels, they are heated, compressed, and transferred, so temperature emission is very high. Thus, the temperature in Gwangyang is between 3 and 5 degrees higher than in the other industrial zones.
Figure 4. Sample images of Gwangyang Steelworks in 2010; (Left) True Color image and
(Right) Temperature image
<Table 5> Surface temperatures at Yeosu, Gwangyang Steelworks, Deabul and Yulchon
Industrial Complexes from 2010 to 2014
Year Temperature (°C)
Yeosu Gwangyang Daebul Yulchon
2010 17.91 18.5 12.86 10.2
2011 24.73 28.54 24.19 21.4
2012 22.43 24.52 21.03 17.8
2013 21.81 25.8 20.31 19.97
2014 24.97 28.84 24.17 21.53
In contrast, the activities in the Yulchon Industrial Complex focus on the production of metals, machinery equipment, and electronic products, whose factories do not emit much heat.
Instead, heat emission is mainly due to the materials present inside the industrial zone, and so the temperature emission from the surface is the lowest among the four studied zones. The zone with the second largest surface temperature is the Yeosu Industrial Complex. This is a petrochemical industrial park, and its operating system comprises a large number of pipes and tanks to handle and analyze the products, so the surface heat emission is relatively high. Finally, Deabul is a shipyard; inside the factories are shipbuilding areas with ongoing soldering work and blowing fire. However, these areas are more concentrated across the region, and not as widespread as the heat-emitting factories in Gwangyang and Yeosu.
Figure 5. Surface temperatures at Yeosu, Gwangyang Steelworks, Deabul and Yulchon
Industrial Complexes from 2010 to 2014
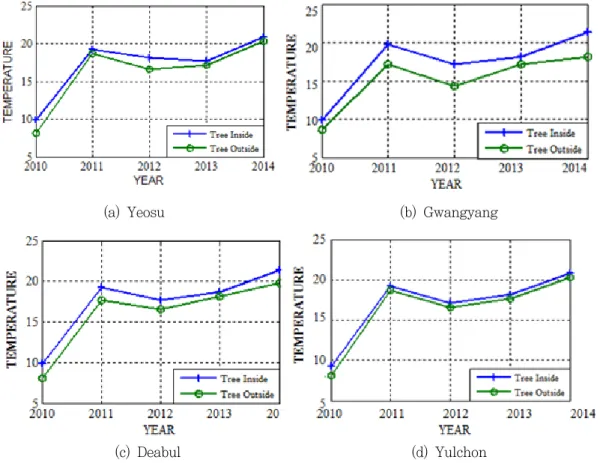
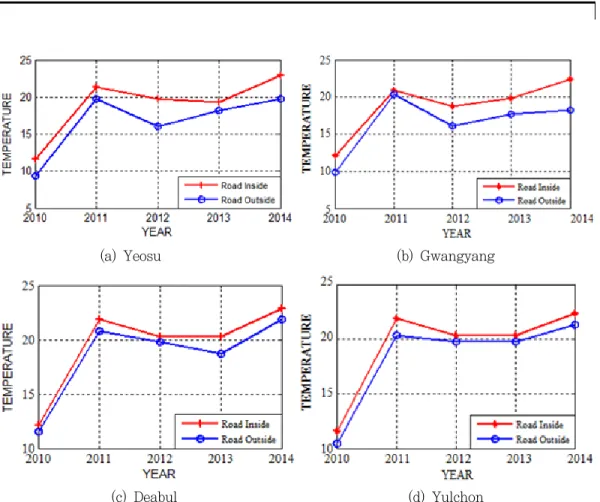
Table 6 and Table 7 show the temperatures obtained from tree and road targets within the industrial zones. From Figures 6 and 7 it can be seen that the temperatures of the tree and road targets are differing between the different complexes, but not significantly. Additionally, the temperatures of the different objects only differ by between 0.51 and 1.6 degrees, which may be explained by their similar properties.
<Table 6> Temperatures of tree targets in Yeosu, Gwangyang Steelworks, Deabul and Yulchon Industrial Complexes from 2010 to
2014
Year Temperature (°C)
Yeosu Gwangyang Daebul Yulchon
2010 9.85 9.84 9.85 9.27
2011 19.25 19.78 19.25 19.25
2012 18.18 17.12 17.67 17.12
2013 17.65 18.18 18.72 18.18
2014 20.83 21.35 21.35 20.83
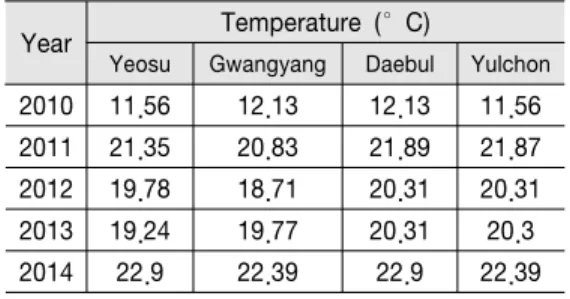
<Table 7> Temperatures of road targets in Yeosu, Gwangyang Steelworks, Deabul and Yulchon industrial complex from 2010 to 2014
Year Temperature (°C)
Yeosu Gwangyang Daebul Yulchon
2010 11.56 12.13 12.13 11.56
2011 21.35 20.83 21.89 21.87
2012 19.78 18.71 20.31 20.31
2013 19.24 19.77 20.31 20.3
2014 22.9 22.39 22.9 22.39
Figure 7 shows a comparison between the temperatures of tree objects inside the four industrial zones and outside the industrial zones.
Figure 8 presents a comparison between the temperatures of road objects inside the four industrial zones and those outside the four zones.
From this, the differences are quite clear, differing by around 1 to 4 degrees. The reason for this is likely to be that the trees and roads inside the industrial zones are affected by the heat emitted by the nearby industrial activities.
Objects outside the industrial complexes were also affected, but not to such a great degree as the objects inside. However, there are considerable differences in temperatures between different areas of each industrial complex. The spatial distribution of temperature is erratic and this should be the focus of future studies.
From the data above, it can be seen that the
development of industrial complexes, with their high heat emission, can alter the thermodynamic properties of soil, and the surface energy budget of the Earth. This can change the nature of regional atmospheric circulation, resulting in a large amount of wasted heat from factory activities, and leading to a series of changes in the environmental system.
5. Conclusion
Surface temperature can be directly derived from remotely sensed data. This provides a powerful tool for monitoring the environment both within and around industrial complexes, which can enhance our understanding of the urban environment (Moore and Paine, 2014).
The ETM+ thermal band, with a spatial resolution of 60 m, can assist in the estimation of surface temperature variations, providing more accurate estimations of urban temperature.
From this, it should be possible to develop optimal planning strategies for industrial complexes. For example, it is advisable to surround industrial areas with green belt buffers in order to reduce temperature increases and to lower pollution to within acceptable limits.
Figure 6. (Top) Tree and (Bottom) Road temperatures in Yeosu, Gwangyang Steelworks, Deabul and Yulchon Industrial Complexes from 2010 to 2014
(a) Yeosu (b) Gwangyang
(c) Deabul (d) Yulchon
Figure 7. Tree temperatures from the inside and the outside of industrial complex areas from 2010 to 2014
(a) Yeosu (b) Gwangyang
(c) Deabul (d) Yulchon
Figure 8. Road temperatures from the inside and the outside of industrial complex areas from 2010 to 2014
<References>
1. Akhoondzadeh, M., Saradjian, M.R., 2008, Comparison of land surface temperature mapping using MODIS and ASTER images in semi-arid area, The International Archives of the Photogrammetry, Remote Sensing and Spatial Information Sciences, XXXVII(B8), Beijing 2008, pp.873–876.
2. Dugord, P.A., Lauf, S., Schuster, C., Kleinschmit, B., 2014, Land use patterns, temperature distribution, and potential heat stress risk – The case study Berlin, Germany, Computers, Environment and Urban Systems, 48, pp.86-98.
3. El-Nahry, A.H., Rashash, A., 2010, Impact of industrial areas on surface temperature using thermal infrared remote sensing and GIS techniques, a case of Jubail city, KSA, The 8th National GIS Symposium in Saudi Arbia.
(http://www.saudigis.org/FCKFiles/File/8th_GIS _Program/Papers/33_Abdel_Nasser_Ali.pdf) 4. ITT Visual Information Solutions, 2009,
Getting started with ENVI.
(www.exelisvis.com/portals/0/pdfs/envi/getting_
started_with_envi.pdf)
5. Kim, P., Ahn, H., 2013, Jeollanam-do! Your new gateway to Asian market, Jeollanam-do Europe Representative Office.
6. [LPSO] Landsat Project Science Office at NASA's Goddard Space Flight Center, Landsat
7 Science Data Users Handbook [internet], Maryland : NASA.
(http://landsathandbook.gsfc.nasa.gov/pdfs/Land sat7_Handbook.pdf)
7. Li, J.J., Wang, X.R., Wang, X.J., Ma, W.C., Zhang, H., 2009, Remote sensing evaluation of urban heat island and its spatial pattern of the Shanghai metropolitan area, China, Ecological Complexity, 6(4), pp.413–420.
8. Moore, G., Paine, R., 2014, Quantifying urban-rural temperature differences for industrial complexes using thermal satellite data, EPA Regional, State, and Local Modelers' Workshop - May 20, 2014, Salt Lake City, Utah.
(https://www.steel.org/~/media/Files/AISI/Public Policy/Enviroment/Analysis of ICHI Using Thermal Satellite Data_28apr14.pdf)
9. Rajeshwari, A., Mani, N.D., 2014, Estimation of land surface temperature of Dindigul district using Landsat 8 data, International Journal of Research in Engineering and Technology, 3(5), pp.122-126.
10. Rinner, C., Hussain, M., 2011, Toronto’s urban heat island - exploring the relationship between land use and surface temperature, Remote Sensing, 3, pp.1251-1265.
11. The Weather Channel, LLC, 2015, Historical weather, Weather Underground.
(http://www.wunderground.com/history/) 12. Van, T.T., Bao, H.D.X., 2010, Study of the
impact of urban development on surface temperature using remote sensing in Ho Chi Minh City, Northern Vietnam, Geographical Research, 48(1), pp.86-96.
13. Weng, Q., Lu, D., Schubring, J., 2004, Estimation of land surface temperature vegetation abundance relationship for urban heat island studies, Remote Sensing of Environment, 89(4), pp.467-483.
Landsat 7 ETM+ 위성영상을 이용한 전남산업단지의 지표온도
Nguyen Truong Linh · Tran Quang Huy · 허정원 · 한동엽
국문요약 : 기상관측망은 충분히 고밀도로 구축되어 있기 않기 때문에 산업지역의 전체 지표온도를 얻기는 쉽지 않다. 넓은 지역에 걸쳐 취득하고 짧은 시간에 처리할 수 있는 다기능 원격탐사 정보를 통 하여 특정지역에서 현재의 변화하는 지표온도를 정확하고 연속적으로 관측할 수 있다. 전라남도는 광양 제철소, 여수산업단지, 율촌산업단지, 대불산업단지와 같은 많은 산업단지와 함께 빠르게 산업화되고 있 다. 산업단지 내 지표온도 특성을 살펴보기 위하여 본 연구는 Landsat 7 ETM+의 열적외 파장영상을 이용하여 4개의 산업단지의 지표온도를 비교하였다. 이로부터 환경적 자연적 자원관리를 위한 산업단지 의 기초자료를 얻을 수 있었다. 연구 결과는 산업단지계획가에서 환경적 문제와 관련된 개발방식에 도 움을 줄 수 있다.
주제어 : 원격탐사, Landsat 7 ETM+, 열 밴드, 지표 온도, 전라남도, 산업단지
(게재신청 2015.08.08, 심사일자 2015.08.20, 게재확정 2015.09.01.) 주저자: Nguyen Truong Linh, 교신저자: 한동엽