1. Introduction
The global to local vegetation patterns needs to be studied to understand effects in human societies by environmental changes and phenomena. Moreover, since the human activity has profoundly affected ecosystems, vegetation changes must be monitored and predicted (Pettorelli et al., 2005). Remote sensing data acquired from different sensors have been commonly used to monitor and characterize vegetation information (Shi et al., 2008). Among the various parameters, the VI (Vegetation Index) derived from http://dx.doi.org/10.7848/ksgpc.2015.33.6.547
Development of a Fusion Vegetation Index Using Full-PolSAR and Multispectral Data
Kim, Yong-Hyun1)ㆍOh, Jae-Hong2)ㆍKim, Yong-Il3)
Abstract
The vegetation index is a crucial parameter in many biophysical studies of vegetation, and is also a valuable content in ecological processes researching. The OVIs (Optical Vegetation Index) that of using multispectral and hyperspectral data have been widely investigated in the literature, while the RVI (Radar Vegetation Index) that of considering volume scattering measurement has been paid relatively little attention. Also, there was only some efforts have been put to fuse the OVI with the RVI as an integrated vegetation index. To address this issue, this paper presents a novel FVI (Fusion Vegetation Index) that uses multispectral and full-PolSAR (Polarimetric Synthetic Aperture Radar) data. By fusing a NDVI (Normalized Difference Vegetation Index) of RapidEye and an RVI of C-band Radarsat-2, we demonstrated that the proposed FVI has higher separability in different vegetation types than only with OVI and RVI. Also, the experimental results show that the proposed index not only has information on the vegetation greenness of the NDVI, but also has information on the canopy structure of the RVI. Based on this preliminary result, since the vegetation monitoring is more detailed, it could be possible in various application fields; this synergistic FVI will be further developed in the future.
Keywords : Multispectral Vegetation Index, Radar Vegetation Index, Fusion Vegetation Index
547 Original article
Received 2015. 11. 30, Revised 2015. 12. 16, Accepted 2015. 12. 19
1) Member, Dept. of Civil and Environmental Engineering, Seoul National University (E-mail: [email protected]) 2) Corresponding Author, Member, Dept. of Civil Engineering, Chonnam National University (E-mail: [email protected]) 3) Member, Dept. of Civil and Environmental Engineering, Seoul National University (E-mail: [email protected])
This is an Open Access article distributed under the terms of the Creative Commons Attribution Non-Commercial License (http://
creativecommons.org/licenses/by-nc/3.0) which permits unrestricted non-commercial use, distribution, and reproduction in any medium, provided the original work is properly cited.
satellite data is the most commonly used for analyzing the characteristics of a vegetated land surface (Zhang, 2015).
The VI is a mathematical combination or transformation of specific bands that accentuate the properties of green plants in order to distinguish them from other land covers (Jackson and Huete, 1991).
Two types of VIs are used for vegetation applications. The first VI is an OVI that uses a multispectral and hyperspectral sensor. It is not only a key source of information in vegetation conditions but also in forest studies and crop monitoring (Kuenzer and Knauer, 2013). The use of the OVI has been
548
proposed for determining the vegetation conditions from different portions of the wavelength. Among the various OVIs, the NDVI is a popular and standard index (Gao, 1996). It is increasingly used in indirectly study of the biophysical properties of vegetation. However, the NDVI has a few problems, such as soil background variations and saturation in the high vegetation densities (Huete, 1988).
In microwave remote sensing, the RVI was introduced as an index of the volume scattering media, such as vegetation canopies (Kim and Van Zyl, 2009). This parameter also measures the randomness in the scattering. The RVI was evaluated by modeling a vegetation canopy by collecting random oriented cylinders with different lengths and diameters. It has been used as the level of crop growth indicator, particularly when time series data is available (Kim et al., 2012). In particular, RVI measures the vegetation structure, which is independent of the vegetation greenness and vigor, both of which properties measured by OVIs (McColl et al., 2014).
The studies on OVI and RVI have had some promising results for various applications. The OVI is mainly related to the photosynthetic activity of vegetation, while the RVI is primarily related to the canopy structure of vegetation.
In other words, the OVI and the RVI of representing complementary information are useful for vegetation monitoring, but there was less efforts in fusing them as a single VI. Furthermore, the possible synergic fusion of the OVI and RVI has not been explored, although it has been expected to contribute in vegetation monitoring. To address this issue, we present a novel FVI that utilizes the NDVI and the RVI as a single VI. To fuse the NDVI and RVI, the proposed FVI was firstly simulated for numerical analysis. At next, experiments were conducted by using C-band Radarsat-2 and RapidEye data in two different areas. Finally, the experiment results were evaluated and demonstrated that the FVI has high separability in different types of vegetation, unlike the NDVI or the RVI. This paper organized by following sections; in section 2, the NDVI and RVI will be briefly introduced with presenting the proposed FVI, while each of the section 3 and 4 will draw results and discussions and conclusions.
2. Methodology
This section reviews the NDVI and the RVI with brief discussion their characteristics, so as introduces a novel FVI. For achieving ideal status, the reflectance values to compute the NDVI must be radiometrically and atmospherically corrected. Thus, the RapidEye data, the FLAASH (Fast Line-of-sight Atmospheric Analysis of Spectral Hypercubes) algorithm was used to correct these effects (Matthew et al., 2000). Additionally, a Refined Lee filter was applied to reduce the speckle noise of Radarsat-2 (Lee et al., 1991). An increased filter size could reduce the speckle noise, and also lowers the spatial resolution. For that reason, we selected a 7x7 filter size.
2.1 Normalized difference vegetation index Those OVIs are usually dimensionless measurement that derived from radiometric data, which are primarily used to indicate the amount of green vegetation. Among the various OVIs, the NDVI has been the most widely used in various applications. The NDVI indicates the difference between the NIR (Near-InfraRed) and the red bands, divided by their sum. It is defined as.
NIR Red NIR Red
NDVI r r
r r
= - + rNIR rRed
8 2 HV
HH HV VV
RVI s
s s s
= + +
sHV sHH sVV
( )
FVI NDVI= ´ RVI+a a +(a+1) -(a+1)
1 2
2 2
1 2
ND m m s s
= - + m1 m2 s1 s2 a
(1)
where NIR Red NIR Red
NDVI r r
r r
= - + rNIR rRed
8 2 HV
HH HV VV
RVI s
s s s
= + +
sHV sHH sVV
( )
FVI NDVI= ´ RVI+a a +(a+1) -(a+1)
1 2
2 2
1 2
ND m m s s
= - + m1 m2 s1 s2 a
and NIR Red NIR Red
NDVI r r
r r
= - + rNIR rRed
8 2 HV
HH HV VV
RVI s
s s s
= + +
sHV sHH sVV
( )
FVI NDVI= ´ RVI+a a +(a+1) -(a+1)
1 2
2 2
1 2
ND m m s s
= - + m1 m2 s1 s2 a
are the reflectance values of the NIR and red bands, respectively. The NDVI, which depends mainly on the green leaf material of the vegetation cover, is a foundation of the most recent indices (Huete, 1988).
Although the NDVI remains one of the most effective VI, it has some disadvantages; it is the inherent non-linearity of ratio-based indices, and vulnerable to additive noise effects. Also, it indicates saturated values over high biomass conditions. Moreover, a major limitation of the NDVI and those similar indices is that the optical sensors can only monitor a very thin layer of the canopy (Shi et al., 2008).
In fact, those problems can be solved by fusing the NDVI with the RVI.
2.2 Radar vegetation index
In the microwave regions of electromagnetic spectrum,
549 the intensity of the incident energy scattered by vegetation
is primarily a function of the canopy architectures, such as the size, shape, and orientation of the canopy components and the dielectric properties (Koppe et al., 2013). The RVI has proposed in applying to estimate vegetation properties relevant to radar-only soil moisture retrieval algorithms (Kim and Van Zyl, 2009). The RVI is a measure of volume scattering that is typically caused by the structural elements of vegetation canopies, and is defined as;
NIR Red NIR Red
NDVI r r
r r
= - + rNIR rRed
8 2 HV
HH HV VV
RVI s
s s s
= + +
sHV sHH sVV
( )
FVI NDVI= ´ RVI+a a +(a+1) -(a+1)
1 2
2 2
1 2
ND m m s s
= - + m1 m2 s1 s2 a
(2)
where
NIR Red NIR Red
NDVI r r
r r
= - + rNIR rRed
8 2 HV
HH HV VV
RVI s
s s s
= + +
sHV sHH sVV
( )
FVI NDVI= ´ RVI+a a +(a+1) -(a+1)
1 2
2 2
1 2
ND m m s s
= - + m1 m2 s1 s2 a
nis the cross-polarization backscattering cross-section, while
NIR Red NIR Red
NDVI r r
r r
= - + rNIR rRed
8 2 HV
HH HV VV
RVI s
s s s
= + +
sHV sHH sVV
( )
FVI NDVI= ´ RVI+a a +(a+1) -(a+1)
1 2
2 2
1 2
ND m m s s
= - + m1 m2 s1 s2 a
and
NIR Red NIR Red
NDVI r r
r r
= - + rNIR rRed
8 2 HV
HH HV VV
RVI s
s s s
= + +
sHV sHH sVV
( )
FVI NDVI= ´ RVI+a a +(a+1) -(a+1)
1 2
2 2
1 2
ND m m s s
= - + m1 m2 s1 s2 a
refer the co-polarization backscattering cross-sections represented in power units. The RVI generally ranged from 0 to 1. It is near zero for a smooth bare surface, but it is increasing following to the vegetation growth. Also, it has shown some promising results in the vegetation field, especially in crop monitoring (Kim et al., 2012). Unfortunately, the RVI also has some disadvantages; the speckle noise occurs in the SAR (Synthetic Aperture Radar) data. It is an inherent consequence in the coherent radar, which arises due to electromagnetic interactions with multiple scattering centers within a single resolution element of the radar rather than actual variation. The RVI showed vulnerable particularly to errors in the calibration offset term over sparsely vegetated regions and overestimated in some arid regions (McColl et al., 2014). Also, the RVI can result in an incorrect value in urban areas due to the POA (Polarization Orientation Angle) shifts. In other words, if the direction of normal to vertical wall of a building is off the incidence plane, the dihedral structure contributes to the yielding of the cross-polarization components (Iribe and Sato, 2007). For that reason, the POA shifts lead to high RVI values in some oriented urban areas. In fact, those problems of the RVI can be solved by fusing it with the NDVI.
2.3 Fusion vegetation index
The VI should theoretically reflect those three; the amount of vegetation, the architecture of the vegetation, and the
degree of vegetation vigor (Zhang et al., 2007). To benefit from both optical and SAR data, this paper presents an FVI that uses complementary information from both systems.
In vegetation monitoring, the important goal of the using the VI is on enhanced the measurement of the greenness and the vegetation structure. The greenness information and the photosynthetic activity can be recognized from the OVIs, such as the NDVI. Additionally, the canopy architectures that may prove useful in distinguishing between different types of canopies can be extracted from the RVI. However, the RVI has speckle noise and often indicates urban areas as being vegetation areas. The first problem is naturally in the SAR system, but the second problem is an unwanted false alarm. Therefore, the direct sum of NDVI and RVI may not be suitable for fusing the NDVI and RVI, which led us assuming that the FVI can be obtained by the injection of necessary RVI into the NDVI.
As the FVI can be less noisy than the RVI, we can tell the assumption is reasonable. The FVI can have lower values in the POA shifted urban areas due to below 0 representing urban area in the NDVI. In fact, Many mathematical representations of VIs are available. Similarly, many mathematical formations of FVI are possible. To fuse the NDVI with the RVI, this study proposes a novel FVI that can be formulated as follows:
NIR Red NIR Red
NDVI r r
r r
= - + rNIR rRed
8 2 HV
HH HV VV
RVI s
s s s
= + +
sHV sHH sVV
( )
FVI NDVI= ´ RVI+a a +(a+1) -(a+1)
1 2
2 2
1 2
ND m m s s
= - + m1 m2 s1 s2 a
(3) wherein
NIR Red NIR Red
NDVI r r
r r
= - + rNIR rRed
8 2 HV
HH HV VV
RVI s
s s s
= + +
sHV sHH sVV
( )
FVI NDVI= ´ RVI+a a +(a+1) -(a+1)
1 2
2 2
1 2
ND m m s s
= - + m1 m2 s1 s2 a
is the modulation coefficient for the trade- off. Because the maximum value of the NDVI is 1, RVI+
NIR Red NIR Red
NDVI r r
r r
= - + rNIR rRed
8 2 HV
HH HV VV
RVI s
s s s
= + +
sHV sHH sVV
( )
FVI NDVI= ´ RVI+a a +(a+1) -(a+1)
1 2
2 2
1 2
ND m m s s
= - + m1 m2 s1 s2 a
must be greater than or equal to 1 to effectively enhance the vegetation structures. Equation (3) can generate the FVI by injecting the canopy information of the RVI into the NDVI.
If the
NIR Red NIR Red
NDVI r r
r r
= - + rNIR rRed
8 2 HV
HH HV VV
RVI s
s s s
= + +
sHV sHH sVV
( )
FVI NDVI= ´ RVI+a a +(a+1) -(a+1)
1 2
2 2
1 2
ND m m s s
= - + m1 m2 s1 s2 a
value increases, the FVI converges towards the NDVI. If RVI+
NIR Red NIR Red
NDVI r r
r r
= - + rNIR rRed
8 2 HV
HH HV VV
RVI s
s s s
= + +
sHV sHH sVV
( )
FVI NDVI= ´ RVI+a a +(a+1) -(a+1)
1 2
2 2
1 2
ND m m s s
= - + m1 m2 s1 s2 a
=1, the FVI is equal to the NDVI, while the FVI ranges from +(
NIR Red NIR Red
NDVI r r
r r
= - + rNIR rRed
8 2 HV
HH HV VV
RVI s
s s s
= + +
sHV sHH sVV
( )
FVI NDVI= ´ RVI+a a +(a+1) -(a+1)
1 2
2 2
1 2
ND m m s s
= - + m1 m2 s1 s2 a
+1) to -(
NIR Red NIR Red
NDVI r r
r r
= - + rNIR rRed
8 2 HV
HH HV VV
RVI s
s s s
= + +
sHV sHH sVV
( )
FVI NDVI= ´ RVI+a a +(a+1) -(a+1)
1 2
2 2
1 2
ND m m s s
= - + m1 m2 s1 s2 a
+1) in non-negative
NIR Red NIR Red
NDVI r r
r r
= - + rNIR rRed
8 2 HV
HH HV VV
RVI s
s s s
= + +
sHV sHH sVV
( )
FVI NDVI= ´ RVI+a a +(a+1) -(a+1)
1 2
2 2
1 2
ND m m s s
= - + m1 m2 s1 s2 a
values. Therefore, we expect a reasonable contrast in the FVI between the vegetated and non-vegetated land-covers.
To our knowledge, this is the first attempt to fuse the RVI and the NDVI. This fusion could suggest a solution to the saturation problem of the NDVI. In the next subsection, we simulate the FVI with changes in the
NIR Red NIR Red
NDVI r r
r r
= - + rNIR rRed
8 2 HV
HH HV VV
RVI s
s s s
= + +
sHV sHH sVV
( )
FVI NDVI= ´ RVI+a a +(a+1) -(a+1)
1 2
2 2
1 2
ND m m s s
= - + m1 m2 s1 s2 a
values.
550
2.4 Simulation results
A numerical analysis was conducted to simulate the FVI in accordance with the changes in the
NIR Red NIR Red
NDVI r r
r r
= - + rNIR rRed
8 2 HV
HH HV VV
RVI s
s s s
= + +
sHV sHH sVV
( )
FVI NDVI= ´ RVI+a a +(a+1) -(a+1)
1 2
2 2
1 2
ND m m
s s
= - + m1 m2 s1 s2 a
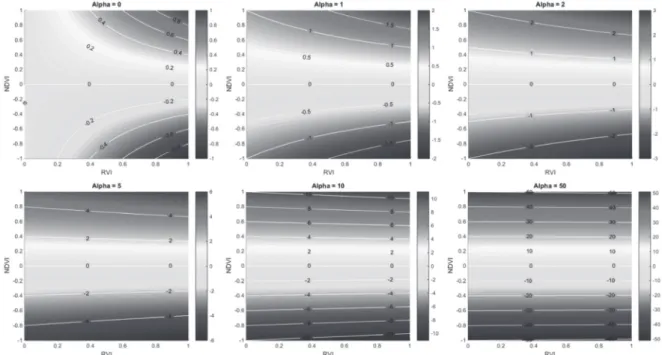
values. The Fig.
1 described the theoretically discussed results with the contour plot of showing a constant FVI along the RVI and the NDVI. The contour plot in Fig. 1 reflects that contour lines of the FVI are symmetrical to the NDVI and equal to the zero line. In addition, the FVI converges towards the NDVI, as the
NIR Red NIR Red
NDVI r r
r r
= - + rNIR rRed
8 2 HV
HH HV VV
RVI s
s s s
= + +
sHV sHH sVV
( )
FVI NDVI= ´ RVI+a a +(a+1) -(a+1)
1 2
2 2
1 2
ND m m
s s
= - + m1 m2 s1 s2 a
values increase. Thus, a considerable
NIR Red NIR Red
NDVI r r
r r
= - + rNIR rRed
8 2 HV
HH HV VV
RVI s
s s s
= + +
sHV sHH sVV
( )
FVI NDVI= ´ RVI+a a +(a+1) -(a+1)
1 2
2 2
1 2
ND m m
s s
= - + m1 m2 s1 s2 a
value is meaningless and does not represent any RVI information. It was observed from that the increased RVI+
NIR Red NIR Red
NDVI r r
r r
= - + rNIR rRed
8 2 HV
HH HV VV
RVI s
s s s
= + +
sHV sHH sVV
( )
FVI NDVI= ´ RVI+a a +(a+1) -(a+1)
1 2
2 2
1 2
ND m m
s s
= - + m1 m2 s1 s2 a
value led to a large FVI and that the rate of growth of the FVI was higher for lower values of the RVI (see
NIR Red NIR Red
NDVI r r
r r
= - + rNIR rRed
8 2 HV
HH HV VV
RVI s
s s s
= + +
sHV sHH sVV
( )
FVI NDVI= ´ RVI+a a +(a+1) -(a+1)
1 2
2 2
1 2
ND m m
s s
= - + m1 m2 s1 s2 a
= 1 in Fig.
1). In
NIR Red NIR Red
NDVI r r
r r
= - + rNIR rRed
8 2 HV
HH HV VV
RVI s
s s s
= + +
sHV sHH sVV
( )
FVI NDVI= ´ RVI+a a +(a+1) -(a+1)
1 2
2 2
1 2
ND m m
s s
= - + m1 m2 s1 s2 a
= 0, the FVI does not have any information of the RVI in less than 0.2 RVI. Also, in
NIR Red NIR Red
NDVI r r
r r
= - + rNIR rRed
8 2 HV
HH HV VV
RVI s
s s s
= + +
sHV sHH sVV
( )
FVI NDVI= ´ RVI+a a +(a+1) -(a+1)
1 2
2 2
1 2
ND m m
s s
= - + m1 m2 s1 s2 a
= 0, the speckle noise of RVI could be directly inserted into the FVI, whereas the maximum value of RVI and NDVI is 1. To adequately enhance the vegetation condition, the appropriate
NIR Red NIR Red
NDVI r r
r r
= - + rNIR rRed
8 2 HV
HH HV VV
RVI s
s s s
= + +
sHV sHH sVV
( )
FVI NDVI= ´ RVI+a a +(a+1) -(a+1)
1 2
2 2
1 2
ND m m
s s
= - + m1 m2 s1 s2 a
value was set to fuse the NDVI with the RVI. In this study, since the simulation results showed that the
NIR Red NIR Red
NDVI r r
r r
= - + rNIR rRed
8 2 HV
HH HV VV
RVI s
s s s
= + +
sHV sHH sVV
( )
FVI NDVI= ´ RVI+a a +(a+1) -(a+1)
1 2
2 2
1 2
ND m m
s s
= - + m1 m2 s1 s2 a
=1 value effectively injected the RVI information into the FVI information, we set
NIR Red NIR Red
NDVI r r
r r
= - + rNIR rRed
8 2 HV
HH HV VV
RVI s
s s s
= + +
sHV sHH sVV
( )
FVI NDVI= ´ RVI+a a +(a+1) -(a+1)
1 2
2 2
1 2
ND m m
s s
= - + m1 m2 s1 s2 a
= 1. In the following section, the experiment results Fig. 1. Contour plot of FVI corresponding to change in the
NIR Red NIR Red
NDVI r r
r r
= - + rNIR rRed
8 2 HV
HH HV VV
RVI s
s s s
= + +
sHV sHH sVV
( )
FVI NDVI= ´ RVI+a a +(a+1) -(a+1)
1 2
2 2
1 2
ND m m
s s
= - + m1 m2 s1 s2 a
values with the RVI and the NDVI
Fig. 2. Used RapidEye and Radarsat-2 (a) RapidEye (NIR-G-B color composite), (b) the Radarsat-2 (Pauli R-G-B combination) in study area 1, and (c) RapidEye (R-G-B color composite) and (d) Radarsat-2 (Pauli R-G-B combination) in study area 2
(a) (b) (c) (d)
551 for the two study areas are presented and discussed.
3. Results 3.1 Study areas
The Study Area 1 is Dangjin City in South Korea. The test site mainly covers a large number of agricultural fields, as well as several forested areas, urban areas, and bodies of water. In this area, the RapidEye data were acquired on August 5, 2012, as the Radarsat-2 data were acquired on August 12, 2012. The Study Area 2 is Daejeon City in South Korea, where includes mainly urban areas, as well as forested areas and bodies of water. In this area, the RapidEye data and the Radarsat-2 data were acquired on May 5, 2013 and May 3, 2013, respectively. Those two Study Areas are shown in Fig. 2; those RapidEye and Radarsat-2 have short time lags in these two datasets that are suitable for a multisensory fusion study. Also, the Radarsat-2 single-look complex data were georeferenced to the UTM (Universal Transverse Mercator) Zone 52 South projection with the
WGS-84 (World Geodetic System 1984) as the datum, using the range-Doppler model and the SRTM (Shuttle Radar Topography Mission). The Radarsat-2 has the same pixel spacing as RapidEye orthorectified product 3A that led to the assumption of a priori geometrically registered and superimposed RapidEye and Radarsat-2 data.
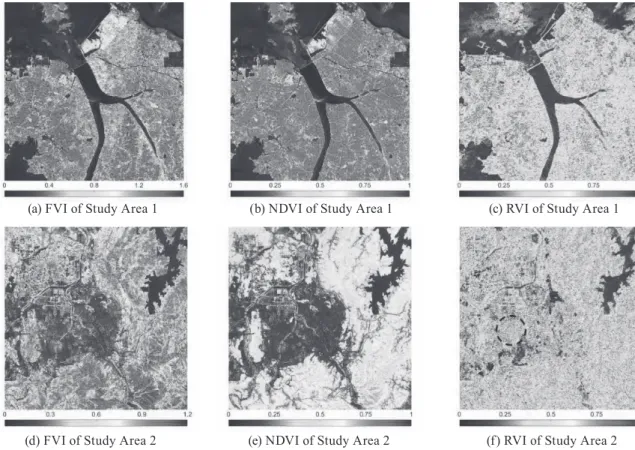
3.2 Results and discussion
The FVI was compared with the NDVI and the RVI to present a general understanding of the FVI, NDVI, and RVI from the RapidEye and Radarsat-2 data. To explore the results, the histograms of FVI were compared with those of the NDVI and the RVI. The histograms of Study Areas 1 and 2 are shown in Fig. 3. The FVI histograms are similar to the NDVI histograms, but slightly differ. In Study Area 1, the frequencies of lower FVI values were increased because the vegetation which has high NDVI values and low RVI values shifted to lower FVI values. It could be inferred that this vegetation is a rice crop, which has a smaller canopy structure than the forest. In Study Area 2, the frequencies
(a) FVI of Study Area 1
(d) FVI of Study Area 2
(b) NDVI of Study Area 1
(e) NDVI of Study Area 2
(c) RVI of Study Area 1
(f) RVI of Study Area 2 Fig. 3. Histograms of the FVI, NDVI, and RVI in the two study areas
552
(a) FVI of Study Area 1 (b) NDVI of Study Area 1 (c) RVI of Study Area 1
(d) FVI of Study Area 2 (e) NDVI of Study Area 2 (f) RVI of Study Area 2 Fig. 4. Results of the FVI, NDVI, and RVI in two study areas
(a) (b)
(d) (c)
Fig. 5. Subset imagery of study area 1. (a) FVI, (b) NDVI, (c) RVI, and (d) density plot of the FVI and the NDVI