식생가뭄반응지수 (VegDRI)를 활용한 위성영상 기반 가뭄 평가
Satellite-based Hybrid Drought Assessment using Vegetation Drought Response Index in South Korea (VegDRI-SKorea)
남원호*・ Tsegaye Tadesse**・ Brian D. Wardlow***・ 장민원****,†・ 홍석영*****
Nam, Won-Ho・ Tsegaye Tadesse ・ Brian D. Wardlow ・ Jang, Min-Won ・ Hong, Suk-Young
Abstract
The development of drought index that provides detailed-spatial-resolution drought information is essential for improving drought planning and preparedness. The objective of this study was to develop the concept of using satellite-based hybrid drought index called the Vegetation Drought Response Index in South Korea (VegDRI-SKorea) that could improve spatial resolution for monitoring local and regional drought. The VegDRI-SKorea was developed using the Classification And Regression Trees (CART) algorithm based on remote sensing data such as Normalized Difference Vegetation Index (NDVI) from MODIS satellite images, climate drought indices such as Self Calibrating Palmer Drought Severity Index (SC-PDSI) and Standardized Precipitation Index (SPI), and the biophysical data such as land cover, eco region, and soil available water capacity. A case study has been done for the 2012 drought to evaluate the VegDRI-SKorea model for South Korea. The VegDRI-SKorea represented the drought areas from the end of May and to the severe drought at the end of June. Results show that the integration of satellite imageries and various associated data allows us to get improved both spatially and temporally drought information using a data mining technique and get better understanding of drought condition. In addition, VegDRI-SKorea is expected to contribute to monitor the current drought condition for evaluating local and regional drought risk assessment and assisting drought-related decision making.
Keywords: classification and regression trees algorithm (CART); data mining technique; drought assessment; normalized difference vegetation index (NDVI); vegetation drought response index (VegDRI)
* National Drought Mitigation Center, University of Nebraska- Lincoln, Lincoln, NE, USA
** National Drought Mitigation Center, School of Natural Resources, University of Nebraska-Lincoln, Lincoln, NE, USA
*** Center for Advanced Land Management Information Technologies, School of Natural Resources, University of Nebraska-Lincoln, Lincoln, NE, USA
**** Department of Agricultural Engineering, Institute of Agriculture
& Life Science, Gyeongsang National University, Jinju, Republic of Korea
*****National Academy of Agricultural Science, Rural Development Administration
† Corresponding author
Tel.: +82-55-772-1933 Fax: +82-55-772-1939 E-mail: [email protected]
Received: January 13, 2015 Revised: April 27, 2015 Accepted: April 29, 2015
Ⅰ. 서 론
기후변화로 인한 전 세계적인 온난화 현상으로 인하여 극 심한 가뭄의 발생빈도가 높아지고 사회적, 경제적, 환경적 피 해가 대형화되어 가는 추세이다 (Wilhite et al., 2000). 국립해 양기상청 (National Oceanic and Atmospheric Administration,
NOAA)이 발표하는 재해유형별 경제손실액 보고서 (Smith and Katz, 2013)에 의하면 가뭄에 의한 경제적 손실은 홍수에 비해 2 배 이상이며, 1980년 이후 가뭄의 발생빈도는 전체 재 해빈도 중 14 %에 해당하지만 그 피해액은 전체 재해피해액 25 %를 차지하고 있다 (Nam et al., 2014). 이처럼 가뭄은 자 연재난 중 홍수, 산사태 등 기타 재난과 비교하여 영향면적이 넓고 상대적으로 장기간에 걸쳐 영향을 받기 때문에, 전 세계 적으로 다양한 가뭄지수가 개발되어 가뭄의 심도 (severity) 를 정량화하고, 가뭄의 전조를 감지하며 가뭄이 진행되는 영 향 범위를 파악하는 연구가 진행되었다 (Hayes et al., 2004;
Wilhite et al., 2007; Nam et al., 2012a).
가뭄의 평가를 위해 일반적으로 사용하는 가뭄지수는 기 상학적 가뭄지수인 표준강수지수 (Standardized Precipitation Index, SPI)와 강수량 및 유효토양수분량에 근거하여 가뭄을 판단하는 파머가뭄심도지수 (Palmer Drought Severity Index, PDSI) 및 강수량과 증발산의 변동성을 고려한 표준강수증발 산지수 (Standardized Precipitation Evapotranspiration Index, SPEI)를 사용하고 있다 (Hayes et al., 2011; Hunt et al., 2014;
Svoboda et al., 2015). 이 지수들은 적용 대상 지역의 지형 및 기상 특성, 자료수집의 제한성 등을 고려하여 다양한 유관기
간에서 가뭄상황을 모니터링하기 위한 공간지도 형태로 가뭄 지수를 제공하고 있다 (Nam et al., 2012b). 하지만 제공되고 있는 가뭄지수의 공간분포는 지점 자료를 기반으로 내삽기법 (interpolation)을 통해 재 산정된 지도로 공간 해상도 측면에 서 조악한 해상도를 갖고 있는 한계점이 있다 (Tadesse et al., 2005).
이와 같은 한계점을 보완하기 위하여 주기적이고 동일한 정확도로 지상 자료의 획득이 가능하다는 측면에서 인공위성 을 활용한 가뭄 분석 연구의 필요성이 대두되었다. 재해관리 분야에서 원격탐사 기술은 재해 발생을 인지하고 발생지역의 재해 진행과 피해 정도를 신속하게 제공할 수 있다는 점에서 효용성이 높다 (Hayes et al., 2011). 특히 가뭄은 국지적으로 영향을 미치는 다른 재해들과는 다르게 광범위한 지역에 발 생하고 식생 발달과 밀접한 관계를 갖기 때문에 위성영상으 로부터 식생의 발달 정도를 평가하고 식생지수를 계산함으로 써 가뭄의 크기를 계량화하는 연구가 수행되었다 (Tadesse et al., 2015).
인공위성을 활용한 가뭄 분석의 기본 개념은 가뭄으로 인 한 식생의 활성도 저하 및 지표면 온도의 상승으로 이어지는 현상을 위성영상으로부터 포착하여 가뭄현상을 파악하는 것 이다 (Brown et al., 2008). 위성 영상을 이용할 경우 접근이 용이하지 못한 지역의 조사가 수월하며, 장기적인 변화관측 이나 환경감시 등에 유용하고 시공간적으로 변화가 심한 요 소의 관측과 광역적 접근이 가능하다 (Tadesse et al., 2005;
Shin et al., 2006; Swain et al., 2011). 국외의 경우 국립해양 기상청, 미국항공우주국 (National Aeronautics and Space Administration, NASA), 국립가뭄경감센터 (National Drought Mitigation Center, NDMC, http://drought.unl.edu) 등 국공 립기관에서 원격탐사기술 (remote sensing)과 위성영상을 활 용하여 식생의 변화를 정기적으로 예측하고, 가뭄예보 및 모 니터링 시스템을 구축하여 웹을 통하여 주기적 보고하고 이 를 정책적으로 활용하고 있다 (Tadesse et al., 2010; Otkin et al., 2014).
국내의 경우 정규식생지수 (Normalized Difference Vege- tation Index, NDVI) 및 식생상태지수 (Vegetation Condition Index, VCI)를 활용하여 기후학적 물수지에 근거하는 광역적 인 가뭄 분석을 수행하였다 (Shin and Kim, 2003; Shin and Eoh, 2004). Jang et al. (2007)은 북한 전역의 NDVI를 분석 함으로써 1998년부터 2001년까지 북한의 가뭄 평가를 수행 하였으며, Park and Kim (2009) 및 Ahn et al. (2014)은 기상 및 기상학적 가뭄지수와 NDVI와의 상관성을 제시함으로써 가뭄평가를 위한 NDVI의 활용성을 제시한 바 있다. Sur et al.
(2014)은 다중분광센서인 MODIS (MODerate resolution
Imaging Spectroradiometer)를 활용하여 잠재 증발산량과 실 제 증발산량의 비를 이용한 가뭄지수인 Evaporative Stress Index (ESI)를 국내에 적용하였다. 또한 NDVI를 활용하여 논 피복지도 제작 및 작물의 재배 면적 및 생육, 생산량 등을 모니터링 하는 연구가 진행되고 있다 (Kwon et al., 2005;
Jeong et al., 2011; Hong et al., 2012; Na et al., 2012). 하지만 NDVI의 경우 동일한 식생상태일지라도 영상별/계절별로 다 르게 평가될 수 있고, 동일한 영상에서도 지역에 따라 동일한 식생상태가 다르게 평가될 수 있기 때문에, NDVI를 직접적 으로 가뭄평가의 객관적인 기준으로 활용하기에는 한계가 있 다 (Jang et al., 2007).
본 연구에서는 위성영상을 이용한 식생 정보 및 기후 정보, 토지피복, 고도, 이용가능수분량 등의 생물물리학적 정보를 활용한 식생가뭄반응지수 (Vegetation Drought Response Index in South Korea, VegDRI-SKorea)를 제시하고, 국내의 적용성 검증을 위하여 2012년에 발생한 가뭄의 시공간적 가 뭄상황을 분석 하였다.
Ⅱ. 재료 및 방법
1. 식생가뭄반응지수 (VegDRI-SKorea)의 개발 Vegetation Drought Response Index (VegDRI)는 NDMC 와 미국지질조사국 (United States Geological Survey, USGS) 에서 개발한 식생 가뭄모니터링 지표로써 위성영상기반의 단 일 자료를 활용한 가뭄 분석의 한계점을 극복하기 위하여 기 상학적 가뭄지표 및 토지피복, 생태지역 등의 생물물리학적 정보를 활용한 가뭄지표이다 (Tadesse et al., 2005; Brown et al., 2008). 현재 VegDRI 가뭄지표는 NDMC (http://vegdri.
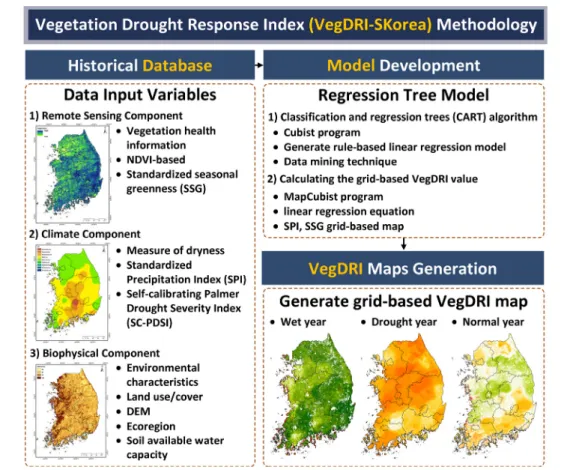
unl.edu) 및 USGS (http://vegdri.cr.usgs.gov)의 가뭄모니터 링 시스템을 통해 2 주 간격으로 미국 전역의 가뭄상황을 제 공하고 있다. VegDRI는 적용 대상 지역의 활용 가능한 기후 인자 및 가뭄지표와 획득 가능한 생물물리학적 정보 등을 고 려하여 적용 지역에 따라 차별화된 가뭄지표를 개발할 수 있 다 (Tadesse et al., 2014). 본 연구에서는 남한지역에 적합한 기후요소 및 가뭄지표, 생물물리학적 정보를 활용하여 기존 의 VegDRI 가뭄지표를 변형하여 남한지역에 적용 가능한 VegDRI-SKorea 가뭄지표를 제시하였다. Fig. 1은 VegDRI- SKorea의 방법론을 도시한 것으로 위성영상정보, 기후정보, 생물물리학적 정보의 세 가지 입력자료를 바탕으로 데이터마 이닝 (data mining) 기법을 활용하여 규칙기반 회귀모형 (rule- based regression tree model)을 적용한 후 격자기반의 VegDRI 값을 산정한다.
Fig. 1 VegDRI-SKorea methodology including database, model development (regression-tree rules generation), and map generation (adjusted Tadesse et al., 2010)
2. 입력자료
가. MODIS 위성영상 자료
MODIS는 NASA의 지구관측시스템 (Earth Observation System, EOS) 프로젝트 일환으로 Terra (EOS AM-1) 위성 및 Aqua (EOS PM-1) 위성의 주센서이다 (Park et al., 2013).
본 연구에서는 관측주기가 짧고 관측 폭이 넓어 육지와 해양 의 광역현상 변화 관측에 적합한 Terra 위성 및 Aqua 위성의 MODIS 자료를 사용하였으며, 육지 (land) 연구를 위하여 만 들어진 MOD13 및 MYD13 (vegetation indices) NDVI 자료 를 이용하였다 (https://lpdaac.usgs.gov/). 합성주기가 16 일 단위로 작성된 250 m 공간해상도를 갖는 2001년부터 2013 년까지의 NDVI 자료를 사용하였으며, 적설의 영향으로 인하 여 지표면의 정확한 관측이 불가능한 겨울철의 자료는 분석 에서 제외하였다. 분석기간은 4월 (4월 7일-4월 22일)부터 10 월 (10월 16일-10월 31일)까지 16 일 단위의 13 개의 기간을 설정하였다.
NDVI는 식생의 유무나 지표의 녹색도 (greenness)를 정량 화하기 위하여 사용되고 있는 식생지수의 하나로서, 광역의
식생특성을 파악하기 위해서 유용한 측정방법으로 널리 사용 되고 있다 (Kim and Kim, 2010). 식생활력도를 나타내는 지 표인 NDVI는 식 (1)과 같이 가시광선 파장영역과 근적외선 파장영역을 조합하고 정규화하여 계산되며, -1.0에서 1.0까 지의 무차원 값으로 나타낸다 (Shin et al., 2010).
≤ ≤ (1)
은 근적외선 파장으로 MODIS 밴드 2, 는 가시관 선의 적색파장으로 MODIS 밴드 1이다.
VegDRI-SKorea 모델은 위성영상인자로서 각 시기별 과 거의 누적 식생 상태 (accumulated NDVI)의 정규화 값을 의 미하는 SSG (Standardized Seasonal Greenness)를 사용하며, 식 (2)와 식 (3)과 같이 산정된다 (Brown et al., 2008; Tadesse et al., 2010).
(2)
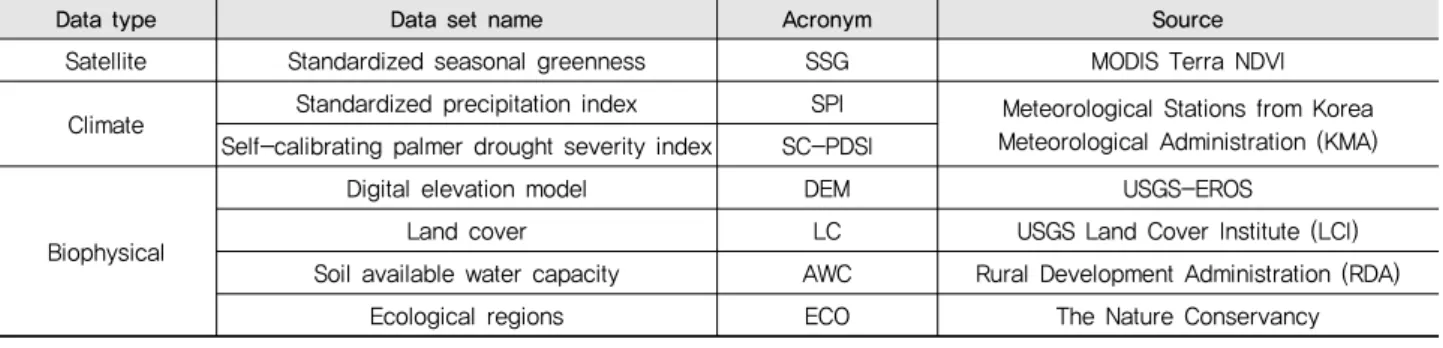
Table 1 Input data for the VegDRI-SKorea model
Data type Data set name Acronym Source
Satellite Standardized seasonal greenness SSG MODIS Terra NDVI
Climate Standardized precipitation index SPI Meteorological Stations from Korea Meteorological Administration (KMA) Self-calibrating palmer drought severity index SC-PDSI
Biophysical
Digital elevation model DEM USGS-EROS
Land cover LC USGS Land Cover Institute (LCI)
Soil available water capacity AWC Rural Development Administration (RDA)
Ecological regions ECO The Nature Conservancy
(3)
SG (Seasonal Greenness)는 분선기간 내 각 연도별 NDVI 의 누적값으로 산정되며, 와 는 각각 초기/후기 생 육시기 (growing season), 는 생육시기를 의미한다. 와 는 2001년부터 2013년까지 산정한 각 생육시기별 SG의 평균 (average)과 표준편차 (standard deviation)를 나타낸다.
나. 가뭄지표 및 생물물리학적 자료
VegDRI-SKorea 모델의 기후인자로서 전 세계 많은 지역 에서 가뭄을 모니터링하기 위한 도구로 활용되고 있는 SPI와 SC-PDSI (Self Calibrating Palmer Drought Severity Index) 를 사용하였다. 1965년 Palmer에 의해 개발된 PDSI는 기상 학적 인자인 강수량과 기온을 이용하여 가뭄을 정량적으로 평가할 수 있는 가뭄지수로서, 강우량 및 기온, 일조시간 등의 자료를 사용하여 잠재증발산량을 추정한 후, 대상지역의 실 제 강우량과 기후학적으로 필요한 강우량의 차를 계산하여 가뭄지수를 산정한다 (Svoboda et al., 2002). PDSI는 온도 변 수를 포함하여 증발산량의 영향을 고려하지만 토양의 수분보 유함량 (available water capacity) 등 여러 변수 값을 필요로 하고, 경험적인 상수가 지역 특성을 반영하지 못하기 때문에 (Nam et al., 2015), Wells et al. (2004)은 PDSI의 경험적인 상 수가 해당 지역의 특성을 바탕으로 자가 보정 될 수 있도록 수 정한 SC-PDSI를 제안하였다. SPI는 가뭄은 상대적으로 물의 수요에 비해 물의 부족을 유발하는 강수량의 감소에 의해 시 작된다는 것에 착안하여 개발된 기상학적 가뭄지수로써, 강 수량만을 입력 자료로 사용하고 정규화 과정을 통해 적용 지 역에 대한 다양한 시간 척도의 표준화된 값을 제공한다. 본 연 구에서는 2001년부터 2013년까지 도서지역을 제외한 전국 의 54 개 기상관측소에 대한 2 주단위의 SC-PDSI와 36 주단 위의 SPI를 산정하였다.
VegDRI-SKorea 모델의 생물물리학적 인자는 수치표고
모델 (Digital Elevation Model, DEM), 토지피복지도, 유효 토양수분량, 생태지도 (Ecological regions)를 사용하였다 (Table 1). 생태지도는 환경조건의 변동성을 고려하여 유사 한 생태계 및 환경 자원과 지리학적 정보로 구분된 지도로서 남한지역의 경우 상록수림 (evergreen forest), 혼합림 (mixed forest), 활엽수림 (deciduous forest)으로 구분된다 (Olson and Dinerstein, 2002). DEM은 90 m 해상도의 SRTM (Shuttle Radar Topography Mission) 자료, 토지피복지도는 0.5 km 해상도의 USGS 자료를 사용하였으며 (Broxton et al., 2014), 모든 생물물리학적 인자는 250 m 해상도로 변환 (resample) 하였다. 미국 VegDRI의 경우 위성영상 자료로서 평균 계절 별 녹색도 비율 (percent annual seasonal greenness)을 적용 하고 있으며, 이밖에도 관개지역 (Irrigated locations) 자료 및 남방진동지수 (Southern Oscillation Index, SOI) 등을 활용 하고 있다.
3. 데이터마이닝 기법을 이용한 분류 규칙 개발 데이터마이닝 기법은 물리적인 변수들의 패턴과 상관성 을 분석하기 위한 기법으로 사용되고 있으며, 의사결정나무 (decision tree), 비선형회귀분석 (non-linear regression analysis) 과 군집분석 (cluster analysis) 등이 있으며, 기존의 자료들의 분석을 통하여 목표변수의 예측이 가능하다는 장점을 갖고 있다 (Kim and Park, 2010). Tadesse et. al. (2004)은 다양한 변수들이 복잡하게 연계되어 있는 가뭄이 식생 상태에 미치 는 영향을 데이터마이닝의 기계적인 알고리즘으로 가뭄의 특 성을 분석하였다.
VegDRI-SKorea 모델에서는 남한지역에 적용 가능한 가 뭄지수 및 지형적인 특징이 고려된 변수들과 식생을 표현하 는 변수들과의 상관분석을 이용하여 시공간적인 가뭄지수를 산정하였다. VegDRI-SKorea 모델의 규칙기반 회귀분석을 위하여 위성영상자료 (SSG), 가뭄지표 (SPI, SC-PDSI), 생물 물리학적자료 (DEM, LC, AWC, ECO)의 7 가지 입력자료를 기상관측소 지점별로 추출하였다. 자료의 형태상 위성영상
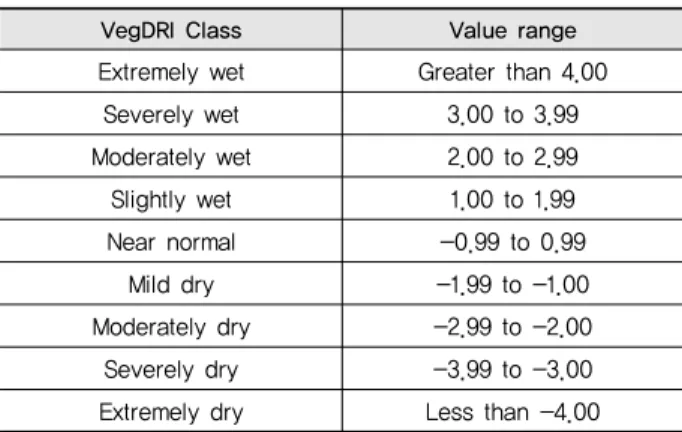
Table 2 VegDRI-SKorea classification scheme and class value ranges (Brown et al., 2008)
VegDRI Class Value range
Extremely wet Greater than 4.00
Severely wet 3.00 to 3.99
Moderately wet 2.00 to 2.99
Slightly wet 1.00 to 1.99
Near normal -0.99 to 0.99
Mild dry -1.99 to -1.00
Moderately dry -2.99 to -2.00
Severely dry -3.99 to -3.00
Extremely dry Less than -4.00
자료 및 가뭄지표와 같은 데이터의 연속성을 갖는 변수와 토 지이용, 생태지역과 같은 범주형 변수로 구분할 수 있다. 각 지점별로 추출된 데이터를 이용하여 의사결정나무 기법의 하 나인 CART 알고리즘 (Classification And Regression Tree algorithm)을 적용한 후 (Rulequest, 2013), 수집 데이터 간의 규칙기반 회귀식 (rule-based regression tree equation)을 생 성하였다. 규칙기반의 회귀분석을 위하여 종속변수로서 가 뭄 심도에 대한 다양한 기준을 갖고 있는 SC-PDSI를 사용하 였기 때문에 (Brown et al., 2008), VegDRI-SKorea 가뭄지표 의 분류 기준은 SC-PDSI와 동일하다 (Table 2). 식 (4)는 8월 29일부터 9월 13일까지 생육시기의 분류규칙을 예로 도시한 것이다. 각 시기별, 규칙별로 도출된 회귀식을 각 격자에 작용 하여 연도별/시기별 격자 기반 (raster-based)의 VegDRI 가 뭄지도를 생성하였다.
if
≤
≤
(4)
Ⅲ. 적용 및 고찰
1. 식생가뭄반응지수를 활용한 가뭄분석
2012년 봄에는 전국적으로 평년대비 강수량이 부족한 상 황에서 중부 지역을 중심으로 극심한 가뭄이 발생하였다. 전 국적으로 5월 평균 강수량은 36.2 mm로 예년평균의 36.4 % 로 관측되었고, 경기 서부와 충남 서해안 지역은 강수량 예년 비가 20 %에 불과했다. 6월 상순과 중순의 강수량은 10.6
mm, 19.4 mm로 평년대비 각각 33 %, 41 %에 불과했고, 하순 에는 44.7 mm로 평년대비 66 %를 기록했으며, 하순 후반에 는 장마전선의 영향으로 전국에 비가 내려 가뭄이 해갈되었 다 (Ahn et al., 2014). 본 연구에서는 경기, 충남, 전북지역을 중심으로 발생한 2012년 봄기간의 극심한 가뭄상황을 VegDRI의 공간분포를 통해 분석하였다.
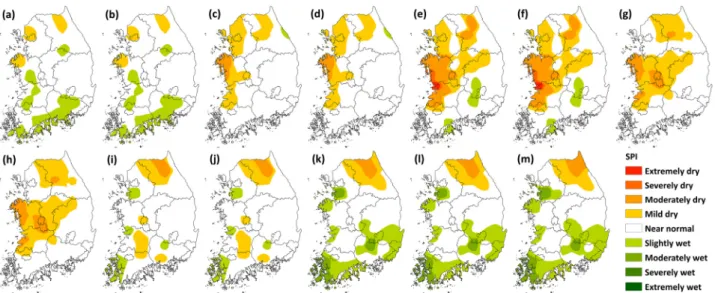
Fig. 2는 2012년 4월부터, 10월 까지의 VegDRI-SKorea 공간지도로써 가뭄 상황의 공간 분포 변화 양상을 나타낸 것 이다. 4월 중순부터 경기북부, 강원 지역부터 약한 가뭄 (mild dry)이 발생하였으며, 5월부터 7월까지 내륙을 포함한 경기 서부와 충남 서해안 지역에 극심한 가뭄 (severely dry)이 발 생하였다. 8월에는 국지적인 강수 및 태풍의 영향으로 인해 7 월과 비교하여 가뭄이 해소된 것을 확인할 수 있다. Table 3과 Table 4는 시기별/도별 VegDRI-SKorea의 약한 가뭄과 극심 한 가뭄의 발생 지역의 비율을 정리한 것이다. 경기도 지역의 경우 5월 초순과 6월 초순에 약 69 % 지역에서 약한 가뭄 상 태가 나타났으며, 충남 지역의 경우 5월 초순부터 7월 하순까 지 약 79 % 지역에서 가뭄 상황이 발생하였다. 강원 지역은 2012년 전 기간에 걸쳐 약 35 % 지역에서 가뭄 상황이 지속되 었으며, 9월 중순에 약 61 % 지역에서 약한 가뭄 상황이 발생 하였다. 강원 지역의 경우, 9월 14일부터 29일까지 속초, 대관 령, 춘천, 인제, 홍천 기상관측소의 평균 강수량이 101 mm로 평년과 유사하였지만, 생태지역이 주로 혼합림으로 구분되 고 유효수분량이 작은 지역이 분포되어 있어 가뭄 상황에 민 감하게 반응한 것으로 판단된다. 극심한 가뭄의 경우 경기, 강 원, 충남 지역에 5월 초순에서 6월 하순까지 발생하였으며, 특 히 충남 지역의 경우 약 28 % 지역에서 극심한 가뭄 상태가 발 생하였다. 2012년 봄 가뭄사상 기간에 대한 분석결과 인공위 성 자료 기반의 VegDRI-SKorea 가뭄지표가 남한지역의 가 뭄사상 분석에 적합한 것으로 판단된다.
2. 기상학적 가뭄지수와의 비교/분석
본 연구에서는 기상학적 가뭄지수인 SPI, SC-PDSI와 VegDRI-SKorea의 가뭄분석의 공간 변동성을 비교하였다.
Fig. 3와 Fig. 4는 Fig. 2의 VegDRI 가뭄지표와 동일한 기간 에 대한 36 주단위의 SPI와 2 주단위의 SC-PDSI의 가뭄지수 공간지도이다. 현재 국내에서 적용되고 있는 SPI의 공간분포 와 비교한 결과 VegDRI의 공간분포와 유사한 경향이 나타났 다. SC-PDSI의 경우 가뭄의 발생범위에 대한 차이가 발생하 였지만, 전체적인 가뭄의 공간분포는 유사한 결과가 도출되 었다.
SPI 가뭄지표의 경우 강우량만을 입력자료로 이용하기 때 문에 산정방법이 단순하여 여러 기관에서 널리 적용이 되고
Fig. 2 Time series drought map of VegDRI-SKorea in 2012: (a) Apr. 7-Apr. 22, (b) Apr. 23–May 8, (c) May 9–May 24, (d) May 25–June 9, (e) June 10–June 25, (f) June 26–July 11, (g) July 12-July 27, (h) July 28-Aug. 12, (i) Aug. 13-Aug. 28, (j) Aug. 29-Sep. 13, (k) Sep. 14-Sep. 29, (l) Sep. 30-Oct. 15, (m) Oct. 16-Oct. 31
Table 3 Drought ratios below mild dry for VegDRI-SKorea according to eight provinces-level
Administrative district (a)1) (b) (c) (d) (e) (f) (g) (h) (i) (j) (k) (l) (m)
Gyeonggi-do 11.2 5.8 70.5 68.0 33.0 34.5 20.6 24.4 6.9 11.8 13.9 5.5 4.2
Gangwon-do 32.0 26.7 44.2 39.7 34.4 35.1 31.9 24.8 31.4 31.3 60.8 36.4 31.8
Chungcheongbuk-do 2.0 0.3 9.4 8.2 34.2 39.7 44.9 35.0 7.5 6.1 6.2 4.1 4.6
Chungcheongnam-do 8.3 7.7 76.9 75.2 82.2 75.5 86.9 49.0 4.6 3.5 2.5 1.9 3.7 Jeollabuk-do 1.7 0.3 48.9 45.9 46.8 56.6 59.7 36.8 16.9 19.4 2.5 1.7 3.4 Jeollanam-do 1.3 0.9 20.5 16.3 16.6 16.2 12.5 14.8 12.1 19.9 2.6 5.7 2.5 Gyeongsangbuk-do 1.0 0.4 9.8 8.4 8.4 12.2 21.2 25.4 5.5 9.6 2.0 1.1 2.3 Gyeongsangnam-do 0.7 0.5 8.5 7.9 3.0 2.3 11.4 16.5 8.1 13.0 5.7 6.4 3.7
※ units: percentage (%)
※ 1) (a) Apr. 7-Apr. 22, (b) Apr. 23–May 8, (c) May 9–May 24, (d) May 25–June 9, (e) June 10–June 25, (f) June 26–July 11, (g) July 12-July 27, (h) July 28-Aug. 12, (i) Aug. 13-Aug. 28, (j) Aug. 29-Sep. 13, (k) Sep. 14-Sep. 29, (l) Sep. 30-Oct. 15, (m) Oct. 16-Oct. 31
Table 4 Drought ratios below severely dry for VegDRI-SKorea according to eight provinces-level
Administrative district (a)1) (b) (c) (d) (e) (f) (g) (h) (i) (j) (k) (l) (m)
Gyeonggi-do - - 9.3 6.9 0.4 - - 1.0 - 1.1 1.0 0.8 -
Gangwon-do 2.0 3.3 7.5 5.6 0.8 1.8 0.3 0.3 - 0.7 3.0 1.3 0.8
Chungcheongbuk-do 0.3 - 0.3 0.5 - - - 0.6 - - 0.7 0.6 -
Chungcheongnam-do 0.5 0.9 29.1 27.1 12.0 3.9 0.4 1.6 - - - - -
Jeollabuk-do 0.3 - 4.3 1.3 2.7 4.5 - 1.9 - 1.4 0.6 0,3 -
Jeollanam-do - - 11.5 7.0 7.6 5.1 0.5 - - 6.6 - - -
Gyeongsangbuk-do - - 0.5 0.4 0.3 - - 0.5 - 0.5 0.4 0.4 -
Gyeongsangnam-do - - 3.1 2.2 0.5 0.3 - 0.7 - 0.8 0.9 0.3 -
※ units: percentage (%)
※ 1) (a) Apr. 7-Apr. 22, (b) Apr. 23–May 8, (c) May 9–May 24, (d) May 25–June 9, (e) June 10–June 25, (f) June 26–July 11, (g) July 12-July 27, (h) July 28-Aug. 12, (i) Aug. 13-Aug. 28, (j) Aug. 29-Sep. 13, (k) Sep. 14-Sep. 29, (l) Sep. 30-Oct. 15, (m) Oct. 16-Oct. 31
Fig. 3 Time series drought map of 36-weeks SPI in 2012 from (a) Apr. 7-Apr. 22 to (m) Oct. 16-Oct. 31
Fig. 4 Time series drought map of 2-weeks SC-PDSI in 2012 from Apr. 7-Apr. 22 to (m) Oct. 16-Oct. 31
있으며, 현재까지 통용되고 있는 가뭄지수들 중 적용성이 가 장 높다 (Hayes et al., 2004; Wilhite et al., 2007). 하지만 SPI, SC-PDSI는 지점관측 자료를 기반으로 각 지점의 결과 값을 이용하여 내삽기법을 적용하여 산정한 공간지도이기 때문에 공간적인 정확성이 낮으므로 시/군/구 단위의 행정단위의 가 뭄 분석을 할 수 없는 한계점이 발생한다.
VegDRI-SKorea 가뭄지표의 경우 250 m의 공간 해상도 를 갖고 있으며, 소단위 행정단위의 가뭄상황에 대한 분포를 확인 할 수 있기 때문에, 지역적 규모에서 기상자료 및 기후학 적 가뭄지표가 제공할 수 없는 가뭄 상황에 대한 정보를 제공 할 수 있다. 또한 지역별 시기별 식생 수준 및 가뭄 상황을 객
관화할 수 있는 기준으로 활용가능하며, 가뭄 확산의 시공간 적 특성을 파악하기 위한 가뭄지도 작성 및 향후 가뭄에 대한 방재 대책에 활용할 수 있을 것으로 판단된다.
Ⅳ. 결 론
본 연구에서는 MODIS NDVI 위성영상을 이용한 식생 정 보 및 SPI, SC-PDSI의 기존 가뭄지수, 토지피복, 고도, 이용 가능수분량 등의 생물물리학적 정보를 활용하여 CART 알고 리즘으로부터 수집된 데이터간의 분류 규칙을 생성하고, 격 자기반의 식생가뭄반응지수 (VegDRI-SKorea)를 제시하였
다. 또한 국내의 적용성 검증을 위하여 2012년에 발생한 가뭄 의 시공간적 가뭄상황을 분석하고, 기존의 기상학적 가뭄지 수와 비교 분석하였다. VegDRI-SKorea을 이용한 가뭄 분석 을 통해 경기, 충남, 전북지역을 중심으로 발생한 2012년 봄 기간의 극심한 가뭄상황을 반영한 결과가 도출되었다.
본 연구의 결과는 가뭄의 실시간 감시를 위하여 원격탐사 의 활용 및 다양한 정보를 통합하여 복합적으로 반영하는 격 자기반의 고해상도 가뭄정보를 제공함으로써 행정구역별 가 뭄 방재재해 대책을 세울 수 있을 것으로 사료된다. 또한 향후 위성영상 자료의 장기적인 자료를 축척하여 활용한다면 가뭄 분석의 신뢰성 있는 결과를 도출할 것으로 판단된다.
사 사
이 논문은 농촌진흥청 연구사업 (세부과제번호: PJ00997801) 및 2013년도 정부 (교육부)의 재원으로 한국연구재단의 지원 을 받아 수행된 기초연구사업임 (2013R1A6A3A03019009).
REFERENCES
1. Ahn, S.R., J.W. Lee, and S.J. Kim, 2014. Analysis of 2012 spring drought using meteorological and hydrological indices and satellite-based vegetation indices. Journal of Korea National Committee on Irrigation and Drainage 21(1): 78-88 (in Korean).
2. Brown, J.F., B.D. Wardlow, T. Tadesse, M.J. Hayes, and B.C.
Reed, 2008. The vegetation drought response idex (VegDRI): a new integrated approach for monitoring drought stress in vegetation. GIScience & Remote Sensing 45(1): 16-46.
3. Broxton, P.D., X. Zeng, D. Sulla-Menashe, and P.A. Troch, 2014. A global land cover climatology using MODIS data.
Journal of Applied Meteorology and Climatology 53: 1593- 1605.
4. Hayes, M.J., O.V. Wilhelmi, and C.L. Knutson, 2004.
Reducing drought risk: bridging theory and practice. Natural Hazards Review 5(2): 106-113.
5. Hayes, M., M. Svoboda, N. Wall, and M. Widhalm, 2011. The Lincoln declaration on drought indices: universal meteorological drought index recommended. Bulletin of the American Meteoro- logical Society 92: 485-488.
6. Hong, S.Y., J. Hur, J.B. Ahn, J.M. Lee, B.K. Min, C.K. Lee, Y.H. Lee, K.D. Lee, S.H. Kim, G.Y. Kim, and K.M. Shim, 2012. Estimating rice yield using MODIS NDVI and meteoro- logical data in Korea. Korean Journal of Remote Sensing
28(5): 509-520 (in Korean).
7. Hunt, E.D., M. Svoboda, B. Wardlow, K. Hubbard, M. Hayes, and T. Arkebauer, 2014. Monitoring the effects of rapid onset of drought on non-irrigated maize with agronomic data and climate-based drought indices. Agricultural and Forest Meteorology 191: 1-11.
8. Jang, M.W., S.H. Yoo, and J.Y. Choi, 2007. Analysis of spring drought using NOAA/AVHRR NDVI for North Korea.
Journal of the Korean Society of Agricultural Engineers 49(6):
21-33 (in Korean).
9. Jeong, S.T., K.C. Jang, S.Y. Hong, and S.K. Kang, 2011.
Detection of irrigation timing and the mapping of paddy cover in Korea using MODIS images data. Korean Journal of Agricultural and Forest Meteorology 13(2): 69-78 (in Korean).
10. Kim, G.S., and J.P. Kim, 2010. Analysis of spatial-temporal variability of NOAA/AVHRR NDVI in Korea. Journal of the Korean Society of Civil Engineers 30(3B): 295-303 (in Korean).
11. Kim, G.S., and H.G. Park, 2010. Estimation of drought index using CART algorithm and satellite data. Journal of the Korean Association of Geographic Information Studies 13(1): 128-141 (in Korean).
12. Kwon, H.J., S.C. Shin, and S.J. Kim, 2005. Climatic water balance analysis using NOAA/AVHRR satellite images. Journal of the Korean Society of Agricultural Engineers 47(1): 3-9 (in Korean).
13. Na, S.I., J.H. Park, and J.K. Park, 2012. Development of Korean paddy rice yield prediction model (KRPM) using meteorological element and MODIS NDVI. Journal of the Korean Society of Agricultural Engineers 54(3): 141-148 (in Korean).
14. Nam, W.H., J.Y. Choi, S.H. Yoo, and B.A. Engel, 2012a. A real-time online drought broadcast system for monitoring soil moisture index. KSCE Journal of Civil Engineering 16(3):
357-365.
15. Nam, W.H., J.Y. Choi, S.H. Yoo, and M.W. Jang, 2012b. A decision support system for agricultural drought management using risk assessment. Paddy Water Environment 10(3):
197-207.
16. Nam, W.H., M.J. Hayes, D.A. Wilhite, T. Tadesse, M.D.
Svoboda, and C.L. Knutson, 2014. Drought management and policy based on risk assessment in the context of climate change. Magazine of the Korean Society of Agricultural Engineers 56(2): 2-15 (in Korean).
17. Nam, W.H., M.J. Hayes, D.A. Wilhite, and M.D. Svoboda, 2015. Projection of temporal trends on drought characteristics using the standardized precipitation evapotranspiration index (SPEI) in South Korea. Journal of the Korean Society of Agricultural Engineers 57(1): 37-45 (in Korean).
18. Olson, D.M., and E. Dinerstein, 2002. The Global 200: priority ecoregions for global conservation. Annals of the Missouri Botanical Garden 89(2): 199-224.
19. Otkin, J., M. Shafer, M. Svoboda, B. Wardlow, M. Anderson, C. Hain, and J. Basara, 2014. Facilitating the use of drought early warning information through interactions with agricultural stakeholders. Bulletin of the American Meteorological Society, in press, doi: 10.1175/BAMS-D-14-00219.1.
20. Park, J.K., B.S. Kim, S.Y. Oh, and J.H. Park, 2013.
Applicability of vegetation indices from Terra MODIS and COMS GOCI imageries. Journal of the Korean Society of Agricultural Engineers 55(6): 47-55 (in Korean).
21. Park, J.S., and K.T. Kim, 2009. Evaluation of MODIS NDVI for drought monitoring: focused on comparison of drought index. The Journal of GIS Association of Korea 17(1): 117-129 (in Korean).
22. Rulequest, 2013. An overview of Cubist. RuleQuest Research Pty Ltd, St Ives, NSW, Australia. available at http://www.
rulequest.com/cubist-win.html.
23. Shin, H.J., R. Ha, M.J. Park, and S.J. Kim, 2010. Estimation of spatial evapotranspiration using the relationship between MODIS NDVI and morton ET –for Chungjudam watershed-.
Journal of the Korean Society of Agricultural Engineers 52(1):
19-24 (in Korean).
24. Shin, S.C., and C.J. Kim, 2003. Application of normalized difference vegetation index for drought detection in Korea.
Journal of the Korean Water Resources Association 36(5):
839-849 (in Korean).
25. Shin, S.C., and M.S. Eoh, 2004. Analysis of drought detection and propagation using satellite data. Journal of The Korean Society of Hazard Mitigation 4(2): 61-69 (in Korean).
26. Shin, S.C., J. Soo, K.T. Kim, J.H. Kim, and J.S. Park, 2006.
Drought detection and estimation of water deficit using NDVI.
Journal of the Korean Association of Geographic Information Studies 9(2): 102-114 (in Korean).
27. Smith, A.D., and Katz, R.W., 2013. US billion-dollar weather and climate disasters: data sources, trends, accuracy and biases.
Natural Hazards 67: 387-410.
28. Sur, C.Y., K.J. Kim, W.J. Choi, J.H. Shim, and M.H. Choi, 2014. Drought assessments using satellite-based drought index in Korea: southern region case in 2013. Journal of The Korean Society of Hazard Mitigation 14(3): 127-131 (in Korean).
29. Svoboda, M., D. LeComte, M. Hayes, R. Heim, K. Gleason, J.
Angel, B. Rippey, R. Tinker, M. Palecki, D. Stooksbury, D.
Miskus, and S. Stephens, 2002. The drought monitor. Bulletin
of the American Meteorological Society 83(8): 1181-1190.
30. Svoboda, M.D., B.A. Fuchs, C.C. Poulsen, and J.R. Nothwehr, 2015. The drought risk atlas: enhancing decision support for drought risk management in the United States. Journal of Hydrology, in press, doi:10.1016/j.jhydrol.2015.01.006.
31. Swain, S., B.D. Wardlow, S. Narumalani, T. Tadesse, and K.
Callahan, 2011. Assessment of vegetation response to drought in Nebraska using Terra-MODIS land surface temperature and normalized difference vegetation index. GIScience & Remote Sensing 48(3): 432-455.
32. Tadesse, T., D.A. Wilhite, S.K. Harms, M.J. Hayes, and S.
Goddard, 2004. Drought monitoring using data mining tech- niques: a case study for Nebraska, USA. Natural Hazards 33:
137-159.
33. Tadesse, T., J.F. Brown, and M.J. Hayes, 2005. A new approach for predicting drought-related vegetation stress:
integrating satellite, climate, and biophysical data over the U.S.
central plains. ISPRS Journal of Photogrammetry & Remote Sensing 59: 244-253.
34. Tadesse, T., B.D. Wardlow, M.J. Hayes, and M.D. Svoboda, 2010. The vegetation outlook (VegOut): a new method for predicting vegetation seasonal greenness. GIScience & Remote Sensing 47(1): 25-52.
35. Tadesse, T., G.B. Demisse, B. Zaitchik, and T. Dinku, 2014.
Satellite-based hybrid drought monitoring tool for prediction of vegetation condition in eastern Africa: a case study for Ethiopia. Water Resources Research 50: 2176-2190.
36. Tadesse, T., B.D. Wardlow, J. Brown, M. Hayes, M. Svoboda, B. Fuchs, and D. Gutzmer, 2015. Assessing the vegetation condition impacts of the 2011 drought across the U.S. southern great plains using the vegetation drought response index (VegDRI). Journal of Applied Meteorology and Climatology 54: 153-169.
37. Wells, N., S. Goddard, and M.J. Hayes, 2004. A self- calibrating palmer drought severity index. Journal of Climate 17: 2335–2351.
38. Wilhite, D.A., Hayes, M.J., Knutson, C., and Smith, K.H., 2000. Planning for drought: moving from crisis to risk management. Journal of the American Water Resources Association 36(4): 697-710.
39. Wilhite, D.A., M.D. Svoboda, and M.J. Hayes, 2007. Under- standing the complex impacts of drought: a key to enhancing drought mitigation and preparedness. Water Resources Manage- ment 21: 763-774.