• 검색 결과가 없습니다.

Feasibility of Vegetation Temperature Condition Index for monitoring desertification in Bulgan, Mongolia

N/A
N/A
Protected

Academic year: 2021

Share "Feasibility of Vegetation Temperature Condition Index for monitoring desertification in Bulgan, Mongolia"

Copied!
9
0
0

로드 중.... (전체 텍스트 보기)

전체 글

(1)

1. Introduction

Desertification is often seen as one of the most serious environmental problems confronting the world from at least the 1980s onwards (Geist, 2005). The most authoritative definition of desertification remains that of the United Nations convention to Combat

Desertification (UNCCD): ‘land degradation in arid, semi-arid and dry sub-humid areas resulting from various factors, including climatic variations and human activities’ (UNCCD, 1994). In other words, desertification is a type of land degradation in which a relatively dry land region becomes increasingly arid, typically losing its bodies of water as well as vegetation

Feasibility of Vegetation Temperature Condition Index for monitoring desertification in Bulgan, Mongolia

Hangnan Yu*, Jong-Yeol Lee*, Woo-Kyun Lee*

, Munkhnasan Lamchin*, Dejee Tserendorj*, Sole Choi*, Yongho Song* and Ho Duck Kang**

*Department of Environmental Science and Ecological Engineering, Korea University, Seoul 136-713, Republic of Korea

**Department of Biological and Environmental Science, Dongguk University, Seoul, Korea

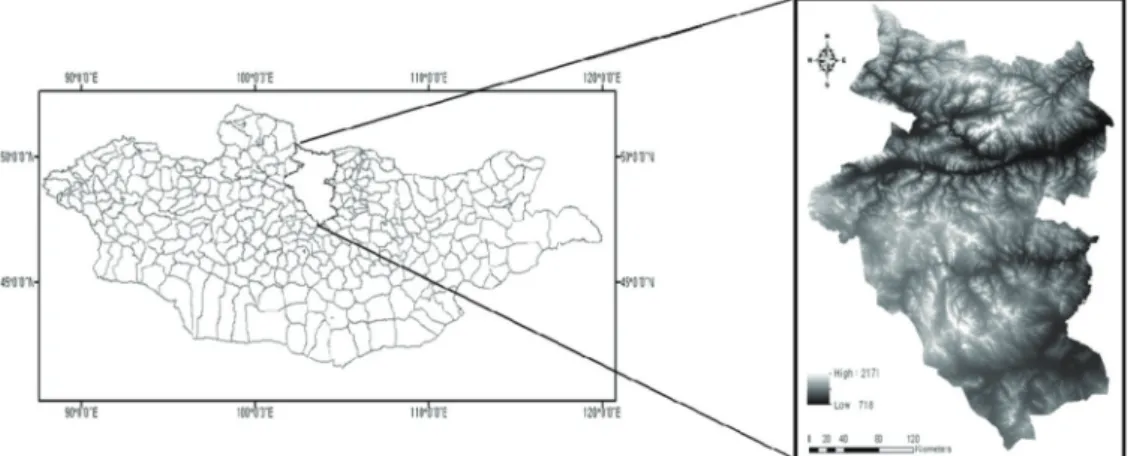
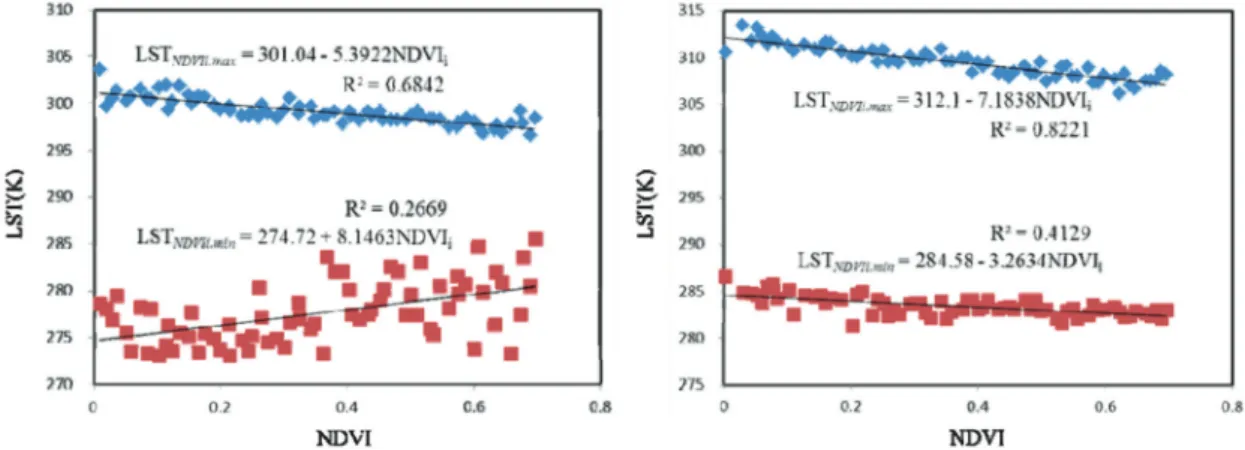
Abstract : Desertification monitoring as a main portion for understand desertification, have been conducted by many scientists. However, the stage of research remains still in the level of comparison of the past and current situation. In other words, monitoring need to focus on finding methods of how to take precautions against desertification. In this study, Vegetation Temperature Condition Index (VTCI), derived from Normalized Difference Vegetation Index (NDVI) and Land Surface Temperature (LST), was utilized to observe the distribution change of vegetation. The index can be used to monitor drought occurrences at a regional level for a special period of a year, and it can also be used to study the spatial distribution of drought within the region. Techniques of remote sensing and Geographic Information System (GIS) were combined to detect the distribution change of vegetation with VTCI. As a result, assuming that the moisture condition is the only main factor that affects desertification, we found that the distribution of vegetation in Bulgan, Mongolia could be predicted in a certain degree, using VTCI. Although desertification is a complicated process and many factors could affect the result. This study is helpful to provide a strategic guidance for combating desertification and allocating the use of the labor force.

Key Words : Desertification monitoring, Remote sensing, GIS, VTCI

Received August 26, 2013; Revised September 28, 2013, Revised December 10, 2013 Revised December 17, 2013; Accepted December 17, 2013.

Corresponding Author: Woo-Kyun Lee ([email protected])

This is an Open-Access article distributed under the terms of the Creative Commons Attribution Non-Commercial License

(http://creativecommons. org/licenses/by-nc/3.0) which permits unrestricted non-commercial use, distribution, and reproduction in

any medium, provided the original work is properly cited

(2)

and wildlife. It is caused by a variety of factors, such as climate change (such as global warming) and human activities (such as growing population in fragile semiarid ecosystems and irrational or unwise land management by nomadic pastoralists) (Tsujimura et al., 2010).

Mongolia is one of the largest landlocked countries in the world extending between the latitude of 41˚35’ - 52˚09’ N, the longitudes of 87˚44’ - 119˚56’ E, and covering 1,564,116 km

2

. The longest distance from west to east is 2,392 km, and from north to south 1,259 km. About 90% of the territory was defined as dry lands, with hyper-arid, arid and semi-arid zones occupying more than 80%, and dry sub-humid zone occupying less than 10% (Altanbagana et al., 2010). A recent assessment of desertification in Mongolia shows that 5% is very severely, 18% severely, 26% moderately and 23% slightly degraded (Banzragch and Enkhbold, 2010). This means that roughly 72% of the total territory is affected by desertification to some extent.

Climate change poses great challenges to Mongolia, the region which is most vulnerable to have adverse impacts of climate change, because of its geographical location, weather and climate conditions as well as specific features of socio-economic development (Dagvadorj, 2010). In fact, in case of Mongolia, evapotranspiration has increased by 3.2%-10% in the desert zones and by 10%-15% in forest steppe and high mountain zones between 1940 and 2006 (Natsagdorj, 2004). The mean annual temperature have risen 2.1℃

between 1940 and 2007 with an accelerating trend in the recent years (Tsogoo et al., 2010). In addition, the frequencies of rainfall covering large areas have decreased and precipitations have fallen increasingly in form of torrential rains on small land surface (Chuluun, 2010a). The Hydro-meteorological Institute estimates an increase of 20% since 1980 in torrential rains (Natsagdorj, 2006). These phenomena illustrate that drought situation in Mongolia become worse.

Global warming has caused continuous rising of

temperature. Moisture condition is strongly affected by temperature, in other words, following temperature rising, moisture condition will become worse.

Vegetation, on the other hand, with insufficient moisture and once beyond the endurance cannot live too long time. Which means monitoring moisture condition, in certain degree, may make it possible to predict desertification.

Goetz (1997) reported that the negative correlation between Land Surface Temperature (LST) and Normalized Difference Vegetation Index (NDVI), observed at several scales (25 m

2

to 1.2 km

2

), was largely due to changes in vegetation cover and soil moisture, and was indicated that the surface temperature can rise rapidly with water stress.

Remotely retrieved NDVI and LST data may provide

a valuable source of information for monitoring

drought, since meteorological data, such as

precipitation and land air surface temperature, collected

by surface observation stations often possess poor

spatial resolution, especially in remote regions with

difficult access and in some developing countries (Wan

et al., 2004). The Vegetation Temperature Condition

Index (VTCI) approach which was developed by Wang

et al. (2001) proposed for monitoring drought

occurrence at regional level on the basis of the

triangular space of LST and NDVI. This study

attempted to predict change of vegetated area with

VTCI using Landsat Thematic Mapper (TM). Wan et

al. (2004) suggest that VTCI is not only closely related

to recent rainfall events but also related to past rainfall

amount, and indicate that VTCI might be a better index

for drought condition. Considering that we cannot

predict what the human do next, but environment could

be predicted in certain degree based on the trend of

phenomena (Such as global warming). According to

this kind of reason and above paragraph logical

thinking, we assumed that the moisture condition is the

only main factor that affects desertification. Currently,

although many studies about desertification were

(3)

published, however, there are still in the level of comparing past and current situation (Wu and Ci, 2001;

Collado et al., 2002; Yang et al., 2005; Zhang et al., 2008). The purpose of this study is to find out the feasibility of VTCI to predict desertification, and based on this kind of approach to assist desertification monitoring.

2. Materials and Methods

1) Study area and Materials

Bulgan is one of the northern provinces of Mongolia, located between latitude 47˚14’ - 50˚23’ N and longitude 101˚37’-104˚45’ E (Fig. 1). The northern part of this province is characterized by alpine forests, gradually blending in the arid steppe plains of the central Mongolian highland. Temperature fluctuate between +38℃ in summer and -49℃ in winter. An average annual temperature is -2.4℃, and an average precipitation range from 200 to 350 mm with discontinuous permafrost.

The Landsat series of satellites provides the longest continuous record of satellite-based observations. As such, Landsat is an invaluable resource for monitoring global change, a primary source of medium spatial resolution Earth observations, and a key factor in

decision-making (Woodcock et al., 2001; Cohen and Goward, 2004; Masek et al., 2008). In this study, 5 mosaic images (Landsat 5) were used to define the study area. All these images (quality 9) were taken in September and October, and the longest interval not exceeds 25 days. Both ERDAS IMAGINE and ArcGIS software were used for image processing and analyzing.

2) Methods

(1) Derivation of LST

There are three types of methods which have been developed to retrieve LST from at-sensor and auxiliary dada: single-channel method, split-window technique, and multi-angle method. Because of the last two methods it requires at least two channels, and single- channel method is the only method that can be applied to the Landsat platform, with one thermal channel (Xiao et al., 2007). The thermal band data (band 6) can be converted from at-sensor spectral radiance to effective at-sensor brightness temperature (Chander et al., 2009). The formula from the at-sensor’s spectral radiance to at-senor brightness temperature is:

T = (1) Where T is effective at-sensor brightness temperature, K

1

and K

2

are calibration constants in

K

2

ln( + 1)

Fig. 1. Geographical location and elevation distribution of study area.

K

1

L

λ

(4)

Kelvin, and L

λ

is spectral radiance at the sensor’s aperture. For TM, K

1

= 607.76 and K

2

= 1260.56 W / (m

2

sr μm).

The temperature values obtained above are referenced to a back body. Therefore, corrections for spectral emissivity (ε) became necessary according to the nature of land cover. The emissivity corrected LST were computed as follows (Artis and Carnahan, 1982):

LST = (2) Where λ is the wavelength of emitted radiance (for which the peak response and the average of the limiting wavelengths (λ =11.5 μm) (Markham and Barker, 1985) will be used), ρ = h × (1.438×10

-2

m K), σ is the Boltzmann constant (1.38×10

-23

J/K), h is Planck’s constant (6.626×10

-34

J s), and c the velocity of light (2.998×10

8

m/s). LST results are comparable, because the five images were acquired at the same season (August and September) of the year.

(2) Definition of VTCI

Vegetation temperature condition index is defined as:

VTCI = (3) Where:

LST

NDVIi.max

= a + b NDVI

i

(4) LST

NDVIi.min

= a’ + b’NDVI

i

Where LST

NDVIi.max

and LST

NDVIi.min

are maximum and minimum LSTs of pixels which have same NDVI

i

value in a study region, respectively, and LST

NDVIi

denotes LST of one pixel whose NDVI value is NDVI

i

. Coefficient a, b, a’ and b’ can be estimated from the scatter plot of LST and NDVI in the area. The shape of the scatter plot is normally triangular at a regional scale (Price, 1990; Carlson et al., 1994) if the study area is large enough to provide a wide range of NDVI and surface moisture conditions.

VTCI is not only related to NDVI changes in the region, but also related to LST changes of pixels with

a specific NDVI value. It can be physically explained as the ratio of temperature differences among the pixels.

In general, the lower the value of VTCI is, the heavier the drought occurrence is.

LST_max can be regarded as the ‘warm edge’ where there is less soil moisture availability and plants are under dry conditions; LST_min can be regarded as the

‘cold edge’ where there is no water restriction for plant growth (Gillies et al., 1997).

3. Results and discussion

Fig. 2 is the scatter plot of the NDVI and LST data of 1990 and 2010 in the Bulgan province. After estimating a, b, a’ and b’, we get equations as follows:

For 1990

LST

NDVIi.max

= 301.04 _ 5.3922NDVI

i

(5) LST

NDVIi.min

= 274.72 + 8.1463NDVI

i

For 2011

LST

NDVIi.max

= 312.1 _ 7.1838NDVI

i

(6) LST

NDVIi.min

= 284.58 + 3.2634NDVI

i

As the two scatter plots shown in Fig. 2, triangles are not obvious. This may be because samples which are derived from the study area used to make scatter plots just for specific day, not for several days’ accumulation like previous study (Wang et al. 2001, Wan et al. 2004).

However, study area in this study is satisfied one important condition in using VTCI method for monitoring drought, which area should large enough to provide a wide range of NDVI and surface soil moisture condition.

VTCI has been estimated for the study area for each pixel by using equation (3) and (5) (or (6)). The VTCI images of the study area were shown in Fig. 3 and Fig.

4. In general, the value of VTCI ranges from 0 to 1.

However, in this study, because images were somewhat affected by cloud, therefore, small portion of error T

1 + (λ× ) ln ε

σ c

LST

NDVIi.max

_ LST

NDVIi

LST

NDVIi.max

_ LST

NDVIi.min

T ρ

(5)

could not be avoid and made VTCI values abnormal.

What is more, since the equations (5) and (6) were derived from scatter plot, several points may not belong in the range of control. Even though this should not be considered as error, but it is indeed make the value out of the range.

The category of drought situation could define to heavy drought (0~0.2), medium drought (0.21~0.4), light drought (0.41~0.6), normal (0.61~0.8), and wet (0.81~1) (Wang et al. 2001). According to this definition, the drought condition in 1990, most parts are in the range of 0~0.8 showed in Fig. 3, and within the bounds of this range, value from 0 to 0.6 in

majority. In other words, the soil moisture conditions are not good. We defined the NDVI value in three classes and observed distribution change of each area:

0.01~0.2 as soil, 0.21~ 0.7 as sparsely distributed vegetation and 0.71~1 as full vegetated area. The distribution changes of each classes is easy to catch out, if comparing three images that NDVI, VTCI in 1990 and NDVI in 2011 (Fig. 3). Comparing they are area which marked with circles showed in Fig. 3, the trend may obviously. The full vegetated area, area 2 which VTCI defined as combination of medium and light drought, changed to sparsely distributed vegetation area. The NDVI for area 1 and 3 are degraded slightly Fig. 2. 1990 (left) and 2011 (right) scatterplots of NDVI and LST in Bulgan.

Fig. 3. Comparison of vegetation distribution between 1990 and 2011 with 1990 VTCI.

1990 NDVI 1990 VTCI 2011 NDVI

(6)

under the combination of heavy and medium drought that was defined by VTCI. Moisture condition of area 1 and 3 are more severe than the area 2. However, there is more vegetation degradation at area 2, but not at area 1 and 3. This result shows that high latitude area is more sensitive than lower altitude area to drought condition.

According to the estimation in this study, the southern part area was analyzed in situation of highly drought in 1990 (Fig. 3). However, there was no obvious change of vegetated area, this is because the area was already in severely drought, and vegetation may highly adapt.

The results shown in Fig. 3, illustrated VTCI as a thematic map for efficiency desertification monitoring is helpful. Nonetheless, considering that desertification is a complicated process, large uncertainties still exist since we did not consider natural disaster and human activities. Human activates can be separated into two parts, positive and negative. Preventive measures, afforestation or educations are included in positive way.

Particularly, since importance of forest is raised as a major carbon pool in land, these activities are brightened in many countries. However, in many

Fig. 4. (a) 1990 (left) and 2011 (right) VTCI. (b) Differences of drought condition between 1990 and 2011(left), and 2011 NDVI (right).

(b)

(a)

(7)

developing countries, due to economic necessity, negative side is difficult to avoid. Actually, in Mongolia, livestock density exceeds the carrying capacity due to herders’ economic well-being has generally improved with increased livestock numbers.

Due to a rise in the price of cashmere, goat numbers have tripled since 1990 (Chuluun, 2010b). Human impacted deforestation and degradation would come next, and include unwise forest management, abandoned croplands, mining activities and unpaved multi-track roads. In the other hand, we have no choice to select two years because of the scene quality and absence of some scenes, this make lack evidence of continuous trend. What is more, this study did not perform field survey. Although, the soil surface moisture was simulated by using the soil real thermal inertia model (Wang et al., 2001), and VTCI can be applied to monitor drought occurrence at a regional level and to capture the distribution of drought.

However, the accuracy of VTCI faces to challenge, since it is derived from NDVI and LST. Because of the man-made creation like asphalt and concrete which could affect surface temperature much and make it abnormally high, even in vegetation flourishing area.

Also, something such as lake and reservoir can make surface temperature low in the vegetation sparseness area. Therefore, spatial resolution will play an important role for VTCI accuracy. For improve accuracy of VTCI, field survey will come to necessary.

In addition, we compared VTCI images of 1990 and 2011 with NDVI image in 2011, and tried to find the area which has a risk to be degraded (Fig. 4). Area 4, marked with circle has the most danger. Although the prediction may somewhat be rough, due to the problems that were mentioned above, that area worth to note and need to observe. Moisture condition in several portions got better in 2011 than 1990.

Considering global warming as an undeniable trend and under the assumption, this phenomenon may be influenced by positive affect of human activity or just

a temporal melioration.

4. Conclusion

In this study, we attempted to find out the feasibility of VTCI for desertification monitoring. According to analyzing, we found that most parts of Bulgan province were in situation of drought (VTCI value 0~0.6) in 1990. NDVI value was classified three classes in this study, and based on this range full vegetated area (NDVI 0.71~1) was much degraded from 1990 to 2010. Similar trend can be seen at the area that vegetation sparsely distributed (NDVI 0.21~0.7).

Comparing the VTCI thematic map with NDVI map both in1990 and 2010, we find out that there is somewhat relationship between images and mark out 3 areas to make the phenomena obviously. According to this phenomenon, we got the area that most in danger to be degraded.

However, there are still many areas could not be illustrated by VTCI thematic map. This should be contributed by assumption we made. That means this study did not consider the natural disaster and human influence, however, there are powerful impact on desertification process. That might makes the prediction in this study in not enough to cover the whole study area. In addition, the accuracy of VTCI can be influenced much by spatial resolution; due to the pixel size decide how many properties would be regard as one single value.

Although all these uncertainties make the prediction

rough, however, this study is still helpful as a material

to provide a possible approach to prediction and

strategic guidance for combat desertification and to

allocate use of labour force.

(8)

Acknowledgements

This study was carried out with the support of

“Forest Science Technologies Development Project (Project Number: S211213L030320)” provided by the Korea Forest service.

References

Artis, D.A. and W.H. Carnahan, 1982. Survey of emissivity variability in thermography of urban areas, Remote Sensing of Environment, 12: 313- 329.

Altanbagana, M., T. Chuluun, and D. Ojima, 2010.

Vulnerability Assessment of the Mongolia Rangeland Ecosystems, Institute for Global Environmental Strategies (IGES), June 17-18.

Banzragch, Ts. and S. Enkhbold, 2010. New Policy on Combating Desertification in Mongolia, Institute for Global Environmental Strategies (IGES), June 17-18.

Carlson, T.N., R.R. Gillies, and E.M. Perrry, 1994. A method to make use of thermal infrared temperature and NDVI measurements to infer soil water content and fractional vegetation cover, Remote Sensing Reviews, 9: 16-173.

Collado, A.D., E. Chuvieco, and A. Camarasa, 2002.

Satellite remote sensing analysis to monitor desertification processes in the crop-rangeland boundary of Argentina, Journal of Arid Environments, 52: 121-133.

Cohen, B.C. and S.N. Goward, 2004. Landsat’s role in ecological application of remote sensing, BioScience, 54(6): 535-545.

Chander, G., B.L. Markham, and D.L. Helder, 2009.

Summary of current radiometric calibration coefficients for Landsat MSS, TM, ETM+, and EO-1 ALI sensors, Remote Sensing of

Environment, 113: 893-903.

Chuluun, T., 2010a. Climate Change and Sustainable Development of Mongolia: Summary of Papers, Institute for Global Environmental Strategies (IGES), June 17-18.

Chuluun, T., 2010b. Opportunities of Synergies between Climate Change, Desertification, Conservation, and Human Development at Multiple Scales, International Conference on Climate, Sustainability and Development, Fortaleza, Brazil, August 16-20.

Dagvadorj, D., 2010. The Climate Change Policy and Measures in Monglia. Institute for Global Environmental Strategies (IGES), June 17-18.

Gillies, R.R., T.N. Carlson, J. Cui, W.P. Kustas, and K.S. Humes, 1997. A verification of the

‘triangle’ method for obtaining surface soil water content and energy fluxes from remote measurement of the Normalized Difference Vegetation Index (NDVI) and surface radiant temperature, International Journal of Remote Sensing, 18: 3145-3166.

Goetz, S.J., 1997. Multi-sensor analysis of NDVI, surface temperature and biophysical variables at a mixed grassland site, International Journal of Remote Sensing, 18: 71-94.

Geist, H., 2005. The Causes and Progression of Desertification, Ashgate Publishing, Ltd., London, UK.

Markham, B.L., and J.K. Barker, 1985. Spectral characteristics of the LANDSAT Thematic Mapper sensor[J], International Journal of Remote Sensing, 6: 697-716.

Masek, J.G., C. Huang, R. Wolfe, W. Cohen, F. Hall, J.

Kutler, and P. Nelson, 2008. North American forest disturbance mapped from a decadal Landsat record, Remote Sensing of Environment, 112: 2914-2926.

Natsagdorj, L., 2004. Total evaporation change issues

in the Mongolian territory, WMI, Scientific

(9)

Journal, 26: 42-55.

Natsagdorj, L., 2006. Climate change factors issues on pastoral degradation of Mongolia, Improvement issues on pastoral management, 125-140.

Price, J.C., 1990. Using spatial context in satellite data to infer regional scale evapotranspiration, IEEE Transactions on Geoscience and Remote Sensing, 28: 940-948.

Tsujimura, M., N.Wakasugi, X. Sun, and T. Endo, 2010. Completion Report of International Internship in Mongolia, October 25 - November 1, University of Tsukuba, Japan.

Tsogoo B., D. Borchuluun, J. Dorjpure, and D.

Sengelmaa, 2010. Technology Transfer Role in Alleviation of Climate Change Impact in Mongolia, Institute for Global Environmental Strategies (IGES), June 17-18.

United Nations Convention to Combat Desertification (UNCCD). 1994. National Plan of Action to Combat Desertification in Mongolia, Ulaanbaatar, 226.

Wang, P.X., X.W. Li, J.Y. Gong, and G.H. Song, 2001.

Vegetation Temperature Condition Index and Its Application for Drought Monitoring, Proc.

of International Geoscience and Remote Sensing Symposium, 9-14 July 2001. Sydney, Australia (Piscataway, NJ: IEEE), 141-143.

Woodcock, C.E., S.A. Macomber, M. Pax-Lenney, and W.C. Cohen, 2001. Monitoring large areas for

forest change using Landsat: Generalization across space, time and Landsat sensors, Remote Sensing of Environment, 78: 194-203.

Wu, B. and L. Ci, 2002. Landscape change and desertification development in the Mu Us Sandland, Northern China, Journal of Arid Environments, 50: 429-444.

Wan, Z., P. Wang, and X. Li, 2004. Using MODIS Land Surface Temperature and Normalized Difference Vegetation Index products for monitoring drought in the southern Great Plains, USA, International Journal of Remote Sensing, 25(1): 61-72.

Xiao R.B., Z.Y. Ouyang, H. Zheng, W.F. Li, E.W.

Schienke, and X.K. Wang, 2007. Spatial pattern of impervious surfaces and their impacts on land surface temperature in Beijing, China, Journal of Environmental Sciences, 19: 250-256.

Yang X., K. Zhang, B. Jia, and L. Ci, 2005.

Desertification assessment in China: An overview, Journal of Arid Environments, 63:

517-531.

Zhang Y., Z. Chen, B. Zhu, X. Luo, Y. Guan, S. Guo,

and Y. Nie, 2008. Land desertification

monitoring and assessment in Yulin of

Northwest China using remote sensing and

geographic information systems (GIS),

Environmental Monitoring and Assessment,

147: 327-337.

수치

Fig. 1.  Geographical location and elevation distribution of study area.
Fig. 3.  Comparison of vegetation distribution between 1990 and 2011 with 1990 VTCI.

참조

관련 문서

COMS에는 GOCI (Geostationary Ocean Color Imager) 와, MI (Meteorlogical Imager) 가 탑재되어 있으며, 두 센서로부터 얻어진 지표면 온도(Land Surface

study, we use SPOT/VEGETATION satellite image to calculate NDWI (Normalized Difference Water Index) around study area desert for monitoring of status of

In this study, we perform land surface monitoring of NDVI (Normalized Difference Vegetation Index) variation by using remote sensing data during 1999-2005

The structural vegetation index, such as normalized difference vegetation index (NDVI), effectively expressed the crop phenology including growth and development of

Analysis of Elevation NDVI (Normalized Difference Vegetation Index) for Taxus cuspidata, Pinus densiflora, Zelkova serrata..

Effect of a Sudden Increase in Light Intensity on Normalized Difference Vegetation Index (NDVI) Reflected from Leaves of Tobacco..

하고 있는 인공위성을 이용하여 위성자료로부터 쉽게 얻을 수 있는 정규식생지수(Normalized 를 이용 Difference Vegetation Index ; NDVI) 함으로서 정량적으로 표현할 수 있다

To monitor forage crop by multispectral camera with UAV, we tested four types of vegetation index Normalized Difference Vegetation Index; NDVI, Green Normalized Difference