• 검색 결과가 없습니다.

Relationship between sea ice concentration and sea ice albedo over Antarctica

N/A
N/A
Protected

Academic year: 2021

Share "Relationship between sea ice concentration and sea ice albedo over Antarctica"

Copied!
5
0
0

로드 중.... (전체 텍스트 보기)

전체 글

(1)

1. Introduction

Recently, Antarctica and Arctic have been providing remarkable examples of rapid changes of the environment (King, 2014). All of polar regions are covered by snow or ice. Especially, sea ice cover affects the regional climate and has an impact on global climate (Allison, et al., 1993). Also Antarctica and Arctic to appear to have contrasting trends of annual sea ice from the existent satellite data; the whole Antarctic sea ice extent (SIE) shows increase trend, whereas in the Arctic appears to have the trend of decrease in circumpolar (Stroeve et al., 2007; Cavalieri

and Parkinsuin, 2008; Simpkins et al., 2013).

Nevertheless, it has been only recent to quantitatively analyze the amount of sea ice cover over the Arctic and its relation to the climate change since the late the twentieth century. Since passive-microwave satellite images allow to monitor the ice from October 1978 (Comiso et al., 2008). So that we need to understand how sea ice changes in polar regions for long-term period and large-scale area. There are many factors for detecting change of the sea ice. Generally used Sea Ice Concentration (SIC) and ice albedo are generally used to detect the change of sea ice. SIC is a ratio of the sea ice present at a point over the ocean. That is an indicator

Relationship between sea ice concentration and sea ice albedo over Antarctica

Minji Seo, Chang Suk Lee, Hyunji Kim, Morang Huh and Kyung-Soo Han

Department of Spatial Information Engineering, Pukyong National University

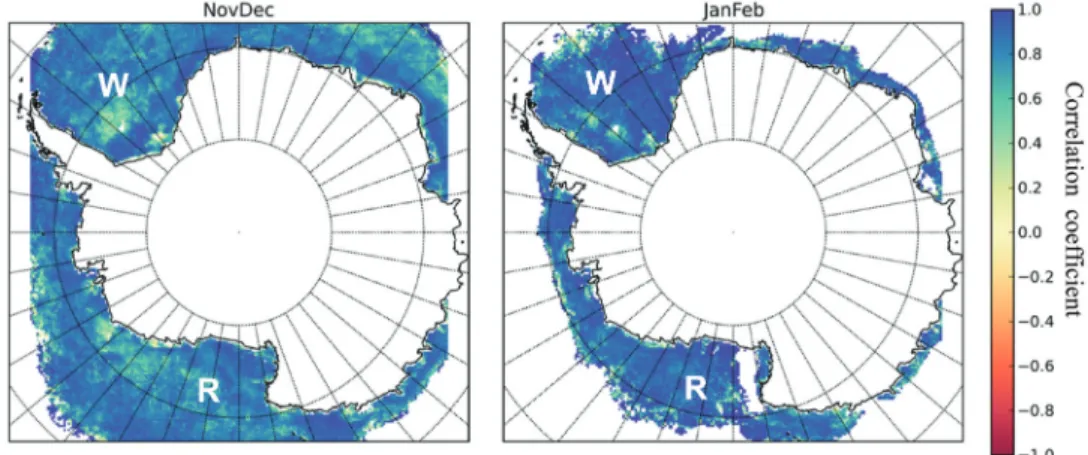
Abstract : Sea ice is a key parameter for understanding the climate change in cryosphere. In this study, we investigated the correlation with the factors that influenced change of the sea ice extent. We used the Sea Ice Concentration (SIC) from Ocean and Sea Ice Satellite Application Facility (OSI-SAF), and surface albedo provided by The Satellite Application Facility on Climate Monitoring (CM SAF). We converted the same temporal and spatial resolution of the data and detected the sea ice using SIC data. We performed the relationship analysis between SIC and sea ice albedo. As a result, we found they have a strong positive correlation. We performed the linear regression between SIC and sea ice albedo, and found they have high- level coefficient of determination. It shows using either SIC or sea ice albedo is possible to estimate the sea ice products.

Key Words : Antarctica, sea ice concentration, sea ice albedo

Received August 18, 2015; Revised August 23, 2015; Accepted August 24, 2015.

Corresponding Author: Kyung-Soo Han ([email protected])

This is an Open-Access article distributed under the terms of the Creative Commons Attribution Non-Commercial License (http://creativecommons. org/licenses/by-nc/3.0) which permits unrestricted non-commercial use, distribution, and reproduction in any medium, provided the original work is properly cited

Letter

(2)

that transmission of climatic change in high-latitude. It is important that its boundary state for the accuracy of atmospheric models (NCAR, 2013). Albedo is a ratio of the reflected radiation from the terrestrial surface, and it is an important factor affecting the radiation budget and climate change (Schaaf, 2009). The albedo is the highest in snow and ice than any other land types on the Earth surface (Laine, 2008). Generally, albedo values are changed by type or age of ice. Therefore, trend or approximately estimation of sea ice is analyzed using albedo. It means, variability of albedo is one of the factors that detect the change of sea ice. This study examines the relationship between SIC and sea ice albedo, and we using the data based on satellite data over 27 years (1983 to 2009). The study set out to (1) analyze on correlation between SIC and surface albedo during the study period, (2) to analyze on linear their regression, and (3) to define the tendency of SIC compared with sea ice albedo trend.

2. Data and Method

In this study, an analysis of the relationship between SIC and sea ice albedo was performed on data from 1983 to 2009 from satellites over the ocean contiguous to Antarctica. Ice products based on the satellite such as SIC and SIE control Sea Surface Temperature (SST) in high latitudes (Stark et al., 2007). Operational SST and Sea Ice Analysis (OSTIA) system use SIC data from Ocean and Sea Ice Satellite Application Facility (OSI-SAF) (Donlon et al., 2012). The OSI-SAF in the European Organisation for the Exploitation of Meteorological Satellites (EUMETSAT) provides Global SIC reprocessing dataset over a periods of 38 years (1978-2015). The dataset from passive microwave sensors are on board of SMMR, SSM/I and SSMIS. The SIC data has as percentage an unit. Its projection is Lambert Azimuthal Equal Area (LAEA) and spatial resolution is 12.5 km over Antarctic area

(OSI SAF, 2015). The Satellite Application Facility on Climate Monitoring (CM SAF) in EUMETSAT provides surface albedo as one of products which include the CM SAF Cloud, Albedo, Radiation dataset, AVHRR-based, and Edition 1 (CLARA-A1) over a periods of 28 year (1982-2009). Surface albedo data was composed by the Advanced Very High Resolution radiometer (AVHRR) on National Oceanic and Atmospheric Administration (NOAA). Its projection is LAEA, spatial resolution is 0.25 degree over Antarctic area, and temporal resolution is monthly. To observe surface albedo, solar radiation is essential; thereby, the data was collected near summer time due to polar nights in Antarctica. For that reason, we chose the study periods of 4 month (November to February) of each year. In Cavalieri and Parkinson’s study (2008), maximum extent of sea ice was observed in September, where as the minimum occurred in February from 1979 to 2006. And we devide the months into 2 terms, Nov- Dec (ND) and Jan-Feb (JF). According to Cavalieri and Parkinson’s study (2008), we analyzed the two periods (ND and JF) for observing the characteristic of SIE. We detected the sea ice area (as sea ice cover). It was detected a threshold method, that a general threshold is set at least 15% of SIC upto 30%. In the study, we selected a threshold of 30% for selecting the sea ice with a certainty. Next, we analyzed the relationship between SIC and sea ice albedo using a static method.

3. Results

A correlation coefficient is a quantitative value that

illustrates the statistical relationship between more than

two data. We calculated the correlation coefficient

between SIC and sea ice albedo from 1983 to 2009 over

the ocean adjacent to Antarctica. The extent of sea ice

at ND is broader than the extent of JF in the study area

(The boundary of shaded part of the Fig. 1 is the extent

of sea ice). Also, most of sea ice exists in Ross sea and

(3)

Weddell sea in Jan-Feb as shown in Fig. 1 (R is Ross sea, W is Weddlle sea). It is connected to Rignot et al.

(2008) that ice mass gains the ice mass in the area. Fig.

1 represents the spatial distribution of correlation coefficients each period. All periods have a strong positive correlation that if SIC gets higher values, sea ice albedo trends will be positive. The trend shows the same results as the previous study of Allsion et al.

(1993). Border of Antarctica shows a strong relationship of SIC and sea ice albedo while boundary of positive and negative trends of SIC in result of Liu et al. (2004) shows a relatively low correlations.

Albedo has different values difference depending on the types of snow and ice. According to Nicolaus (2012), multi-year ice has higher short-wave albedo than first-year ice. In addition, generally ice types such as nilas, frost flower, slush, and first-year ice have a characteristic that ice is thicker, the albedo value increase (Zatko and Warren, 2015).

Fig. 2 shows a density plot of SIC and sea ice albedo for identifying the distribution of values. A density plot has advantageous to visually interpret the concentration of values and it filters out the outliers such as errors from retrieval and regional characteristics. In the plot,

Fig. 1. The spatial distribution of correlation coefficient between Sea ice concentration and Sea ice albedo from 1983 to 2009. Red in the scale is a negative correlation and the blue is a positive correlation. W stands for Weddle sea and R stands for Ross sea.

Left figure describes the periods of Nov-Dec and right describes the periods of Jan-Feb.

Fig. 2. Density plots of Sea ice concentration and Sea ice albedo: the period of Nov-Dec (left) and period of Jan-Feb (right), white

line is trend line.

(4)

horizontal axis represents the SIC, vertical axis represents the sea ice albedo, and the shaded part is count of the data. The graph shows predominantly clustered over 90% of SIC and 70% of sea ice albedo over 90% and 30% respectively. In addition, we performed the linear regression between SIC and sea ice albedo. They have high level of coefficients of determination (R

2

), 0.8342 in ND and 0.8131 in JF.

We found high-level R

2

between SIC and sea ice albedo over the whole Antarctic ocean. We selected the Ross sea to analyze time series due to its importance referred by several previous studies. That area has positive trend of sea ice coverage and season length (King, 2014; Simpkins et al., 2013). Fig. 3 shows time series of the SIC and sea ice albedo. Almost all of them represent the SIC values are higher than sea ice albedo (the result is the same as Fig. 2) and have stronger positive trend since 2000. As a result, SIC and sea ice albedo show the same time series and positive trend in the area. Two factors are not only analogous value, but also similar tendency in time series.

4. Concluding Remarks

We performed the correlation analysis on Sea ice concentration and sea ice albedo. The results showed that most of them have a strong positive correlation. It is possible to estimate the ice thickness or ice types only using the SIC data, due to albedo has the difference values according to the ice characteries (Allsion et al., 1993). In a period of ND, both SIC and sea ice albedo are higher than JF. It means that mid-summer (JF) absorbs more solar radiation and melts the sea ice. Also, there is a high coefficient of determination between sea ice concentration and sea ice albedo. In other words, if we have either SIC or albedo data, it is possible to estimate the other ice product such as SIE. Most of the SIC data are retrieved using satellites with microwave sensors. However, the microwave data is not available for a long-term compared with the optical satellite data.

Therefore, this results represent the potential to estimate sea ice products for a long-term and in a large-scale using visible channel data.

Fig. 3. Time series of SIC and sea ice albedo in Ross sea during the study period, circle-line is sea ice albedo and line-triangle is

SIC: periods of Nov-Dec (a); periods of Jan-Feb(b).

(5)

Acknowledgment

This work was supported by a Research Grant of Pukyong National University(2014Year).

References

Allison, I., E.R.E. Brandt, and S.G. Warren, 1993.

Albedo, Thickness Distribution, and Snow Cover, Journal of Geophysical Research, 98(C7): 12-417.

Cavalieri, D.J. and C.L. Parkinson, 2008. Antarctic sea ice variability and trends, 1979-2006, Journal of Geophysical Research: Oceans, 113(C7):

C07003

CM SAF, 2012, CM SAF Cloud, Albedo, Radiation dataset, AVHRR-based, Edition 1 (CLARA-A1) Surface Albedo Product User Manual.

Comiso, J.C., C.L. Parkinson, R. Gersten, and L, Strock, 2008, Accelerated decline in the Arctic sea ice cover, Geophysical Research Letters, 35(1): L01703

Donlon, C.J., M. Martin, J. Stark, J. Roberts-Jones, E.

Fiedler, and W. Wimmer, 2012. The operational sea surface temperature and sea ice analysis (OSTIA) system, Remote Sensing of Environment, 116: 140-158.

King, J., 2014. Climate science: A resolution of the Antarctic paradox, Nature 505(7484): 491-492.

Laine, V., 2008. Antarctic ice sheet and sea ice regional albedo and temperature change, 1982-2000, from AVHRR Polar Pathfinder data, Remote Sensing of Environment 112(3): 646-667 Liu, J., J.A. Curry, and D.G. Martinson, 2004.

Interpretation of recent Antarctic sea ice variability, Geophysical Research Letters, 31(2): L02205

National Center for Atmospheric Research Staff (Eds).

2013. The Climate Data Guide: Sea Ice Concentration data: Overview, Comparison table and graphs. https://climatedataguide.

ucar.edu/climate-data/sea-ice-concentration- data-overview-comparison-table-and-graphs.

Nicolaus, M., C. Katlein, J. Maslanik, and S.

Hendricks, 2012. Changes in Arctic sea ice result in increasing light transmittance and absorption, Geophysical Research Letters, 39(24): L24501

Ocean and Sea ice Satellite application Facility (OSI SAF), 2015, Global Sea Ice Concentration Reprocessing Product User Manual.

Rignot, E., J.L. Bamber, M.R. Van Den Broeke, C.

Davis, Y. Li, W.J. Van De Berg, and E. Van Meijgaard, 2008. Recent Antarctic ice mass loss from radar interferometry and regional climate modelling, Nature Geoscience, 1(2): 106-110.

Schaaf, C.B., 2009. ALBEDO albedo and reflectance anisotropy, Global Terrestrial Observing System, Rome.

Simpkins, G.R, L.M. Ciasto, and M.H. England, 2013.

Observed variations in multidecadal Antarctic sea ice trends during 1979-2012, Geophysical Research Letters, 40(14): 3643-3648.

Stark, J.D., C.J. Donlon, M.J. Martin, and M.E.

McCulloch, 2007. OSTIA: An operational, high resolution, real time, global sea surface temperature analysis system, Proc. of Oceans 2007- Europe, Aberdeen, Scotland, Jun. 18-21, IEEE: 1-4

Stroeve, J., M.M. Holland, W. Meier, T. Scambos, and

M. Serreze, 2007. Arctic sea ice decline: Faster

than forecast, Geophys. Res. Lett., 34: L09501

Zatko, M.C. and S.G. Warren, 2015. East Antarctic sea

ice in spring: spectral albedo of snow, nilas, frost

flowers and slush, and light-absorbing impurities

in snow, Annals of Glaciology, 56(69): 53.

수치

Fig. 2 shows a density plot of SIC and sea ice albedo for identifying the distribution of values
Fig. 3.  Time series of SIC and sea ice albedo in Ross sea during the study period, circle-line is sea ice albedo and line-triangle is SIC: periods of Nov-Dec (a); periods of Jan-Feb(b).

참조

관련 문서

metallic bond: attractive interactions / bonds in metals are mediated by free moving valence electrons (electron sea) between positively charged atoms over entire sample

Huggins, 1989, Physical response of winter orographic clouds over the Sierra Nevada to airborne seeding using dry ice or silver iodide.. Pitter, 1988, Rapid

By the way, because the mass rearing of sea cucumber is not achieved until now, culture system to rear sea cucumber in large quantity is required

Characteristics of water quality at East China Sea in southwestern sea of Jeju Island in summer..

Comparison of the monthly average difference between surface temperature and sea surface temperature at Chilbaldo on foggy(f_avg) and no foggy(nf_avg) day cases from

To find out the main features of the heat exchange from the interaction between atmosphere and sea, this thesis covers the meterological property and

Students with family obligations and the revival of individual success is complicated on sail.. Second image of the sea is energy of young and

fully developed sea: unlimited fetch and duration of wind; wind energy input is balanced by energy dissipation due to wave breaking.. growing sea: limited fetch and