Print ISSN: 2288-4637 / Online ISSN 2288-4645 doi:10.13106/jafeb.2020.vol7.no10.1129
*Acknowledgements:
This publication was supported by the Deanship of Scientific Research at Prince Sattam bin Abdulaziz University, Alkharj, Saudi Arabia.
1
First Author and Corresponding Author. Assistant Professor, Accounting Department, College of Business Administration, Prince Sattam bin Abdulaziz University [Postal Address: Zayed bin Haretha Street, Al-Salam District, Al-Kharj, Al-Rayadh, 16244, Saudi Arabia]
Email: [email protected]
2
Lecturer, Accounting Department, College of Business Administration, Prince Sattam bin Abdulaziz University, Saudi Arabia. Email: [email protected]
3
Assistant Professor, Accounting Department, College of Business Administration, Prince Sattam bin Abdulaziz University, Saudi Arabia. Email: [email protected]
© Copyright: The Author(s)
This is an Open Access article distributed under the terms of the Creative Commons Attribution Non-Commercial License (https://creativecommons.org/licenses/by-nc/4.0/) which permits unrestricted non-commercial use, distribution, and reproduction in any medium, provided the original work is properly cited.
Factors Influencing Usage of University Mobile Application Among University Students*
Khaled Salmen ALJAAIDI
1, Omer Ali BAGAIS
2, Raj Bahadur SHARMA
3Received: August 01, 2020 Revised: September 06, 2020 Accepted: September 13, 2020
Abstract
This study investigates the factors influencing the usage of PSAU Mobile Application by the students at Prince Sattam bin Abdulaziz University (PSAU). This study used Technology Acceptance Model (TAM) as a framework to predict the factors influencing 67 students’
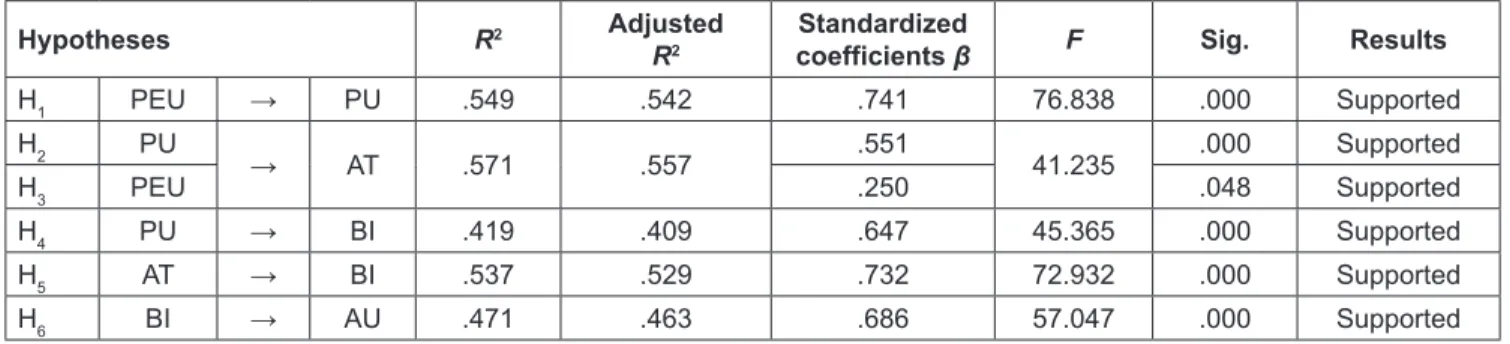
usage of PSAU M-Application. The results of this study were consistent with the TAM framework in predicting the actual usage of the PSAU mobile application for academic activities. The results indicated a significantly positive association of the perceived ease-to-use with perceived usefulness, significantly positive associations of the perceived ease-to-use and the perceived usefulness with the attitude toward the usage of the PSAU’s mobile application, a significantly positive association of the perceived usefulness with the behavioral intention toward the usage of the PSAU’s mobile application, a significantly positive association of the students’ attitude toward the usage of the PSAU’s mobile application with the behavioral intention of using the application, and a significantly positive association of the behavioral intention with the actual usage of the PSAU’s mobile application. The results of this study should be useful to educational policymakers at PSAU University and elsewhere, as there is an opportunity to enhance the existing technology or adopt new technologies for academic activities.
Keywords: Technology Acceptance Model, Mobile Application, University Students JEL Classification Code: D83, M31, M39
using the Technology Acceptance Model (TAM) because it is a frequently used model among theoretical models that explain users’ acceptance and application of technology (Davis, 1989; Davis et al., 1989). Extension of the TAM model was done by David et al. (1992) and Gefen et al.
(2003). This model has found wide application in developed countries compared to developing ones, among them Arabic nations such as Saudi Arabia. According to TAM, the users of new technology and how they apply it are influenced by several factors. Based on a review of the existing TAM literature, limited research has been conducted on university students’ use of mobile applications for academic purposes.
To the researchers’ best knowledge, no research has been conducted at PSAU to study the factors that affect the use of mobile applications in the institution. Consequently, to improve future acceptance and usage of PSAU mobile applications by students, understanding the factors that affect its use is necessary. Theoretically, the importance of this study is its contribution to expanding research on the academic use of mobile applications in institutions of higher learning. Further, since this study adds empirical data to a research area with inadequate data and studies conducted in
1. Introduction
This study examines the factors that affect accounting
student’s actual usage of PSAU mobile applications for
their academic studies. Prediction of these factors is made
the KSA setting, it is valuable (Bahaj et al., 2019) where this environment is characterized to have a paucity of research.
Through a systematic research, insight will be gained on the student, institutional, and academic factors in mobile application usage. Additionally, the review will provide an understanding of strategies to use to encourage the download and academic use of mobile applications by students.
University administrators dealing with academic affairs can use the findings of this study to either improve the use of mobile applications by students or to come up with practical methods that they can use to encourage students to start using the applications. Also, the empirical data from this research will add evidence to the fields of technology and academics through prediction of acceptance of the M-application among PSAU students using the TAM model.
The remainder of the paper proceeds as follows. The next section briefly discusses the literature review and the development of the hypotheses. The third section describes the research design and methodology. The empirical results and discussions of the study are reported in the fourth section, while conclusions and implications are drawn in the final section.
2. Literature Review and Hypothesis Development
Currently, business operations, as well as academic activities, are affected by the use of technology. This is seen in the way that the introduction of the Internet has changed learning activities and dissemination of knowledge. An unprecedented growth rate is evident in higher learning, a trend resulting from the virtual conveyance of academic programs made possible by new and enabling technologies.
Many scholars and academicians center debates and discussions around the application of technology in education since it influences education greatly, universities being the major service providers of online education. Seemingly, adopting technology in education is of great importance in the provision of updated information to students using methods that are better and more creative (Bahaj et al., 2019; Nedeva & Zlatev, 2013; Khwaldeh et al., 2017;
Kim-Soon et al., 2014). Presently, owing to the increase in mobile application availability, there has been a change in the computing experience. The development of mobile applications involves the formation of computer programs that are used in mobile devices, for example, smartphones and watches and tablets. The development of mobile applications is done for different operating systems, including Android, iOS, and Windows Mobile (Hamilton, 2019). The portability of mobile phones is the main advantage. The invention of mobile applications for smartphones gave a new approach to the service sector since the apps are developed to perform a given task. Widespread use of these apps has largely reduced
time consumption as access to various goods and services is granted easily by using mobile devices (Bobbby, 2018).
Students tend to use mobile phones for everything, hence the name smartphone. The world is accessible, allowing students to gain any form of information wherever they are, reducing the need for library visitations and search for data, and making a mobile phone useful for various purposes such as this. Mobile applications grant the ease of access to information, each having unique features that allow it to offer its own set of services. Using traditional methods does not allow institutions to pay attention to students equally.
The use of technology, however, makes this a possibility since institutional communication applications can be used to convey information to all students, for example, by informing them about new schedules, various meetings and conferences, and other social activities (Roy, 2017; Lee et al., 2016). Various leading companies and developers have developed educational apps that have influenced people around the world. These apps are valuable to both students and educationists because they provide easy and fast access to good-quality educational materials that were traditionally accessible only in libraries. The apps offer these services through e-Books, e-Library, and informative videos and games (Oza, 2017).
Prince Sattam bin Abdulaziz University has released a mobile application called PSAU, which is developed for various OS such as Android, iOS, and Windows Mobile. The application is free for downloading for Android device by accessing Google Play Store and for iOS device by accessing Apple App Store. The PSAU mobile application is a friendly applications designed to make it easier for students to access their academic services portal, email, e-learning portal, summer training system, GPA calculation, Gartner, students’
GPA, students’ employment system, IT services management system, students’ information update, training center at community service, E-amend registration choices, students’
activity services, Tawasol system, release letter, graduation certificate service, student status service, graduation projects, semester re-join service, transferring service, and academic recommendation for postgraduate study.
Technology Acceptance Model was developed and introduced by Davis (1989), as a theoretical extension of the Theory of Reasoned Action (TRA). This model is considered the most accepted model compared to other theoretical models that try to explain the relationship between user attitudes, contentment, and behavioral intention (Davis, 1989; Davis et al., 1989). The TRA (Fishbein & Ajzen, 1975; Ajzen & Fishbein, 1980) predicts acceptance by users depending on Perceived Usefulness (PU) and Perceived Ease of Use (PEU). The TAM builds on this idea. According to the TAM, PU and PEU dictate how users accept technology.
Further, TAM indicates that PEU directly influences PU
because a user will view technology as useful if it is easy
to use. TAM was later developed to predict the relationship between PU and PEU and attitude toward technology (AT), behavioral intention (BI) to technology use, and actual use (AU) of the technology. According to TAM, BI is directly influenced by both PU and AT as well as PU alone. BI also impacts the AU (Davis, Bagozzi & Warshaw, 1989; Mallya
& Lakshminarayanan, 2017; Bahaj et al., 2019).
Thus, based on TAM as a framework for examining the factors influencing the usage of PSAU mobile application among accounting students from College of Business Administration at Prince Sattam bin Abdulaiziz PSAU and the extant research (e.g., Mallya & lakshminarayanan, 2017;
Ranta & Mehra, 2015; Gajendra et al., 2014; Farahat, 2012;
Dhume et al., 2012; Suki & Ramayah, 2010; Park, 2009), the following testable hypotheses were developed:
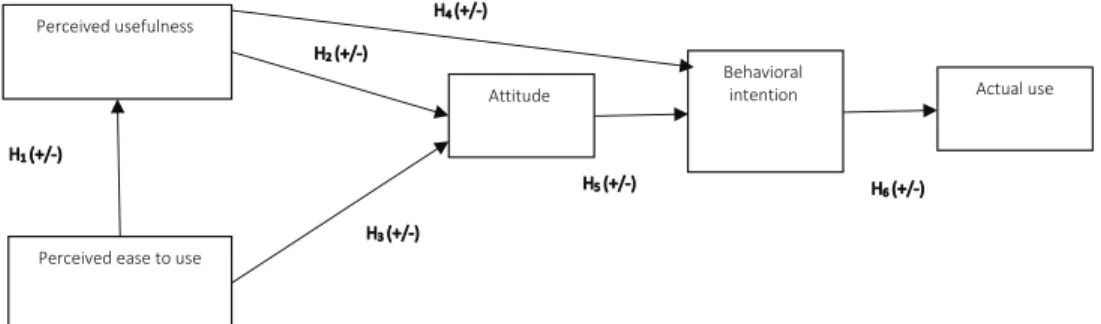
H1: The perceived ease of using the PSAU mobile appli- cation has a direct influence on perceived usefulness of the application for the academic purposes.
H2: Perceived usefulness of the PSAU mobile application has a direct influence on the attitude to use the application for the academic purposes.
H3: Perceived ease of using the PSAU mobile application has a direct influence on the attitude to use the application for the academic purposes.
H4: Perceived usefulness of the PSUA mobile application has a direct influence on the behavioural intention toward using the application for the academic purposes.
H5: The attitude toward using the PSAU mobile application has a direct influence on the behavioural intention to use the application for the academic purposes.
H6: The behavioural intention toward using the PSAU mobile application has a direct influence on the actual usage of the application for the academic purposes.
3. Research Methodology 3.1. Questionnaire Design
This study is a quantitative method that was designed to examine the usage of PSAU mobile application by accounting students at Prince Sattam bin Abdulaziz University using Technology Acceptance Model (TAM). This study used the questionnaire as an appropriate data collection instrument for the purpose of answering the determined research questions:
(1) What are the factors that predict accounting students’
usage of PSAU’s mobile application at Prince Sattam bin Abdulaziz University? And, (2) To what extent do the data fit to the TAM for the students in their usage of the PSAU’s mobile application? The model of this study is adopted from the extant research (e.g., Mallya & lakshminarayanan, 2017;
Ranta & Mehra, 2015; Gajendra et al., 2014; Farahat, 2012;
Dhume et al., 2012; Suki & Ramayah, 2010; Park, 2009)
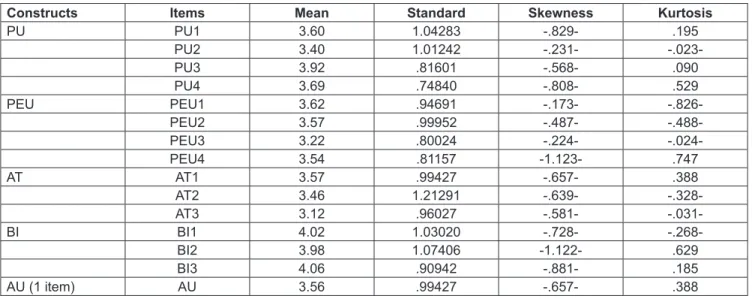
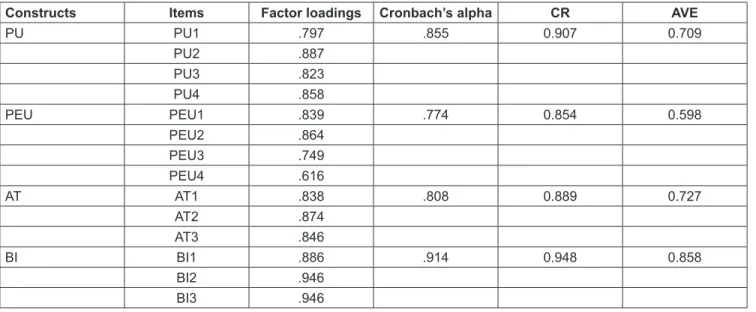
The questionnaire consists of two different sections. The first section included subject information and the second subject included demographic information and questions related to the usage of the PSAU’s mobile application for the academic purposes. To test the face validity and content validity, three subject experts duly reviewed the questionnaire before distributing it out. The final questionnaire is composed of 15 items that represent five constructs, namely, perceived usefulness (PU), perceived ease-to-use (PEU), attitude (AT), behavioral intention (BI), and actual use (AU).
3.2. Instrument of Measurement 3.2.1. Demographic Information
The demographic information in this study includes the gender, level of study, and age. As for the gender, a nominal value of “1” is assigned to male and “2” is assigned to female. With respect to level of study, a nominal value of “1”
is assigned to freshmen, “2” is assigned to sophomore,” 3”
is assigned to junior” and “4” is assigned to senior. In terms of the age, a continuous value is assigned to the variable’s measurement.
3.2.2. Perceived Usefulness (PU)
Perceived usefulness is one the concerns of this study.
This variable is measured using a five-point Likert scale.
The five-point Likert scale is ranging from 1 (strongly agree), indicating the highest level of agreement of the perceived PSAU mobile application as a useful technology, to 5 (strongly disagree), indicating to the lowest level of agreement of perceiving the PSAU mobile application as a useful tool. This variable consists of four items that are used to measure the respondents’ level of agreement toward their perception of the usefulness of the PSAU’s mobile application. This variable was subject to reliability test before it was used for further analysis. The four items constitute the perceived usefulness variable are as follows:
PU1: Using PSAU M-Application would enhance my effectiveness in learning
PU2: Using PSAU M-Application would improve my course performance
PU3: Using PSAU M-Application would improve my productivity in my course
PU4: I find PSAU M-Application useful for my study.
3.2.3. Perceived Ease-to-Use (PEU)
Perceived ease-to-use is one the concerns of this study.
This variable is measured using a five-point Likert scale.
The five-point Likert scale is ranging from 1 (strongly
agree), indicating the highest level of agreement of the perceived PSAU mobile application as an easy to use technology, to 5 (strongly disagree), indicating to the lowest level of agreement of perceiving the PSAU mobile application as an easy to use tool. This variable consists of four items that are used to measure the respondents’ level of agreement toward their perception of the easy-to-use of PSAU’s mobile application. This variable was subject to reliability test before it was used for further analysis. The four items constitute the perceived ease-to-use variable are as follows:
PEU1: I find PSAU M-Application easy to use PEU2: It is easy to navigate on PSAU M-Application PEU3: It is would be easy for me to find the academic-
related information using PSAU M-Application PEU4: My interaction with PSAU M-Application is
clear and understandable.
3.2.4. Attitude (AT)
Attitude toward the PSAU mobile application is one the concerns of this study. This variable is measured using a five- point Likert scale. The five-point Likert scale is ranging from 1 (strongly agree), indicating the highest level of positive attitude toward the PSAU mobile application, to 5 (strongly disagree), indicating to the lowest level of positive attitude toward the PSAU mobile application. This variable consists of three items that are used to measure the respondents’
attitude to toward the PSAU’s mobile application. This variable was subject to reliability test before it was used for further analysis. The three items constitute the perceived ease-to-use variable are as follows:
AT1: It is a good idea to use PSAU M-Application for my study purpose
AT2: I like the idea to navigate on PSAU M-Application to be aware of the academic issues’ updates
AT3: I have a positive attitude toward PSAU M-Application
3.2.4. Behavioral Intention (BI)
Behavioral intention toward the PSAU mobile application is one the concerns of this study. This variable is measured using a five-point Likert scale. The five-point Likert scale is ranging from 1 (strongly agree), indicating the highest level of intention to use the PSAU mobile application, to 5 (strongly disagree), indicating to the lowest level of intention to use the PSAU mobile application. This variable consists of three items that are used to measure the respondents’ intention to use the PSAU’s mobile application. This variable was subject to reliability test before it was used for further analysis. The three items constitute the perceived ease-to-use variable are as follows:
BI1: I intend to frequently navigate on PSAU M-Application
BI2: I intend to be a heavy user of PSAU M-Application BI3: I intend to return to PSAU M-Application often.
3.2.5. Actual Use (AU)
Actual use of the PSAU mobile application is the final concern of this study. This variable is measured using a five- point Likert scale. The five-point Likert scale is ranging from 1 (strongly agree), indicating the highest level of the PSAU’s mobile application usage, to 5 (strongly disagree), indicating to the lowest level of the PSAU’s mobile application usage.
This variable consists of one item that is used to measure the respondents’ level of the PSAU’s mobile application usage. The actual use item constitutes the actual use variable is as follows:
AU I have no difficulty accessing and using PSAU M-Application.
3.3. Model Specification and Analysis
This study applies the Technology Acceptance Model (TAM) to examine the accounting students’ usage of PSAU mobile application. Multiple and Simple regressions were used to produce the results of this study. In particular, the TAM model can be expressed as follows:
Perceived usefulness
Perceived ease to use
Attitude Behavioral
intention Actual use
H1(+/-)
H2(+/-)
H3(+/-) H4(+/-)
H5(+/-) H6(+/-)