Coagulation and Flotation Conditions of Humic Acid by Dissolved Air Flotation
Chang-Han Lee
*Department of Environmental Administration, Catholic University of Pusan, Busan 609-757, Korea (Manuscript received 26 June, 2012; revised 17 July, 2012; accepted 13 August, 2012)
Abstract
Coagulation, flocculation, and dissolved air flotation (DAF) experiments were performed with humic acid to evaluate the influence of operational conditions on removal efficiencies. We investigated coagulation, flocculation, and flotation conditions of humic acid removal using a laboratory-scale DAF system. This paper deals with coagulant type (aluminum sulfate and PSO-M) and the most relevant operational conditions (velocity gradients for coagulation and flocculation, retention time and recycle ratio and flotation time). Results showed that optimal conditions for removing humic acid, yielding CHA removal efficiencies of approximately 85 %, are a recycle ratio of 40 %, coagulant dosages of 0.15 – 0.20 gAl/gHA as aluminum sulfate and 0.03 – 0.12 gAl/gHA as PSO-M, coagulation(400s-1 and 60s), flocculation(60s-1 and 900s or more), and flotation(490 kPa or more and at least 10 min).
Key Words : Humic acid, Coagulation, Flotation, Velocity gradient, Kinetic model, DAF
1)
1. Introduction
Natural organic matter in freshwater supplies consists of two main classes of compounds, i.e., humic and non-humic substances. Humic substances are involved in many chemical and physicochemical interactions in the soil and in aqueous systems.
Humic substances include humic acids (HA), fulvic acids, and humins, which have a wide range of molecular weights and which contain both hydrophilic and hydrophobic functional groups (Jansen et al., 1996). It is possible to determine which of these compounds are responsible for most of the potentially- harmful by-products formed when chlorination is used for disinfection. The humic substances have been considered as the main precursors of
*Corresponding author : Chang-Han Lee, Department of Environmental Administration, Catholic University of Pusan, Busan 609-757, Korea
Phone: +82-51-510-0624 E-mail: [email protected]
trihalomethanes (THMs) (Gallard and Gunten, 2002).
Drinking water quality regulations established in Canada (Guay et al., 2005) and by the U.S. EPA (Gibbons and Laha, 1999; Ge et al., 2007) have established standards for the treatment and disinfection of water. Humic substances in Korea were revealed in the 1.9 – 8.3 mg DOC/L concentration range, there are regulated as THMs on the chlorination process (Yoon et al., 2003).
The elimination of contaminants during drinking water treatment is mainly performed by coagulation with hydrolyzed metal species. The removal of humic substances by the use of coagulants, such as aluminum sulfate and ferric chloride, has been studied by Duan et al (2002) and Jung et al (2005).
Considerable attention has been focused on this
removal step because uncoagulated humic substances
lead to severe problems in the following treatment
stages (Owen et al., 1995). The treatment systems
must achieve adequate treatment and disinfection to
protect consumers from pathogens, and they must simultaneously reduce unwanted by-products produced by the disinfection process. Therefore, humic substances are removed from water by advanced techniques like activated carbon adsorption (Matilainen et al., 2006), coagulation/flotation (Zouboulis et al., 2003; Matilainen et al., 2002) and ultra/nanofiltration (Bian et al, 1999).
Dissolved air flotation (DAF) is generally used to remove the low-density flocs of algae, humic substances, clay, and metal hydroxides (Bourgeois et al., 2004). Because low-density flocs in drinking water treatment plants are produced by these raw waters, DAF should be more efficient than conventional sedimentation. This process takes place in the main parts of coagulation/flocculation and bubble generation/flotation, each with a different mechanism. Coagulation and flocculation are two of the most important steps. They are influenced by the characteristics of the raw water, temperature, pH, coagulant type and dose, rapid mixing intensity, and duration (Klute et al., 1995). Design and operational parameters for coagulation/flocculation and DAF were studied by Edzwald (1995). Some researchers studied rapid mixing (Amirtharajah and Mills, 1982;
Muyibi and Evison, 1995) and slow mixing (Colomer et al., 2005) with the objective of finding the optimal conditions of velocity gradient and mixing time.
The DAF processes are composed of the following four steps: coagulation and flocculation prior to flotation, bubble generation, bubble-floc collision and attachment in a mixing zone, and rising of bubble-floc agglomerates in a flotation tank. This study was investigated to examine coagulation and flotation conditions of HA using a laboratory-scale DAF system. The objectives of this research were (1) to determine mixing speed (velocity gradient) and duration, (2) to determine flotation conditions, such as saturator’s pressure and recycle ratio and flotation time, and (3) to compare the effects of different kinds
of coagulants and coagulant dosages.
2. Materials and methods
2.1. Materials
Humic acid, supplied by Aldrich Chemical Company (USA), was used in the coagulation, flocculation, and flotation experiments. Stock solutions of HAs were prepared by dissolution of 1 g of HA in 1 L of 0.1 M NaOH solution under gentle stirring until complete dissolution. Working solutions were prepared by dilution of the stock solution with deionized water to obtain final concentrations ranging from 10 to 300 mg/L. The stock solution of aluminum sulfate (Al
2(SO
4)
3·18H
2O, Merck) was prepared by dissolving the aluminum sulfate in deionized water to produce a solution with a concentration of 1.5 g/L. An aluminum salt coagulant, PSO-M (Al
2O
37%, Seojung Chemical, Korea), stock solution was prepared in a similar manner. PSO-M is widely used at the water treatment facility in the Busan area. The coagulant solutions were prepared from the stock solutions the day before they were to be used to avoid any aging phenomena and to improve reproducibility. Adjustments in pH were made with HCl or NaOH, as required. All the experiments were performed at ambient temperature, which ranged from 18 to 23
oC.
2.2. Analysis methods
The UV absorbance was measured with an
UV/VIS spectrophotometer (Perkin Elmer, Lamda
20S) at a single wavelength of 254 nm with a 1-path
length. Dissolved organic carbon (DOC) was
analyzed by a TOC analyzer (Shimadzu, 5000A). The
absorbance was measured on non-filtered samples. In
this study, a solution containing 40.0 mg HA/L was
found to contain about 18.2 mg DOC/L. It has been
reported that HA concentration, DOC concentration,
and UV absorbance have a strong linear relationship
(Zouboulis et al., 2004). This was confirmed in this
GR, s-1
0 400 800 1200
CHA removal efficiency, %
0 20 40 60 80 100
Initial CHA : 20.0 mg/L
a) rapid mixing speed, GR
tR, s
0 20 40 60 80 100 120
CHA removal efficiency, %
0 20 40 60 80 100
Initial CHA : 10.0 mg/L Initial CHA : 20.0 mg/L Initial CHA : 40.0 mg/L
b) rapid mixing time, tR
Fig. 1. The relationship between C
HA removal efficiencies and rapid mixing conditions : a) rapid mixing speed and b) rapid mixing time. Slow mixing and flotation conditions : GS, 60s-1; tS, 900 s; RF, 20 %; PF, 490 kPa; tF, 600 s.study, since the calibration curve between HA concentration (C
HA) and UV
254showed a correlation coefficient(r
2) of 0.9849. The value of pH was determined electrometrically using a pH electrode and a pH meter (Orion, EC-6000).
2.3. Coagulation and flotation procedures
The optimized coagulation, flocculation, and flotation conditions were determined by performing bench-scale DAF-jar tester (ECE engineering, DBT6). Coagulation and flocculation were performed in a standard 1-L acryl rectangular beaker (100 mm × 100 mm × 200 mm). Stirring was carried out with a 40 mm × 60 mm blade positioned at one-third the height of the reactor from the bottom. The coagulation and flocculation experiments involved coagulant (aluminum sulfate and PSO-M) addition with a rapid mix time from 0 to 120 s at mixing speeds from 200 to 340 rpm, velocity gradients (G) from 100 to 1000 s
-1, followed by flocculation time from 0 to 1200 s at mixing speed from 10 to 100 rpm, G values from 5.0 to 193.0 s
-1. Subsequently, the flocs were allowed to float for 30 to 1200 s, and the
recycle ratio was fixed at 20%. HA solutions were prepared with concentration from 10 to 50 mg/L.
After flotation, samples were collected, and the residual C
HAwas determined.
3. Results and discussion
3.1. Coagulation and flocculation conditions The effects of speed and time on C
HAremoval efficiencies for the rapid mixing case are shown in Fig. 1. Slow mix speed and time, coagulant dosage, and flotation condition were held constant at 60 s
-1and 900 s, 5 mg Al/L (as aluminum sulfate), and 600 s, respectively. In Fig. 1 (a), it can be seen that the C
HAremoval efficiency increased slowly as the rapid mixing speed. The C
HAremoval efficiency reached 63.2 % at G
Rvalues greater than 400 s
-1. C
HAremoval efficiencies for a constant G
Rvalue of 400 s
-1while rapid mixing times were varied are shown in Fig. 1 (b). Based on the results shown in Fig. 1 (a), the rapid mix speed was fixed at 400 s
-1, and solutions with C
HAvalues of 10, 20, and 40 mg/L were prepared.
The C
HAremoval efficiencies increased slowly with
GS, s-1
0 50 100 150 200
CHA removal efficiency, %
0 20 40 60 80 100
Initial CHA : 20.0 mg/L
a) slow mixing speed, GS
tS, s
0 500 1000 1500 2000
CHA removal efficiency, %
0 20 40 60 80 100
Initial CHA : 10.0 mg/L Initial CHA : 20.0 mg/L Initial CHA : 40.0 mg/L
b) slow mixing time, tS
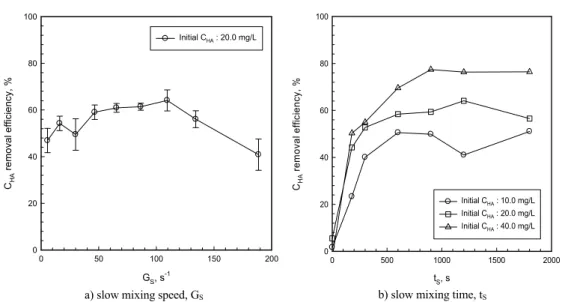
Fig. 2. The relationship between C
HA removal efficiencies and slow mixing conditions : a) slow mixing speed and b) slow mixing time. Rapid mixing and flotation conditions : GR, 400 s-1; tR, 60 s; RF, 20 %; PF, 490 kPa; tF, 600 s.increasing of rapid mixing time. The optimum value was achieved at a mixing time of 60s. Mhaisalkar et al. (1991) suggested some values for optimal time and intensity for rapid mix design. Rossini et al.
(1999) found that turbidity removal efficiency in a kaolin dispersion was a minimum at 200 s
-1of velocity gradient and 60 s of rapid mixing time.
Fig. 2 (a) and (b) show the optimizing speed and time of slow mixing on CHA removal efficiencies.
Rapid mixing speed and time were constant at 400 s
-1and 60 s, respectively. From Fig. 2 (a) it is observed that there exists optimum G
Svalues for slow mixing speed ranging from 60 to 110 s
-1at 20 mg/L initial C
HA, and slow mixing time was constant at 900 s. The C
HAremoval efficiencies reached about 60 % at optimum G
Svalue for slow mixing speed. C
HAremoval efficiencies decreased sharply with increasing of slow mixing speed up to 110 s
-1. The result shows that floc formation is hindered if the slow mixing speed is increased to 110 s
-1or more, due to the breakup of agglomerated flocs. The results are in agreement with the study of Muyibi and Evison (1995) who found that agglomerated flocs can be retained at optimum
velocity gradient. Fig. 2(b) shows the results obtained by varying slow mixing time. C
HAremoval efficiencies in varying initial C
HApresented a minimum value after 900 s of mixing time. With a shorter mixing time, less than 900 s, at initial C
HAof 40 mg/L, HA aren’t grown up floc size to float.
pH
0 2 4 6 8 10 12 14
CHA removal efficiency, %
0 20 40 60 80 100
Initial CHA : 20.0 mg/L
Fig. 3. C
HA removal efficiencies as a function of solution pH. Mixing and flotation conditions : GR, 400 s-1; tR, 60 s; GS, 60 s-1; tR, 900 s; RF, 20 %; PF, 490 kPa; tF, 600 s.Fig. 3 shows the results of runs with pH ranges from 3 to 10. It was observed that C
HAremoval efficiencies were up to 55.0 % at pH values between 7.0 and 8.0. When pH values were controlled at 6.0 and 9.0, the C
HAremoval efficiencies decreased below 50.0 %. Agglomerated flocs for dosing 5 ㎎ Al/L (as aluminum sulfate) were dispersed at low pH values, and it was observed that the residual C
HAincreased in the solution. In fact, the majority of colloidal particles are negatively charged, and a lower pH contributes to destabilization. Zouboulis et al (2003) reported that the zeta-potential values of humic acid solutions were found to increase by decreasing the pH, indicating the increase of humic acid protonation. Agglomerated flocs up to pH 9 increase a change of charge on the floc surface and an increase of solid amorphous aluminum hydroxide, but flotation efficiency was decreased by the increase of size and density of agglomerated flocs.
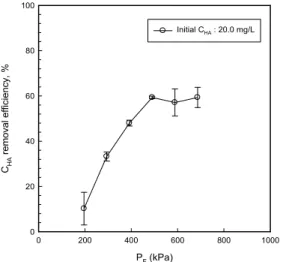
3.2. Flotation conditions
The quantity of bubbles could be varied by changing the saturator’s working pressure and the recycle ratio. Fig. 4 shows the effect of C
HAremoval
PF (kPa)
0 200 400 600 800 1000
CHA removal efficiency, %
0 20 40 60 80 100
Initial CHA : 20.0 mg/L
Fig. 4. C
HA removal efficiencies as a function of saturator pressure. Mixing and flotation conditions : GR, 400 s-1; tR, 60 s; GS, 60 s-1; tS, 900 s; RF, 20 %; TF, 600 s.efficiencies on the saturator’s working pressure. At 392 kPa, the C
HAremoval efficiencies decreased to 40.0 %. However, C
HAremoval efficiency at 490 kPa increased to 59.3 %. Burns et al (1997) and Rijk et al (1994) proposed that bubble size was decreased slightly as the working pressure in saturator increased and that the adhesion of bubbles and floc increased based on the size of the bubbles and the nature of the agglomerated flocs.
Agglomerated flocs are attached to released bubbles and float to the top of the flotation vessel. In this case, C
HAremoval efficiencies by removing the bubble-floc agglomerate are shown as a function of the flotation time. The overall flotation rate related to C
HAremoval efficiencies was generally represented by a pseudo first- and second-order model with lumped parameters, assuming the flotation zone was perfectly mixed. Equations (1) and (3) show the first- and second-order kinetic models for a perfect, mixed-batch flotation process that were derived in a kinetic model by Ek(Mavros, P., Matis, 1991).
∞ , (1)
where R (%) is the C
HAremoval efficiency at flotation time t(s), R
∞(%) is the ultimate C
HAremoval efficiency for an infinite flotation time, and k
1is the rate constant of the pseudo first-order model.
Integrating Equation (1) with respect to boundary conditions to at to , the kinetic rate expression becomes:
ln
∞
∞
(2)
The pseudo first-order rate constant
can be obtained from the slope of plot of
ln
∞∞
versus
t. A pseudo second-order kinetic model proposed by
Arbiter and Harris (1961) is written:
Initial CHA
(mg/L)
R (%)
k1
(1/min)
R
(%) r2 k2×10-3
(1/min)
R
(%) r2
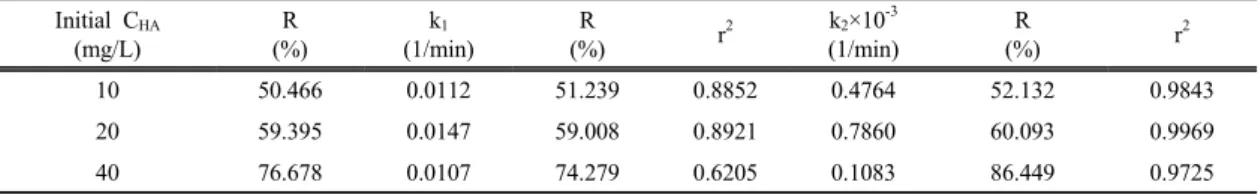
10 50.466 0.0112 51.239 0.8852 0.4764 52.132 0.9843
20 59.395 0.0147 59.008 0.8921 0.7860 60.093 0.9969
40 76.678 0.0107 74.279 0.6205 0.1083 86.449 0.9725
Table 1. Kinetic parameters in the flotation rate
Flotation time(tF), s
0 300 600 900 1200 1500
CHA removal efficiency, %
0 20 40 60 80 100
Initial CHA : 10.0 mg/L Initial CHA : 20.0 mg/L Initial CHA : 40.0 mg/L
a) Pseudo first-order kinetics
Flotation time(tF), s
0 300 600 900 1200 1500
CHA removal efficiency, %
0 20 40 60 80 100
Initial CHA : 10.0 mg/L Initial CHA : 20.0 mg/L Initial CHA : 40.0 mg/L
b) Pseudo second-order kinetics
Fig. 5. Model fitting by pseudo first and second kinetic models (C
HA removal efficiencies versus flotation time). Mixing and flotation conditions : GR : 400 s-1; TR, 60 s; GS, 60 s-1; tS, 900 s; RF, 20 %; PF, 490 kPa.
∞
(3)
Integrating Equation (3) with respect to the boundary conditions to at to
, Equation (3) becomes:
∞
∞ (4)
A plot of
versus gives the value of the constant
, and can also be calculated. Figs. 5 a) and b) show experimental data and the predicted pseudo first- and second-order kinetics using a non-linear method. The obtained pseudo first- and second-order rate constants (
and
) and the
predicted values are given in Table 1. The correlation coefficients, r
2, for the pseudo second-order kinetics were higher than the coefficients of the pseudo first-order kinetics. The values of r
2by pseudo first-order kinetics for 10, 20, and 40 mg/L of C
HAwere 0.8852, 0.8921, and 0.6205, respectively.
However, the values of r
2by a pseudo second-order
kinetics for 10, 20, and 40 mg/L of C
HAwere 0.9843,
0.9969 and 0.9725, respectively. The pseudo
second-order kinetics adequately described the
overall flotation rate with a high correlation
coefficient (r
2>0.97), and calculated values, , fit the
experimental data well. For initial C
HAvalues from
10 to 40 mg/L, the flotation time for the maximum
C
HAremoval efficiencies was required to be 600 s or
more.
3.3. Effect of initial C
HAand coagulant dosages Fig. 6 shows the effect of varying initial C
HAand coagulant (D
alum) dosages on C
HAremoval efficiencies. The effect of increasing initial C
HAwith coagulant dosage is associated with a sharp increase in the C
HAremoval efficiencies at the optimum dosage of coagulant. The required coagulant dosage at an initial C
HAof 10 mg/L was 3 mg/L as Al. The coagulant dosages required to achieve optimum C
HAremoval efficiencies were 4.0 mg/L as Al at initial C
HAof 20 mg/L and 5.0 and 6.0 mg/L as Al at initial C
HAof 30 and 40 mg/L, respectively. Coagulant dosages of 0.15 - 0.20 g Al/g HA were required. The finding that the removal of humic substances after coagulation and flocculation was dependent on optimum coagulant dosages was consistent with results presented by several researchers (O'Melia et al, 1999; Kam and Gregory, 2001). The coagulation of humic substances by hydrolyzing metal salts was described as co-precipitation, charge neutralization, and/or adsorption mechanisms, depending on the dosages of the coagulants dosage and the concentrations
DAlum (mg Al/L)
0 5 10 15
CHA removal efficiency, %
0 20 40 60 80 100
Initial CHA : 10.0 mg/L Initial CHA : 20.0 mg/L Initial CHA : 40.0 mg/L
Fig. 6. Coagulation, flocculation and flotation as function of
aluminum sulfate dosage. Mixing and flotation conditions : GR, 400 s-1; tR, 60 s; GS, 60 s-1; tS, 900 s;RF, 20 %; PF, 490 kPa.
of the humic substances (Duan et al., 2002). The coagulation reaction of humic acid at pH 6.4 corresponded to the positively-charged monomers or solid amorphous aluminum hydroxide. Here, the aluminum species hydrated represented negatively- charged carboxyl groups or the phenolic OH groups of humic acid.
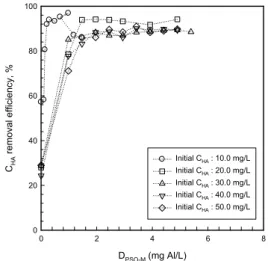
Fig. 7 shows C
HAremoval efficiencies as a function of PSO-M dosage (D
PSO-M) at pH 6.8. These results showed increasing C
HAremoval efficiencies with increasing coagulant dosage, and this observation could be explained ineffectiveness similar to Fig. 6. C
HAremoval efficiencies of up to 85
% were recorded for effluents with initial C
HAfrom 10 to 50 mg/L. The coagulant dosages in initial C
HAfrom 10 to 50 mg/L required more than 1.2 mg/L as Al (0.03-0.12 g Al/g HA), to achieve optimum C
HAremoval efficiencies. These results showed that PSO-M with a higher polymeric content of Al species has the advantage of higher coagulation/flocculation per formance than aluminum sulfate, which has a lower content of polymeric Al species. Therefore, when
DPSO-M (mg Al/L)
0 2 4 6 8
CHA removal efficiency, %
0 20 40 60 80 100
Initial CHA : 10.0 mg/L Initial CHA : 20.0 mg/L Initial CHA : 30.0 mg/L Initial CHA : 40.0 mg/L Initial CHA : 50.0 mg/L