Copyright © 2015 Korean Stroke Society
This is an Open Access article distributed under the terms of the Creative Commons Attribution Non-Commercial License (http://creativecommons.org/licenses/by-nc/3.0/) which permits unrestricted non-commercial use, distribution, and reproduction in any medium, provided the original work is properly cited.
Case Characteristics, Hyperacute Treatment, and
Outcome Information from the Clinical Research Center for Stroke-Fifth Division Registry in South Korea
Beom Joon Kim,
aJong-Moo Park,
bKyusik Kang,
cSoo Joo Lee,
cYoungchai Ko,
cJae Guk Kim,
cJae-Kwan Cha,
dDae-Hyun Kim,
dHyun-Wook Nah,
dMoon-Ku Han,
aTai Hwan Park,
eSang-Soon Park,
eKyung Bok Lee,
fJun Lee,
gKeun-Sik Hong,
hYong-Jin Cho,
hByung-Chul Lee,
iKyung-Ho Yu,
iMi-Sun Oh,
iDong-Eog Kim,
jWi-Sun Ryu,
jKi-Hyun Cho,
kJoon-Tae Kim,
kJay Chol Choi,
lWook-Joo Kim,
mDong-Ick Shin,
nMin-Ju Yeo,
nSung Il Sohn,
oJeong-Ho Hong,
oJuneyoung Lee,
pJi Sung Lee,
qByung-Woo Yoon,
rHee-Joon Bae
aaDepartment of Neurology, Seoul National University Bundang Hospital, Seongnam, Korea
bDepartment of Neurology, Eulji General Hospital, Eulji University, Seoul, Korea
cDepartment of Neurology, Eulji University Hospital, Daejeon, Korea
dDepartment of Neurology, Dong-A University Hospital, Busan, Korea
eDepartment of Neurology, Seoul Medical Center, Seoul, Korea
fDepartment of Neurology, Soonchunhyang University Hospital Seoul, Seoul, Korea
gDepartment of Neurology, Yeungnam University Medical Center, Daegu, Korea
hDepartment of Neurology, Inje University Ilsan Paik Hospital, Goyang, Korea
iDepartment of Neurology, Hallym University Sacred Heart Hospital, Anyang, Korea
jDepartment of Neurology, Dongguk University Ilsan Hospital, Goyang, Korea
kDepartment of Neurology, Chonnam National University Hospital, Gwangju, Korea
lDepartment of Neurology, Jeju National University Hospital, Jeju, Korea
mDepartment of Neurology, Ulsan University Hospital, Ulsan, Korea
nDepartment of Neurology, Chungbuk National University Hospital, Cheongju, Korea
oDepartment of Neurology, Keimyung University Dongsan Medical Center, Daegu, Korea
pDepartment of Biostatistics, Korea University, Seoul, Korea
qClinical Research Center, Asan Medical Center, Seoul, Korea
rDepartment of Neurology, Seoul National University Hospital, Seoul, Korea
Correspondence: Hee-Joon Bae Room #8711, Bldg #2, Department of Neurology, Seoul National University Bundang Hospital, 82 Gumi-ro 173 beon-gil, Bundang-gu, Seongnam 463-707, Korea
Tel: +82-31-787-7464 Fax: +82-31-787-4563 E-mail: [email protected] Received: September 22, 2014 Revised: November 21, 2014 Accepted: November 25, 2014 This study was supported from the Korea Healthcare Technology R&D Project, Ministry of Health, Republic of Korea (HI10C2020).
The authors have no financial conflicts of interest.
Characteristics of stroke cases, acute stroke care, and outcomes after stroke differ according to geographical and cultural background. To provide epidemiological and clinical data on stroke care in South Korea, we analyzed a prospective multicenter clinical stroke registry, the Clinical Research Center for Stroke-Fifth Division (CRCS-5). Patients were 58% male with a mean age of 67.2± 12.9 years and median National Institutes of Health Stroke Scale score of 3 [1-8] points. Over the 6 years of operation, temporal trends were documented in- cluding increasing utilization of recanalization treatment with shorter onset-to-arrival de- lay and decremental length of stay. Acute recanalization treatment was performed in 12.7%
of cases with endovascular treatment utilized in 36%, but the proportion of endovascular recanalization varied across centers. Door-to-IV alteplase delay had a median of 45 [33-68]
min. The rate of symptomatic hemorrhagic transformation (HT) was 7%, and that of any HT was 27% among recanalization-treated cases. Early neurological deterioration occurred in 15% of cases and were associated with longer length of stay and poorer 3-month out- comes. The proportion of mRS scores of 0-1 was 42% on discharge, 50% at 3 months, and
Review
Introduction
In general, the term clinical registry refers to a observational da- tabase of patients’ characteristics, treatments, and outcomes without specified inclusion or exclusion criteria and therapeutic approaches unrelated to purposes of the registry.
1Well-designed, organized and performed clinical registry may provide relevant data from real world experience and patients’ characteristics as well as outcomes and safety of cases. Purposes of clinical regis- tries may be summarized as describing natural history of disease, determining effectiveness, measuring or monitoring safety and harm, and measuring quality.
2Recently, clinical registries started to adapt data elements for care quality and patients’ safety, and thus these data may be utilized in activities for quality of care monitoring and quality improvement. Such qualities of clinical registries make it valuable source of clinical researches because case characteristics in large clinical trials are only partially repre- sentative of patients’ in clinical practice.
3However, to incorpo- rate clinical registries into research purposes, ensuring high-qual- ity of stored data is of paramount importance, including meticu- lous documentation of data elements and capture processes, completeness of individual cases and data, regular monitoring and auditing processes including prespecified query algorithm, update and correction of erroneous entries after public distribu- tion of dataset. Likewise, linking clinical registry database to sec- ondary data sources such as governmental statistics and health insurance reimbursement database provides broader ranges of epidemiological data and current status of under-represented subgroups.
4In this context, the authors summarize the structure and orga- nization of the Clinical Research Center for Stroke-fifth division (CRCS-5) registry, which is a prospective, multicenter, quality- improvement, clinical stroke registry in South Korea.
Brief history and overview of the CRCS-5 registry
Organization of CRCS-5 registry
The Clinical Research Center for Stroke (CRCS; director, Dr.
Byung-Woo Yoon, Seoul National University Hospital), support-
ed by the Korea Healthcare Technology R&D Project, Ministry of Health, Republic of Korea (HI10C2020), was established in 2006 to facilitate multi-center collaborative clinical research and to develop a series of clinical practice guidelines based on data from the Korean population. Six divisions comprise the CRCS and the fifth division, CRCS-5 (principal investigator, Dr. Hee- Joon Bae, Seoul National University Bundang Hospital), is desig- nated to develop clinical guidelines for secondary prevention of stroke through clinical epidemiological research.
To this end, CRCS-5 tried to establish a prospective, multi- center clinical registry for stroke cases from the start of CRCS.
Before the commencement of CRCS, the Korean Stroke Regis- try (KSR; director, Dr. Jae-Kyu Roh, Professor Emeritus at Seoul National University Hospital) was operated through a web-based database to which more than 30 hospitals submitted acute stroke cases.
5The CRCS decided to continue with the baseline struc- ture of database tables from the KSR. CRCS-5 also maintained the overall KSR database structure and added a few tables and fields for its own purposes. To ensure standardization of registra- tion process, CRCS-5 workbook for data collection and variable definitions was established and disseminated throughout the participating center. The CRCS-5 steering committee also regu- larly held a database workshop to help investigators and registrars being accustomed to the database structure and data entry sys- tem at least once a year. Participating researchers in the CRCS-5 registry tried to integrate the registration, auditing, and reporting of the clinical registry into daily clinical practice, and thus estab- lished “quality of stroke care monitoring and improvement” as a primary objective of the registry.
Expansion of the CRCS-5 registry
The CRCS-5 registry was initiated in April 2008 with nine hos- pitals. In April 2008, participating centers were mostly located in the Seoul metropolitan area, with one from the central area and one from the southeastern area of South Korea. Such geographi- cal preponderance was slowly alleviated with the participation of Chonnam National University (located in the southwestern part of South Korea) and Dongguk University Ilsan Hospital in Janu- ary 2011. Jeju National University Hospital joined the CRCS-5 registry in October 2011, and in February 2013, two hospitals 55% at 1 year after the index stroke. Recurrent stroke up to 1 year occurred in 4.5% of pa-
tients; the rate was higher among older individuals and those with neurologically severe deficits. The above findings will be compared with other Asian and US registry data in this article.
Keywords Stroke registry; South Korea; Case profile; Hyperacute treatment; Thrombolysis;
Outcome; Recurrent event
joined the CRCS-5 registry—Chungbuk National University Hospital and Ulsan University Hospital. Keimyung University Dongsan Medical Cetner, located in Daegu, began enrolling acute stroke cases in the CRCS-5 registry in May 2014. As of Septem- ber 2014, 15 hospitals, covering most areas of South Korea, are actively registering stroke cases in the CRCS-5 registry (Figure 1).
The database tables of the CRCS-5 registry have expanded since its initiation. The initial KSR database included demograph- ic information locations and parenchymal lesions, arterial occlu- sion, stroke mechanism, National Institute of Health Stroke Scale (NIHSS) score at arrival, laboratory values, and treatment infor-
mation. The CRCS-5 registry maintained the structure of the
KSR database as “initial and extended tables” with some minor
modifications. In October 2008, a clinical practice-monitoring
database table was introduced for quality improvement of stroke
care. In November 2009, the CRCS-5 registry set up a new data-
base table dedicated to hyperacute treatment and acute manage-
ment information. The CRCS-5 registry steering committee has
long been in need of prospective stroke outcomes, and thus it im-
plemented a systematic capture strategy for prospective outcomes,
including functional status and vascular events in November 2009,
selecting five centers with sufficient resources (Eulji General Hos-
Figure 1. CRCS-5 centers and their locations.pital, Seoul National University Bundang Hospital, Seoul Medical Center, Soonchunhyang University Hospital Seoul, and Inje Uni- versity Ilsan Paik Hospital). With a piloting operation duration of 14 months, the prospective outcome capture strategy was expand- ed to all participating CRCS-5 registry centers in January 2011.
Prospective outcome information included functional and event outcomes at 3 months and 1 year after stroke onset as well as early neurological deterioration (END; details will be discussed later).
Further, temporary database tables were set up for any specific re- search purposes (Figure 2).
The structure of the CRCS-5 registry and the epidemiological profile of 14,792 stroke cases enrolled up to January 2012 have been discussed previously.
6In the current article, the case profile is up-to-date as of August 2014, and details on hyperacute treat- ment and outcome information after the index stroke will be discussed.
Data management and analysis of CRCS-5 registry
Acute stroke cases were registered to the CRCS-5 web-based database (http://www.stroke-crc.or.kr/ecrf), and the registration process was required to be started within 48 hours of arrival. The
central data manager monitors the number of registered cases from each hospital biweekly, and when the number deviates from the usual level, an inquiry is made to the check for any bias or missing data. The data manager also checks the integrity and completeness of the database bimonthly. Pre-specified queries are used, and peripheral registrars revise erroneous entries upon inquiries. The CRCS-5 registry steering committee has monthly gatherings to review and supervise the process. Details have pre- viously been presented as supplemental data.
6The overall pro- cess of case registration, monitoring, inquiry and correction of er- roneous data, and outcome capture usually takes 6-7 months to be completed, and then, the up-to-date CRCS-5 database is opened to participating researchers.
As of August 2014, the most recent available data are for cases from April 2008 to November 2013. The figures in the current ar- ticle are derived from this database. Two-tailed significance values were set as P<0.05. Values are presented as frequencies (percent- ages), means±standard deviations, or medians [interquartile ranges], as appropriate. Statistical analyses were performed using STATA/MP 13.1 for Mac (STATACorp, College Station, TX, USA).
Figure 2. Timeline of the CRCS-5 registry. DB, database. QI, quality indicator.
Timeline of CRCS-5 registry
Overview of included cases
Baseline characteristics
The most recent database of the CRCS-5 registry as of Au- gust 2014 contained stroke cases admitted between April 2008 and November 2013. During these 5.5 years, a total of 28,348 cases were enrolled in the registry, and 27,851 ischemic stroke or transient ischemic attack (TIA) cases were available to be analyzed. In Korea, hemorrhagic stroke cases are usually man- aged by neurosurgeons, and thus the 497 hemorrhagic stroke cases included in the CRCS-5 registry are not representative of Korean cases. Accordingly, they were removed for the present analyses.
The profile of the analyzable cases is presented in Table 1.
The demographic information and profile of vascular risk fac- tors were relatively comparable to previous reports, in spite of a longer inclusion period and more participating centers.
6The overall profile was similar to that from the report of 34,000 cas- es from the Japan Standard Stroke Registry Study (JSSRS).
7Regarding stroke mechanisms, the CRCS-5 registry showed a higher proportion of cardioembolism than that observed in Taiwan,
8and also a higher proportion of undetermined etiolo- gies in comparison to the JSSRS.
7The discordant rates of stroke mechanisms may originate from differences in work-up intensi- ty and requirements for etiologic evaluation. Onset (defined as last seen normal) to arrival delay was median 12.7 hours in the CRCS-5 registry as of August 2014, a decrease from 14.2 hours observed in the previous report.
6Median NIHSS score de- creased by 1 point to 3 points in the current analysis.
Among the 27,851 cases, 13% received hyperacute recanaliza- tion treatment, higher than that observed in the US, Taiwan,
8,9and the South Korean general population.
10However, our data should be interpreted with caution, given that the participating centers in the CRCS-5 registry mainly consist of tertiary academ- ic hospitals, meaning that the figure is likely not representative of the primary care environment. The median delay between stroke onset and the initiation of recanalization treatment was 2.3 hours.
On discharge, the proportion of cases with a modified Rankin Scale (mRS) score of 0-1 was 41%, similar to the number from JSSRS.
7The median duration of hospitalization was 7.4 days, and 68% of cases were discharged to their home. Discharge disposi- tion is dependent on cultural background. Specifically, the pro- portion observed here was lower than data from Taiwan (89%), but much higher than the US (46%) and France (47%).
11,12In- hospital mortality was 2.8%.
Temporal trends
Over the 6 years, a few interesting trends were noted in the
Table 1. Profile of ischemic stroke or transient ischemic attack cases regis- tered to CRCS-5 between April 2008 and November 2013 (N= 27,851)
Variables Values Remarks
Demographic information
Males 16,149 (58.0%)
Age 67.2± 12.9
Vascular risk factors
History of stroke 5,894 (21.2%)
Hypertension 18,565 (66.7%)
Diabetes 8,966 (32.2%)
Dyslipidemia 8,493 (30.5%)
Habitual smoking 10,829 (38.9%) Atrial fibrillation 5,211 (18.7%) Pre-stroke anti platelet use 8,145 (29.2%) Pre-stroke anticoagulant use 1,195 (4.3%) Stroke information
OTA delay 12.7 [3.4-41.0]
OTA ≤ 3 hours 8,345 (30.0%) OTA ≤ 24 hours 18,108 (65.0%) NIHSS score at arrival 3 [1-8]
NIHSS score ≤ 4 point 16,820 (60.4%) NIHSS score ≥ 10 point 5,674 (20.4%) Pre-stroke mRS score ≥ 1 5,390 (19.4%)
TOAST classification Missing in 2,139 (7.7%) cases Large artery atherosclerosis 9,674 (37.6%)
Small vessel occlusion 4,805 (18.7%) Cardioembolism 5,494 (21.4%) Other determined etiologies 623 (2.4%) Undetermined etiologies 5,116 (19.9%) Two or more etiologies 1,082 (4.2%) Negative etiology 2,039 (7.9%) Incomplete work-ups 1,995 (7.8%) Recanalization treatment 3,517 (12.7%) IV thrombolysis 2,248 (63.9%) Endovascular-only recanalization 544 (15.5%) Combined IV-endovascular
recanalization 725 (20.6%)
Onset-to-treatment delay (hours) 2.3 [1.6-3.7] Missing in 37 (1.1%) cases Interventional treatment
Decompressive craniectomy 113 (1.9%) Bypass surgery 17 (0.3%) Endarterectomy 70 (1.2%) Angioplasty 441 (7.0%) Outcomes at discharge
mRS 0-1 at discharge 11,495 (41.4%) Missing in 81 cases In-hospital mortality 786 (2.8%) Missing in 81 cases Discharge disposition
Home 18,519 (67.5%) Missing in 412 (1.5%) cases Other facilities 4,262 (15.5%)
Rehabilitation services 3,872 (14.1%)
Deceased 786 (2.9%)
Duration of hospitalization 7.4 [5.1-11.7]
Values are presented as frequency (percentage), mean ± standard deviation, or medi- an [interquartile range], as appropriate. Onset was defined as last seen normal. Per- centages in the subcategories of undetermined etiologies are based on the total num- ber of TOAST-available cases. Percentages in the detailed methods of recanalization are based on the cases with recanalization treatment. Interventional treatment was counted when performed during admission due to the index stroke. OTA, onset to ar- rival; NIHSS, National Institute of Health Stroke Scale; mRS, modified Rankin Scale.
CRCS-5 registry. The proportion of acute recanalization treat- ment of any sort increased from 8.8% in 2008 to 14.8% in 2013 (P-for-trend over the 6 years <0.01; Figure 3A). Increasing utili- zation of acute treatment was also detected in the US,
13but the dramatic increase by 6% over 6 years observed here was excep- tional. During the 6 years, the proportion of endovascular recan- alization treatment with or without preceding IV alteplase re- mained unchanged at around 30%-37% (P-for-trend, 0.13).
Even after the introduction of the Solitaire neurothrombectomy stent device (ev3 Inc., Plymouth, MN, USA) to South Korea in 2011, the proportion did not change. Such improvement in the utilization of alteplase would result from earlier arrival of acute stroke cases. The proportion of stroke cases who arrived within 3 hours of onset was 27% in 2008 (median onset-to-arrival delay of the whole population, 14.8 hours) but elevated to 32% in 2013
(median 11.9 hours; P-for-trend of arrival within 3 hours from on- set <0.01; Figure 3B). However, the vascular risk factors showed relatively consistent profiles over the 6 years (Figure 3C), con- trasting the increased prevalence and attributable risk from obesity and hypertension observed in the US over the last 10 years.
13,14One interesting finding was that the length of hospital stay has been consistently decreasing in CRCS-5 registry cases (Figure 3D). The duration of hospitalization is usually considered a major source of healthcare costs for stroke patients, and it can be inferred from the trends that economical pressure for cost reduction is growing in the stroke care system in South Korea.
15-17Hospital variability
The demographic and vascular risk factor profiles of admitted stroke cases to 14 participating centers were relatively compara-
100 90 80 70 60 50 40 30 20 10 0
16 14 12 10 8 6 4 2
Relative percentages of recanalization methods 0 Percentages of recanalization treatments
%
%
2008 (Apr-) 2009 2010 2011 2012 2013 (-Nov)
231 (8.8%) 349 (9.4%) 404 (10.6%) 736 (13.5%) 870 (14.5%) 927 (14.8%) Recanalization
cases
Combined IV-endovascular recanalization Endovascular-only thrombolysis
IV thrombolysis
Recanlization treatment (%) Oneset-to-arrival delay≤ 3 hours Median onset-to-arrival delay (hour)
33 32 31 30 29 28 27 26 25 24
16 14 12 10 8 6 4 2
Pertenages of OTA delay ≤3 hours 0 Median OTA delay
%
2008 (Apr-) 2009 2010 2011 2012 2013 (-Nov)
27 28 28
31 30
32
A B
Hypertension Diabetes Dyslipidemia Habitual smoking Atrial fibrillation
80 70 60 50 40 30 20 10 0
%
2008 (Apr -) 2009 2010 2011 2012 2013 (-Nov)
65 67 67 69 67 65 31 32 33 33 32 32 21 21 39 39 32 27 37 38 40 39 38 39 16 17 18 20 20 18
16 14 12 10 8 6 4 2 0
%
2008 (Apr -) 2009 2010 2011 2012 2013 (-Nov)
C D
Figure 3. Temporal trends of selected variables over 5.5 years of the CRCS-5 registry. Temporal trends of recanalization treatments in the CRCS-5 registry over the 6 years (A). The relative proportions of IV thrombolysis (purple bar), endovascular-only recanalization (orange bar) and combined IV-endovascular recanalization (green bar) remained stable during the inclusion period (bar graph). However, the proportion of recanalization-treated cases consistently increased in the registry from 8.8%
(231 cases) in 2008 to 14.8% (927 cases) in 2013 (line graph). Temporal trends of onset (last seen normal) to arrival delay over the 6 years in the CRCS-5 registry (B).
The proportions of early arrivals within 3 hours of onset steadily increased (bar graph) and the median onset to arrival delay were lowered from 14.8 hours in 2008 to 11.9 hours in 2013 for the entire population of CRCS-5 registry. Temporal trends of vascular risk factors in CRCS-5 registry (C). Overall, the percentages of risk factors did not demonstrate noticeable changes over the recruitment period. Temporal trends of median hospitalization duration over the 6 years, decreasing from 8.4 [5.5- 14.4] days in 2008 to 6.7 [4.5-10.7] days in 2013 (D). The upper and lower error bars represent the 75th and 25th percentiles, respectively. OTA, onset-to-arrival.
ble, but the acute stroke treatment showed noticeable variability across hospitals (Table 2). Among the differences, arrival-to-IV alteplase injection time and the utilization of endovascular re- canalization treatment were most discordant across centers.
Median in-hospital delay ranged from 29 minutes (hospital
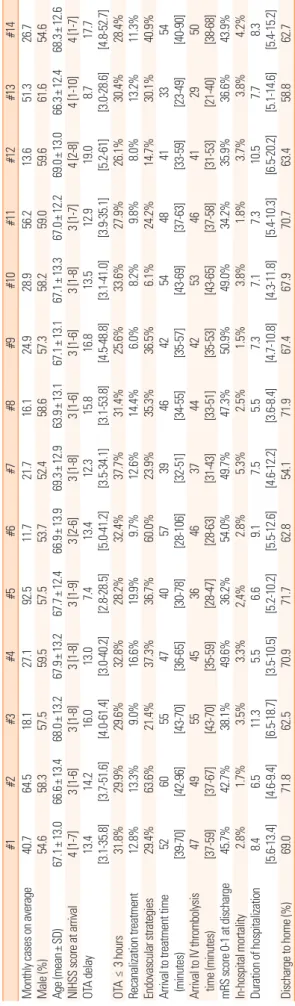
Table 2. Profiles of stroke cases, treatment, and outcomes according to CRCS-5 center (anonymized) #1#2#3#4#5#6#7#8#9#10#11#12#13#14 Monthly cases on average40.764.518.127.192.511.721.716.124.928.956.213.651.326.7 Male (%)54.658.357.559.557.553.752.458.657.358.259.059.661.654.6 Age (mean±SD)67.1±13.066.6±13.468.0±13.267.9±13.267.7±12.466.9±13.969.3±12.963.9±13.167.1±13.167.1±13.367.0±12.269.0±13.066.3±12.468.3±12.6 NIHSS score at arrival4 [1-7]3 [1-6]3 [1-8]3 [1-8]3 [1-9]3 [2-6]3 [1-8]3 [1-6]3 [1-6]3 [1-8]3 [1-7]4 [2-8]4 [1-10]4 [1-7] OTA delay13.4 [3.1-35.8]14.2 [3.7-51.6]16.0 [4.0-61.4]13.0 [3.0-40.2]7.4 [2.8-28.5]13.4 [5.0-41.2]12.3 [3.5-34.1]15.8 [3.1-53.8]16.8 [4.5-48.8]13.5 [3.1-41.0]12.9 [3.9-35.1]
19.0 [5.2-61]
8.7 [3.0-28.6]17.7 [4.8-52.7] OTA ≤ 3 hours31.8%29.9%29.6%32.8%28.2%32.4%37.7%31.4%25.6%33.6%27.9%26.1%30.4%28.4% Recanalization treatment12.8%13.3%9.0%16.6%19.9%9.7%12.6%14.4%6.0%8.2%9.8%8.0%13.2%11.3% Endovascular strategies29.4%63.6%21.4%37.3%36.7%60.0%23.9%35.3%36.5%6.1%24.2%14.7%30.1%40.9%
Arrival to treatment time (minutes)
52 [39-70]60 [42-96]55 [43-70]47 [36-65]40 [30-78]57 [28-106]39 [32-51]46 [34-55]42 [35-57]54 [43-69]48 [37-63]41 [33-59]33 [23-49]54 [40-90]
Arrival to IV thrombolysis time (minutes)
47 [37-59]49 [37-67]55 [43-70]45 [35-59]36 [28-47]46 [28-63]37 [31-43]44 [33-51]42 [35-53]53 [43-65]46 [37-58]41 [31-53]29 [21-40]50 [38-68] mRS score 0-1 at discharge45.7%42.7%38.1%49.6%36.2%54.0%49.7%47.3%50.9%49.0%34.2%35.9%36.6%43.9% In-hospital mortality2.8%1.7%3.5%3.3%2,4%2.8%5.3%2.5%1.5%3.8%1.8%3.7%3.8%4.2% Duration of hospitalization8.4 [5.6-13.4]6.5 [4.6-9.4]11.3 [6.5-18.7]5.5 [3.5-10.5]6.6 [5.2-10.2]9.1 [5.5-12.6]7.5 [4.6-12.2]5.5 [3.6-8.4]7.3 [4.7-10.8]7.1 [4.3-11.8]7.3 [5.4-10.3]10.5 [6.5-20.2]7.7 [5.1-14.6]8.3 [5.4-15.2] Discharge to home (%)69.071.862.570.971.762.854.171.967.467.970.763.458.862.7 Values are presented as frequency (percentage), mean ± standard deviation, or median [interquartile range], as appropriate. OTA, onset to arrival; NIHSS, National Institute of Health Stroke Scale; mRS, modified Rankin Scale.
Table 3. Characteristics of hyperacute recanalization treatment cases (N=2,724)
Variable Value Remarks
Male (%) 1,601 (58.8)
Age 68.0± 12.7
Hypertension 1,771 (65.0%)
Diabetes 708 (26.0%)
Dyslipidemia 734 (27.0%)
Habitual smoking 1,051 (38.6%)
Atrial fibrillation 1,072 (39.4%)
Pre-stroke antiplatelet use 779 (28.6%) Pre-stroke anticoagulant use 167 (6.1%)
OTA delay (hours) 1.8 [0.9-3.5]
OTA ≤ 3 hours 2,138 (78.5%)
OTA ≥ 4.5 hours 475 (17.4%)
NIHSS score at arrival 11 [6-16]
NIHSS score ≤ 4 points 448 (16.5%) Pre-stroke mRS score ≥ 1 448 (16.5%) TOAST classification
Large artery atherosclerosis 769 (28.8%) Small vessel occlusion 129 (4.8%)
Cardioembolism 1,114 (41.7%)
Other determined etiologies 48 (1.8%) Undetermined etiologies 610 (22.8%)
Stroke unit admission 1,740 (64.0%)
Recanalization treatment
IV thrombolysis 1,698 (62.3%)
Endovascular-only recanalization 422 (15.5%) Combined IV-endovascular recanalization 604 (22.2%) Door-to-treatment delay (minutes)
Door-to-IV alteplase delay (minutes) 45 [33-68]
Door-to-endovascular delay (minutes) 108 [83-139]
Endovascular procedure duration (minutes) 75 [45-115]
NIHSS score at 24 hours after treatment 8 [3-15] Missing in 144 cases
Change over 24 hours -1 [-5-0]
NIHSS score decrease ≥ 4 559 (21.7%) NIHSS score increase ≥ 4 269 (10.4%) Hemorrhagic transformation
Any hemorrhagic transformations 684 (26.8%) Missing in 168 cases Symptomatic hemorrhagic transformations 192 (7.0%)
Outcomes after treatment
In-hospital mortality 188 (6.9%)
mRS score 0-1 at 3 months 842 (32.5%) Missing in 129 cases Mortality at 3 months 357 (13.8%) Missing in 129 cases Values are presented as frequency (percentage), mean± standard deviation, or me- dian [interquartile range], as appropriate.
Door-to-IV alteplase delay was based on IV thrombolysis or combined IV and endo- vascular treatments.
Door-to-endovascular delay was based on endovascular treatments with or without preceding IV alteplase.
OTA, onset to arrival; NIHSS, National Institute of Health Stroke Scale; mRS, modi- fied Rankin Scale.
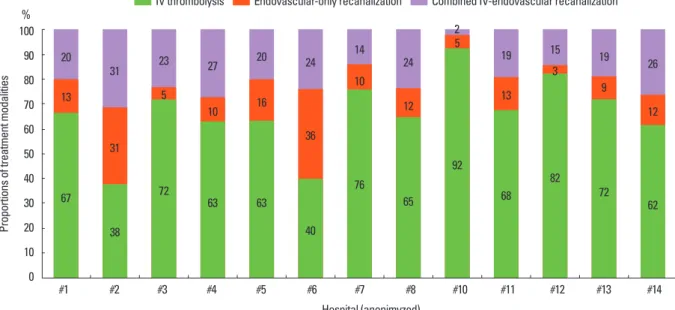
#13) to 55 minutes (hospital #3), and the proportion of endo- vascular treatment was between 6% (hospital #10) and 64%
(hospital #2). Still, real-world evaluation based on the Korean population is not available to determine whether such center disparity affects outcomes and quality of stroke care. Thus, this issue warrants further investigation.
Hyperacute recanalization treatment
Overview of recanalization treatment in the CRCS-5 registry
In November 2009, a separate database table was established in the CRCS-5 registry dedicated to acute stroke and recanali- zation treatment information, collecting NIHSS scores 24 hours after recanalization treatment, occlusion and recanaliza- tion status of cerebral artery, hemorrhagic transformation, utili- zation of stroke unit, and detailed information on hyperacute recanalization treatment modalities. In this section of the article, a total of 2,724 stroke cases receiving hyperacute recanalization
treatment across 13 hospitals will be analyzed (Table 3).
The demographic and vascular risk factor profiles of the 2724 cases were relatively similar to those of the overall CRCS-5 reg- istered stroke cases. Despite similar age, the prevalence of atrial fibrillation was higher among the treated cases and thus NIHSS score at arrival was elevated and more cases were designated as having cardioembolic stroke. The median arrival-to-IV alteplase injection delay was 45 minutes, which was lower than that from the Get With The Guidelines registry data.
13Median procedure time of endovascular treatment was 75 minutes, and 17% of cases were treated beyond the 4.5-hours time window for IV al- teplase, 37% (176 cases) of which only had IV alteplase injec- tion without endovascular treatment. Considering recent ad- vances in IV alteplase treatment that note the possibility of ex- tending the IV time window beyond 4.5 hours,
18,19such off-la- bel use of alteplase requires further investigation.
Symptomatic hemorrhagic transformation, associated with NIHSS score increment ≥4 points, occurred in 7% of the treat- ed cases, and any hemorrhagic transformation (including as-
Table 4. Baseline comparison of treatment modalities for hyperacute recanalizationVariable IV thrombolysis Endovascular-only recanalization Combined IV-endovascular recanalization Remarks
Number 1,698 422 604
Male (%) 1,009 (59.4) 248 (58.8) 344 (57.0)
Age 67.8± 13.0 68.1± 12.4 68.4± 12.0
Hypertension 1,099 (64.7%) 275 (65.2%) 397 (65.7%)
Diabetes 438 (25.8%) 125 (29.6%) 145 (24.0%)
dyslipidemia 494 (29.1%) 89 (21.1%) 151 (25.0%)
Habitual smoking 676 (39.8%) 154 (36.5%) 221 (36.6%)
Atrial fibrillation 592 (34.9%) 174 (41.2%) 306 (50.7%)
OTA delay (hours) 1.6 [0.9-2.8] 5.2 [2.8-10.3] 1.5 [0.7-2.5]
OTA ≥ 4.5 176 (10.4%) 243 (57.6%) 56 (9.3%)
NIHSS score at arrival 9 [5-14] 14 [8-18] 15 [11-19]
NIHSS score ≤ 4 points 344 (20.3%) 72 (17.1%) 32 (5.3%)
NIHSS score ≥ 10 points 778 (45.8%) 285 (67.5%) 483 (80.0%)
Pre-stroke mRS score ≥ 1 293 (17.3%) 73 (17.3%) 82 (13.6%)
Door-to-treatment delay (minutes)
Door-to-IV time 40 [31-54] - 40 [30-51]
Door-to-endovascular delay - 106 [80-141] 110 [87-138]
Endovascular procedure duration - 75 [50-118] 72 [42-114]
Dose of IV-alteplase 0.6 mg/kg 324 (19.4%) - 328 (55.1%)
NIHSS score at 24 hours after treatment 6 [3-13] 11 [5-18] 11 [5-17] Missing in 144 cases
Change over 24 hours -1 [-4-0] -1 [-5-1] -2 [-7-0]
NIHSS score decrease ≥ 4 301 (18.6%) 79 (21.1%) 179 (30.3%)
NIHSS score increase ≥ 4 154 (9.5%) 55 (14.7%) 60 (10.2%)
Hemorrhagic transformation
Any hemorrhagic transformations 340 (21.3%) 135 (36.4%) 209 (35.4%) Missing in 168 cases
Symptomatic hemorrhagic transformations 95 (5.6%) 45 (10.7%) 52 (8.6%)
Outcomes after treatment
In-hospital mortality 102 (6.0%) 34 (8.1%) 52 (8.6%)
mRS score 0-1 at 3 months 599 (36.9%) 91 (23.3%) 152 (26.1%) Missing in 129 cases
Mortality at 3 months 212 (13.1%) 66 (16.9%) 79 (13.6%) Missing in 129 cases
Values are presented as frequency (percentage), mean ± standard deviation, or median [interquartile range], as appropriate.
OTA, onset to arrival; NIHSS, National Institute of Health Stroke Scale; mRS, modified Rankin Scale.
ymptomatic ones) was detected in 27% of the cases. In-hospital mortality was 7%, and at 3 months after stroke, mRS scores of 0-1 were observed in 33%, and mortality was 14%. The preva- lence of hemorrhagic transformation was higher in the CRCS-5 registry than it was in the data from Taiwan,
20which may be due to the treatment beyond the conventional time window and the high utilization of endovascular recanalization treatment.
Treatment modalities for hyperacute recanalization
Endovascular recanalization treatment became widely avail- able in clinical practice due to its intuitive outcomes and its func- tion as a rescue treatment.
21Two separate phase II clinical trials in 2,012 reported superior efficacy of newer thrombectomy stent devices, and thus supported wider acceptance of endovas- cular modalities.
22-24Among the 2,724 recanalization-treated cases in the CRCS-5 registry, endovascular treatment with or without preceding IV alteplase was utilized in 38% of cases (Ta- ble 4). Combined IV-endovascular recanalization treatment was usually performed for cases arriving within the time window of IV thrombolysis and for those who had higher prevalence of atrial fibrillation, higher NIHSS scores, and lower pre-stroke dis- ability. The arrival-to-initiation of IV alteplase injection was comparable between IV alteplase-only and combined IV and endovascular treatment groups. Between endovascular-only and combined treatment groups, preceding IV alteplase did not cause a significant delay in the intrahospital logistics of stroke cases. Interestingly, a lower dose of IV alteplase (0.6 mg/kg) was utilized in 29% (653) of the 2,724 cases, but the proportion was much higher in the combined IV and endovascular groups at 55% (P-for difference <0.01). In the current descriptive analy-
ses, the combined IV and endovascular treatment group showed a larger degree of NIHSS score decrement over the first 24 hours following treatment, but the prevalence of hemorrhagic transfor- mation was elevated. Mortality rate at discharge and at 3 months after stroke was comparable between the IV-only and endovas- cular-treated groups, but the proportion of mRS scores of 0-1 was lower in the endovascular group. Although the efficacy of endovascular recanalization was suggested in the prior phase II trials, the scientific evidence supporting the treatment modality is still lacking, as demonstrated in phase III trials with older-gen- eration modalities.
25-27Such confusion is prevalent among CRCS-5 registry centers (Figure 4). The real-world effectiveness of hyperacute endovascular intervention warrants further inves- tigation, and the clinical registry with disparity between centers on this issue would be a valuable source for clinical analyses.
Outcomes after stroke
Definitions of outcome variables in CRCS-5 registry
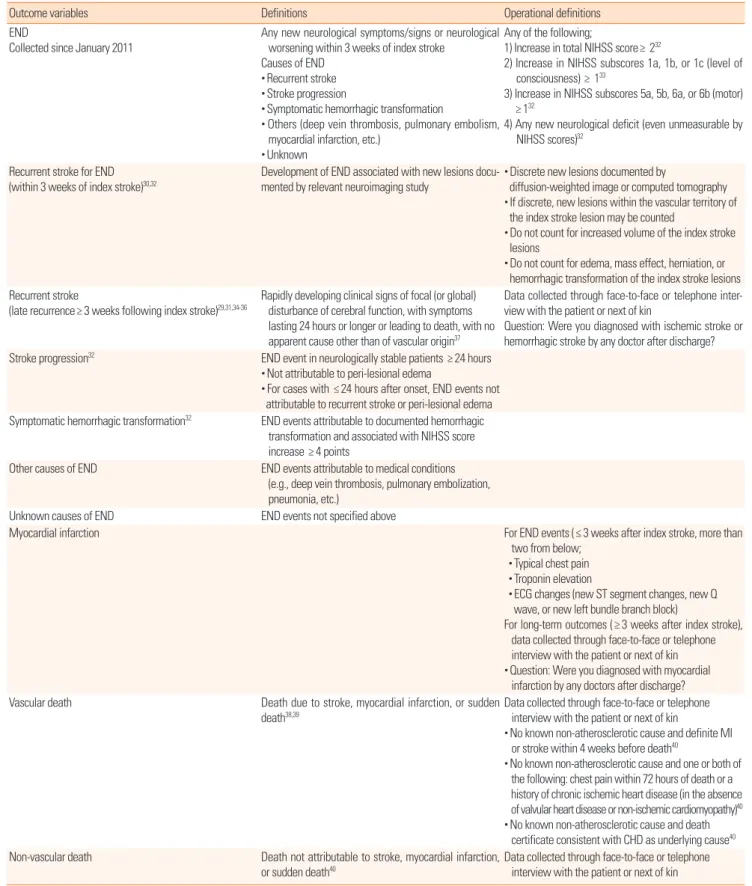
The CRCS-5 registry initiated prospective outcome collec- tion in November 2009 with a unified definition of stroke out- comes and capture strategy. The detailed definitions of major outcome variables are presented in Table 5. Long-term recur- rent events and functional outcomes have been collected since November 2009 for selected centers, and this was expanded to all participating centers in January 2011 with the introduction of END. The CRCS-5 registry steering committee checks and audits the occurrence of END and captures the rate of long- term outcomes at monthly intervals.
100 90 80 70 60 50 40 30 20 10 0
%
#1 #2 #3 #4 #5 #6 #7 #8 #10 #11 #12 #13 #14 Hospital (anonimyzed)
Proportions of treatment modalities
31 23 27 20 24 14
24 2
19 15 19 26
31 5
10 16
36 10
12 5
13 3
9
12
38
72 63 63
40 76
65 92
68
82 72
67 62 20
13
IV thrombolysis Endovascular-only recanalization Combined IV-endovascular recanalization
Figure 4. Hospital variability in hyperacute treatment modality.
Early neurological deteriorations
A total of 14,730 cases admitted after January 2011 were avail- able to analyze for ENDs. Among them, END occurred in 2,615
Table 5. Definitions of outcome variables in the CRCS-5 registry
Outcome variables Definitions Operational definitions
END
Collected since January 2011
Any new neurological symptoms/signs or neurological worsening within 3 weeks of index stroke
Causes of END
• Recurrent stroke
• Stroke progression
• Symptomatic hemorrhagic transformation
• Others (deep vein thrombosis, pulmonary embolism, myocardial infarction, etc.)
• Unknown
Any of the following;
1) Increase in total NIHSS score≥ 232
2) Increase in NIHSS subscores 1a, 1b, or 1c (level of consciousness) ≥ 133
3) Increase in NIHSS subscores 5a, 5b, 6a, or 6b (motor) ≥ 132
4) Any new neurological deficit (even unmeasurable by NIHSS scores)32
Recurrent stroke for END
(within 3 weeks of index stroke)30,32 Development of END associated with new lesions docu- mented by relevant neuroimaging study
• Discrete new lesions documented by
diffusion-weighted image or computed tomography
• If discrete, new lesions within the vascular territory of the index stroke lesion may be counted
• Do not count for increased volume of the index stroke lesions
• Do not count for edema, mass effect, herniation, or hemorrhagic transformation of the index stroke lesions Recurrent stroke
(late recurrence≥ 3 weeks following index stroke)29,31,34-36 Rapidly developing clinical signs of focal (or global) disturbance of cerebral function, with symptoms lasting 24 hours or longer or leading to death, with no apparent cause other than of vascular origin37
Data collected through face-to-face or telephone inter- view with the patient or next of kin
Question: Were you diagnosed with ischemic stroke or hemorrhagic stroke by any doctor after discharge?
Stroke progression32 END event in neurologically stable patients ≥ 24 hours
• Not attributable to peri-lesional edema
• For cases with ≤ 24 hours after onset, END events not attributable to recurrent stroke or peri-lesional edema Symptomatic hemorrhagic transformation32 END events attributable to documented hemorrhagic
transformation and associated with NIHSS score increase ≥ 4 points
Other causes of END END events attributable to medical conditions (e.g., deep vein thrombosis, pulmonary embolization, pneumonia, etc.)
Unknown causes of END END events not specified above
Myocardial infarction For END events (≤ 3 weeks after index stroke, more than
two from below;
• Typical chest pain
• Troponin elevation
• ECG changes (new ST segment changes, new Q wave, or new left bundle branch block)
For long-term outcomes (≥ 3 weeks after index stroke), data collected through face-to-face or telephone interview with the patient or next of kin
• Question: Were you diagnosed with myocardial infarction by any doctors after discharge?
Vascular death Death due to stroke, myocardial infarction, or sudden
death38,39 Data collected through face-to-face or telephone
interview with the patient or next of kin
• No known non-atherosclerotic cause and definite MI or stroke within 4 weeks before death40
• No known non-atherosclerotic cause and one or both of the following: chest pain within 72 hours of death or a history of chronic ischemic heart disease (in the absence of valvular heart disease or non-ischemic cardiomyopathy)40
• No known non-atherosclerotic cause and death certificate consistent with CHD as underlying cause40 Non-vascular death Death not attributable to stroke, myocardial infarction,
or sudden death40 Data collected through face-to-face or telephone interview with the patient or next of kin END, early neurological deterioration; NIHSS, National Institute of Health Stroke Scale; ECG, electrocardiography; MI, myocardial infarction; CHD, coronary heart disease.
cases (15%), including two ENDs in 342 cases and three separate
END events in 47 cases. The total number of END events was
3,004. The following causes led to ENDs: 300 recurrent strokes
(10%), 2059 stroke progressions (69%), 171 symptomatic hem- orrhagic transformations (6%), 147 other (5%), 300 unknown (10%), and 22 transient ischemic attacks (1%; missing informa- tion in 5 cases). Ischemic strokes characterized 92% (275 cases) of recurrent strokes, and 15 cases were found to have hemorrhag- ic stroke. The median time from stroke onset to END occurrence was 35 hours [interquartile range, 15-80].
END cases tended to be older, have higher prevalence of vascu- lar risk factors, and were dependent before the index stroke (Ta- ble 6). They had higher NIHSS scores at arrival and arrived earli- er, with higher proportions of large artery atherosclerosis and car- dioembolism. Stroke cases with END often had poor outcomes, with a longer length of stay and higher in-hospital mortality, as well as poor 3-month outcomes (Figure 5).
Functional outcomes at 3 months and 1 year after stroke
Prospective collection of long-term functional and vascular event outcomes was performed for 19,441 cases. Discharge out- come was available in 19,388 of these cases (99.7%), 3-month out-
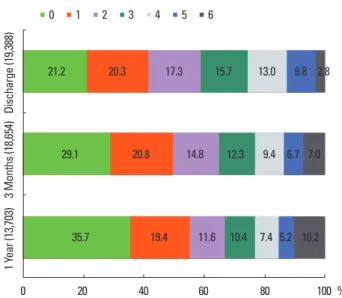
come in 18,564 cases (96%), and 1-year outcome in 13,703 cases (71%). The availability of 1-year outcome will increase, as the long- term outcome capture is an ongoing process. Cross tables compar- ing mRS scores at different time points after stroke are presented in Table 7. Overall, the proportion of acute stroke cases with mRS scores 0-1 was 42% at discharge, 50% at 3 months, and 55% at 1 year after stroke (Figure 6). Mortality rates also increased as time passed. In the China National Stroke Registry data, the proportion of mRS scores of 3-5 (dependent but not dead) at 3 months was 25.6% and 19.4% at 1 year. In comparison, the CRCS-5 registry had higher values (37% and 29%, respectively).
28Event outcomes at 3 months and 1 year after stroke
Among the 19,441 cases whose long-term outcomes were
Table 6. Characteristics of cases with or without early neurological deteriora-tion (N= 17,345)
Variables END (-)
N = 14730 END (+)
N = 2615 P Remarks
Male (%) 8,666 (58.8) 1,388 (53.1) < 0.01
Age 66.9± 13.1 69.6± 12.1 < 0.01
Pre-stroke mRS score ≥ 1 2,723 (18.5%) 597 (22.8%) < 0.01 Hypertension 9,819 (66.7%) 1,847 (70.6%) < 0.01 Diabetes 4,609 (31.3%) 944 (36.1%) < 0.01 Dyslipidemia 4,854 (33.0%) 804 (30.8%) 0.03 Habitual smoking 5,804 (39.4%) 914 (35.0%) < 0.01 Atrial fibrillation 2,701 (18.3%) 681 (26.0%) < 0.01 Pre-stroke antiplatelet use 4,367 (29.7%) 748 (28.6%) 0.28 Pre-stroke anticoagulant use 628 (4.3%) 133 (5.1%) 0.06 OTA delay (hours) 12.8 [3.3- 43.6] 7.3 [2.5-19.9] < 0.01*
OTA delay ≤ 24 hours 9,461 (64.2%) 2,084 (79.7%) < 0.01 NIHSS score at arrival 3 [1-7] 6 [3-13] < 0.01*
NIHSS score ≤ 4 points 9,529 (64.7%) 1,056 (40.4%) < 0.01 TOAST classification
Large artery atherosclerosis 4,815 (36.8%) 1,058 (41.4%) < 0.01 Small vessel occlusion 2,315 (17.7%) 255 (10.0%) Cardioembolism 2,745 (21.0%) 676 (26.4%) Other determined etiologies 310 (2.4%) 49 (1.9%) Undetermined etiologies 2,907 (22.2%) 520 (20.3%) Recanalization treatment 1817 (12.3%) 641 (24.5%) < 0.01 Duration of hospitalization 6.5 [4.5-10.3] 10.3 [6.4-17.6] < 0.01 In-hospital mortality 183 (1.3%) 307 (11.8%) Missing
in 53 cases mRS score 0-1 at 3 months 7861 (55.5%) 401 (16.3%) < 0.01 Values are presented as frequency (percentage), mean± standard deviation, or me- dian [interquartile range], as appropriate.
*P values were calculated adjusting for unequal variance.
0 10 20 30 40 50 60 70 80 90 100 %
Cases with ENDCases without END
0 1 2 3 4 5 6
Figure 5. mRS score at 3 months according to early neurological deterioration occurrence. END, early neurological deterioration.
6.1 10.2 14.1 16.7 18.9 13.2 20.8
32.6 22.9 15.4 11.6 7.8 5.1 4.6
Table 7. Cross tables comparing mRS scores at discharge versus 3 months and at 3 months versus 1 year after stroke
mRS score on discharge
mRS score at 3 months
0 1 2 3 4 5 6 Total
0 3,020 477 189 113 80 59 46 3,984
1 1,516 1,881 246 102 40 17 32 3,834
2 598 965 1,329 204 79 31 38 3,244
3 220 412 729 1,233 196 71 69 2,930
4 58 108 230 529 1,020 232 203 2,380
5 8 22 29 115 330 827 428 1,759
6 3 1 0 0 0 2 483 489
Total 5,423 3,866 2,752 2,296 1,745 1,239 1,299 18,620 mRS score at
3 months
mRS score at 1 year
0 1 2 3 4 5 6 Total
0 3,671 221 61 37 17 6 37 4,050
1 822 1,803 136 51 15 12 36 2,875
2 233 430 1,017 133 28 24 30 1,895
3 55 126 283 951 123 32 78 1,648
4 4 13 50 186 677 169 127 1,226
5 4 3 5 27 103 451 251 844
6 4 0 0 1 2 1 791 799
Total 4,793 2,596 1,552 1,386 965 695 1,350 13,337 mRS, modified Rankin Scale.
available, recurrent stroke occurred in 4.5%, vascular death in 3.0%, and composite events of recurrent stroke, myocardial in- farction and vascular death in 6.8% within 365 days of the index stroke (Table 8). The median time between stroke onset and the first event was 34 [7-116] days for recurrent stroke, 78 [21-237]
days for myocardial infarction, 8 [3-44] days for vascular death, and 18 [5-90] days for composite events. The median observa- tion period was 365 [116-382] days. Overall, the rate of vascular events after stroke was higher in the early period after stroke but decreased thereafter, for both recurrent stroke and composite events (Figure. 7).
The stroke recurrence rate was higher among older individu- als and cases with aggravated initial stroke severity (Table 9). It also differed according to ischemic stroke subtypes; the lowest recurrent rate was detected in small vessel occlusions, and simi- lar rates were observed in large artery atherosclerosis and car- dioembolism. Interestingly, the recurrence rate of stroke was lower in cryptogenic stroke cases. This discrepancy across isch- emic stroke subtypes was documented previously,
29-31but the absolute recurrent event rates from the CRCS-5 registry were lower than previously reported. This might be explained by ad- vances in the management of stroke cases and secondary pre-
vention of ischemic stroke as well as ethnic or cultural differenc- es, on which further investigations with regional collaborations among East Asian countries are warranted for clarification.
Discussions
We summarized and analyzed a prospective multicenter clini- cal stroke registry including 15 hospitals in South Korea to pro- vide a global overview of the case profiles, the status of hyper- acute recanalization treatment, and outcome information after index stroke. After the prior report involving stroke cases who ad- mitted until January 2012,
6CRCS-5 registry collected about thir- teen thousand patient and their demographic and vascular risk factor profiles were not much changed. In contrast, as discussed previously, we experienced rapid changes in acute treatment and logistics of the stroke cases, including shorter onset to arrival de- lay and increased utilization of acute recanalization treatment.
However, there still is a long road ahead before make a toast for
Table 9. Recurrent stroke rates after stroke according to the selected variables (N= 19,186)Variables 1 week 1 month 3 months 1 year
Sex
Male 121 (1.1%) 236 (2.1%) 347 (3.1%) 477 (4.3%) Female 104 (1.3%) 192 (2.4%) 274 (3.4%) 377 (4.3%) Age (years)
< 65 62 (0.9%) 137 (1.9%) 195 (2.7%) 270 (3.8%) 65-75 68 (1.2%) 120 (2.0%) 171 (2.9%) 257 (4.4%) 75-85 76 (1.5%) 132 (2.6%) 199 (4.0%) 257 (5.1%)
≥ 85 19 (1.6%) 39 (3.2%) 56 (4.6%) 70 (5.7%)
TOAST classification (N= 17,318)
Large artery atherosclerosis 82 (1.3%) 181 (2.8%) 249 (3.8%) 331 (5.1%) Small vessel occlusions 10 (0.3%) 22 (0.8%) 36 (1.3%) 54 (1.9%) Cardioembolism 71 (1.9%) 100 (2.7%) 142 (3.8%) 191 (5.1%) Other determined etiologies 7 (1.7%) 18 (4.4%) 27 (6.6%) 27 (6.6%) Undetermined etiology:
≥ 2 etiologies 11 (1.4%) 25 (3.2%) 42 (5.4%) 63 (8.1%) Undetermined etiology:
negative etiology 7 (0.5%) 21 (1.6%) 38 (2.9%) 57 (4.3%) Undetermined etiology:
incomplete work-ups
28 (1.7%) 41 (2.4%) 53 (3.1%) 74 (4.4%) NIHSS score at arrival
0-4 103 (0.9%) 215 (1.8%) 330 (2.8%) 472 (4.0%)
5-9 41 (1.1%) 88 (2.5%) 130 (3.6%) 183 (5.1%)
≥ 10 81 (2.1%) 125 (3.2%) 161(4.1%) 199 (5.1%)
Hyperacute treatment modalities
No treatment 172 (1.0%) 340 (2.1%) 512 (3.1%) 707 (4.3%) IV thrombolysis 21 (1.3%) 48 (2.9%) 61 (3.6%) 84 (5.0%) Endovascular-only
recanalization 13 (3.2%) 17 (4.2%) 21 (5.1%) 27 (6.6%) Combined IV-endovascular
recanalization 19 (3.2%) 23 (3.9%) 27 (4.5%) 36 (6.0%) Table 8. Event outcome rates after stroke (N= 19,186)
7 days 30 days 90 days 365 days
Recurrent stroke 225 (1.2%) 428 (2.2%) 621 (3.2%) 854 (4.5%) Myocardial infarction 12 (0.06%) 19 (0.1%) 41 (0.2%) 65 (0.3%) Vascular death 267 (1.4%) 411 (2.1%) 491 (2.6%) 576 (3.0%) Composite events 448 (2.3%) 771 (4.0%) 1008 (5.3%) 1304 (6.8%) Composite events include recurrent stroke, myocardial infarction, and vascular death.
0 20 40 60 80 100 %
Discharge (19,388)3 Months (18,654)1 Year (13,703)
0 1 2 3 4 5 6
Figure 6. Distribution of mRS score at discharge, 3 months, and 1 year after stroke.
21.2 20.3 17.3 15.7 13.0 9.8 2.8
29.1 20.8 14.8 12.3 9.4 6.7 7.0
35.7 19.4 11.6 10.4 7.4 5.2 10.2
Table 10. Current status of acute treatment and outcomes after acute ischemic stroke in hospital-based registries from selected countries
South Korea China Taiwan Japan United States
Title of the study CRCS-5 China National
Stroke Registry
GWTW-Taiwan 41 /TTT-AIS20
J-MUSIC/J-MARS GWTW-Stroke
Number of recruited cases 27,851 21,902 24,69541 16,92242 601,59943
Recruitment period 2008-2013 September
2007-August 2008 2006-2008 41 /
2004-200820 May 1999-April 2000 (J-MU- SIC) / October 2005- October 2007 (J-MARS)
2003-2009 (GWTW-Stroke) / 2003-2011 GWTW-Stroke
for IV thrombolysis)
Male sex 58% 61%44 60%41 61%42 48%43
Age 67± 13 64± 1344 Median 70 [60-78] 41 Mean 71 Median 73 [61-82] 43
Baseline NIHSS score 3 [1-8]
≤ 4: 60% < 4: 50%
5-14: 35%
> 14: 16%44
Median 5 [2-9] 41 0-6: 57%
7-10: 15%
11-15: 10%
16-40: 17%42
Median 5 [2-11] 43
Hypertension 67% 63%44 80%41 61%42 79%43
Diabetes 32% 18%44 45%41 25%42 32%43
Dyslipidemia 31% 10%44 49%41 17%42 39%43
Atrial fibrillation 19% 6%44 17%41 21%42 19%43
Number of recanalization treated cases 2,724 28445 24120 749242 50,79813
Frequency of recanalization treatment 13% 2.4%45 N/A N/A 4.1%43 (IV thrombolysis)
Onset-to-treatment delay Median 2.3
[1.6-3.7] hours 180 [150-228]
minutes45 Around mean
140 minutes20 N/A [last known well to arrival]
median 50 [35-70]13
Proportion of endovascular treatment 36% ≤ 7%45 N/A N/A N/A
Proportion of lower alteplase dose 29% 57%45 48%20 100%42 N/A
Symptomatic hemorrhagic transforma-
tion after recanalization treatment 7% (including
endovascular treatment) N/A 8%20 4% (at 3 months)42 N/A
In-hospital mortality 7% N/A N/A N/A N/A
Functional independency at 3 months (mRS score)
50% (0-1) 72% (0-2) 28 46% (0-1) 41 N/A N/A
Mortality at 3 months 7% 9%28 N/A N/A N/A
Numbers for eligible cases may vary according to the information. Refer to the specific references.
N/A, not available.
the improvement, as the majority of our data is based on the ter- tiary academic centers and the information on quality of care and treatment opportunities in local hospitals are not available yet.
The authors made comparison between the current CRCS-5 registry and selected hospital-based acute stroke registries from
East Asian and United States (Table 10). Stroke cases from East Asian registries share similar sex and age distributions. At least half of the East Asian ischemic stroke cases showed NIHSS score
≤4 at arrival. However, there was noticeable difference in pro- files of vascular risk factors between stroke registries; the propor-
Figure 7. Failure curves for recurrent stroke events (A) and composite outcomes (B) after the index stroke.A B
0.10 0.08 0.06 0.04 0.02 0.00
0 90 180 270 360
Number at risk 19,142 16,994 13,043 12,926 11,547 Kaplan-Meier Curve for Recurrent Stroke Events
Days after index stroke
0.10
0.07
0.05
0.03
0.00
0 90 180 270 360
Number at risk 19,142 16,525 12,871 12,734 11,169 Kaplan-Meier Curve for Composite Events
Days after index stroke