Introduction
The growing of rice with free-ranging ducks in paddy fields known as rice culture - free-range ducks (RCFD) paddy fields is one of well-known organic rice culture methods that is carried out in about 5,013 ha in 2006 in South Korea (Kim, 2007; RDA, 2004). In this farming system, free-ranging ducks eat weeds and insects in the paddy fields consequently causing the control and removal of weeds and insects even without using herbicides and insecticide (Asano et al., 1999). The weed control efficiency using free-ranging ducks in paddy fields was 65~92% and pest population was managed by ducks predation (Lee et al. 1993). Kang et al. (1995) reported that the rice yield of RCFD paddy fields, with fertilization requirement reduced by 70% of the standard fertilization, was increased by 3% because of the feces of free-ranging ducks contributory to the increase of rice root activity.
Recently, some studies have been reported that high nutrient amounts of effluent because of feces of ducks
flow out of the area during free-ranging period and concerns on the evaluation and the reduction of pollutant loads in effluent are increasing for the conservation of water quality in agro-ecosystem. The National Academy of Agricultural Science(NAAS) reported that the amount of ducks feces in 10a for 60 days of free-ranging activities is 195.9 kg containing N, P and K amounting to 63, 94 and 32%, respectively of the amounts of standard fertilization (Yoon and Hwang, 1998). It is feared that these high amount of nutrients in ducks feces, when carried by surface drainage to river systems, can be a potential source of non-point pollution.
The use of constructed or natural wetland as water purification systems are popular in rural areas, because they can be easily managed and entailed relatively low cost to construct as compared to other systems. The purification effects of wetland works by the degradation of the nutrients by microbial activity in detention pond and the absorption by vegetation (Sakadevan and Bavor.
1999; Bavor et al. 2001; Ko et a., 2003). Considering the benefits that can be derived from these wetlands, this study was carried out to evaluate the effects of a wetland in mitigating nutrition loadings from RCFD effluent to
Received : July 2. 2009 Accepted : July 30. 2009*Corresponding author: Phone : +82553501267, E-mail : [email protected]
Effects of Natural Wetland in Reducing Nutrient Loadings from Rice Culture - Free-Range Ducks (RCFD) Paddy fields in Korea
Jee-Yeon Ko,
*Jae-Saeng Lee, Ki-Youl Jung, Young-Dae Choi, Eul-Soo Yun, Koan-Sik Woo, Myung-Chul Seo, and Min-hee Nam
Department of Functional Crops, National Institute of Crop Science, Rural Development Administration, Milyang, Gyeongnam, South Korea
The amount of nutrients from the effluents of rice culture - free-range ducks (RCFD) paddy fields and the effects of natural wetlands located at downstream of RCFD on water quality and aquatic plants was evaluated. This was carried out in a 61.9 ha paddy fields in Ulsan, Gyeongnam, where downstream is a 5.9 ha natural wetland, 61% of which was covered with well-developed aquatic plants. The amounts of T-N and T-P in the effluent from paddy field with RCFD were 13.7 and 2.5 kg ha
-1, respectively, which is 1.2~2.5 times higher than those observed in conventional rice culture practice. The amount of runoff from the RCFD area, calculated using the revised TANK model, was 543 mm ha
-1with 808 kg of T-N and 130 kg of T-P during rice cultivation period. The dominant aquatic plants in the wetland includes Phragmites communis, Zizania latifolia, Persicaria thunbergii. etc. The nutrient contents of the aquatic plants which amounted to 761 kg of T-N and 103 kg of T-P were almost equivalent to 94% and 79% of the T-N and T-P in RCFD and CRC effluent. Therefore, the use and maintenance of wetlands in RCFDs area could be a good solution to management the non-point pollution from duck feces in RCFD paddy fields.
Key words: Rice culture - free-range ducks, Nutrients loads, Natural wetland, Diminishing effects
river for agro-ecosystem conservation. Specifically, this experiment was conducted to evaluate the amount of nutrients in the effluent from RCFD and the effects of a natural wetland, situated downstream of the RCFD, in restoring the quality of the effluent-laden water.
Materials and Methods
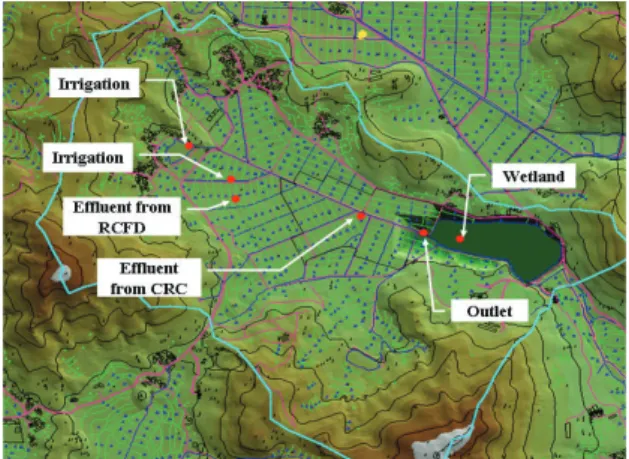
The experimental site was located in Ulsan, Gyeongnam, South Korea. The investigated 61.9 ha rice paddy is 34.2% of the total area(181 ha) of the experimental watershed (Fig. 1, Table 1). The RCFD was conducted in 74% of the paddy fields in the studied area.
The soil type of these paddy field is loam with Jisan soil series and is shown in Table 1.
To evaluate the amount of nutrient loadings in the effluent from RCFD and the effects of the natural wetland located downstream, the nutrients contents of effluents from RCFD, conventional rice culture field
(CRC), influent, outlet of RCFD area, and water from the wetland were investigated. Water samples were collected once a week from 22th May to 14th September in 2007 and analyzed for water quality parameters such as EC, T- C, T-N, T-P, NH
4-N, PO
4, Ca, and K. Chemical analysis of T-N, T-P, NH
4-N and PO
4were conducted using spectrophotometer (LABOMED US/UVD-3000/3200) by standard method (APHA, 1989), while Ca and K were analyzed using ICP (Perkin Elmer Optima 3300 DV) by water pollution standard method (Ministry of Environment, 2001).
The ducks population of RCFD field was maintained at 300 per ha and chemical fertilizers were applied at the level of 50% of CRC fertilization, which is N-P
2O
5-K
2O
= 90-45-57 kg per ha. The ducks were loosed into paddy fields at 1 week after transplanting(7th, Jun.) and were gathered before heading period(1, Aug.)
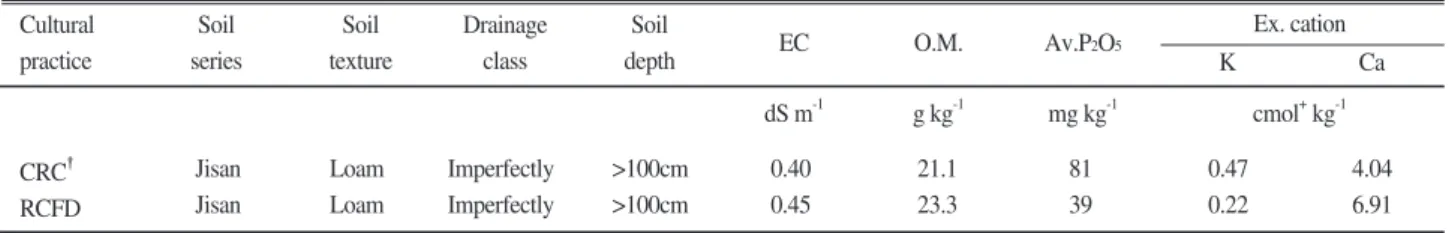
The soil physical chemical characteristics of the investigated sites are presented in Table 2. All of physical parameters like soil series, texture, drainage class and depth of paddy fields between CRC and RCFD were same, but some chemical parameters like Av. P
2O
5and potassium contents were different.
The amounts of effluent from the CRC and RCFD fields were calculated using the revised TANK model (Choi et al., 2001; Jeon et al., 2003). This model is developed for water quality determination, and while the structure is simple and needs few parameters, it appeared that it is highly applicable in evaluating paddy field drainage as shown by the 92~95% of model fit efficiency (Jeon et al., 2003, Yoon et al., 2003).
The amount of nutrients loadings from CRC and RCFD fields effluent were calculated from the investigated
Land use
"
CRC : Conventional rice cultural practice. RCFD : Rice culture using free-ranging ducks
‡Else : natural wetland 5.9 ha, built-up 6.6 ha
Soil depth Drainage classes
Soil texture Cultural
method
CRC"
RCFD 61.9
Paddy field Loam 97
Sandy loam 3
Moderately well 27 Imperfectly 73 Moderately well 28
well 72
Moderately well 55
well 45
>100cm 98
- 18.4
Upland Loam 59
Sandy loam 41
>100cm 20-50cm
67 22
- 88.2
Forest Loam 45
Sandy loam 55 50-100cm 100
Else‡ 12.5
Area
% ha % % %
Table 1. Land use pattern and soil characteristics of experimental area.
Fig. 1. The watershed map and key explanation in studied area CRC : Conventional rice cultural practice. RCFD : Rice culture using free-ranging ducks.
weekly nutrients contents and effluents amounts from CRC and RCFD predicted by the revised TANK model.
The model was used only in the case of nutrients loading from CRC effluent but not to evaluate the nutrient contents. The calculation method encounters a problem because the change of loading amounts by time series is impossible to predict when using single unit loading factor (Yang et al., 2001). The method, however, can be used to evaluate the total amount of nutrition loading because runoff amount and mass load showed liner relationship regardless of water quality constituents and rainfall amount (Yoon et al., 2002).
The conceptual considerations used in the application of the revised TANK model are described in Fig. 2.
DR = (Pd-D)
Pd = Pdj-1+ IR1j+PRj-(DRj+Etj+INFj) DR : Surface drainage amount (mm) Pd : Ponding depth (mm)
D : Height of a sluice (mm) IR : Irrigation amount (mm) PR : Rainfall amount (mm)
Et : Evapotranspiration amount (mm) INF : Infiltration amount (mm)
The height of sluice, irrigation amount and infiltration amount were measured directly in the fields and rainfall amounts used were obtained from Ulsan meteorological station. Evapotranspiration was calculated using the
Blaney-Griddle formula (Kim et al., 1984).
The biomass amount and nutrients contents of aquatic plants in the natural wetland connected with the drainage of RCFD area were investigated. The hydrophyte vegetation in the wetland were surveyed using square method (4 m
2) and chemical content of vegetation were analyze to determine amounts of total nitrogen(T-N) and total phosphate(T-P) absorption by the aquatic plants. T- N of barley straw was determined by distillation method after oven-drying at 70 for 72hr and digested in micro- Kjeldahl block heater using H
2SO
4. A subsample of oven-dried material was digested using a ternary solution(HNO
3:H
2SO
4:HClO
4, 10:1:4) for determination of T-P
Cultural practice
CRC"
RCFD
Jisan Loam Imperfectly >100cm 0.40 21.1 81 0.47 4.04
Jisan Loam Imperfectly >100cm 0.45 23.3 39 0.22 6.91
"
CRC : Conventional rice cultural practice. RCFD : Rice culture using free-ranging ducks
Ca K
Ex. cation
cmol+kg-1 Av.P2O5
mg kg-1 O.M.
g kg-1 EC
dS m-1 Soil
depth Drainage
class Soil
texture Soil
series
Table 2. Soil physical and water chemical characteristics of investigated sites.
Fig. 2. Conceptual revisied TANK model(Jeon et al., 2003) at paddy fields applied to experimental areas.
Fig. 3. Investigated sites of dominant aquatic plants in natural wetland.
Results and Discussion
Chemical characteristics of effluent from CRC and RCFD during the cultivation period Fig. 4 showed the change of influent and effluent water quality of CRC and RCFD field during cultivation. The water quality of the effluent from the RCFD field was higher than the influent and CRC field effluent in most of the chemical components until August when free-ranging ducks are present in the paddy fields. Among the chemical
parameters, T-P contents in RCFD field effluent were showed fluctuating increase and it was regarded because that fresh feces of the free ranging ducks in RCFD paddy water .
The average chemical contents of the influents, effluents from CRC and RCFD fields and outlet and natural wetland during rice cultivation period is presented in Table 3.
The average value of the major nutrient components, T- N and T-P in RCFD effluent were 19 and 273%, higher than CRC effluent respectively, but the difference in values had no statistical significance because of severe fluctuation pattern of T-N and T-P contents in the RCFD field effluent during the rice cultivation period.
Ko (2003) reported the effects of intertillage and muddying of free-ranging ducks on pH, DO, SS, NO
3-N, NH4-N and P
2O
5of stagnant water. It was observed that intertillage and muddying of stagnant water increased pH, suspended solids (SS), NO
3-N, and NH
4-N; and decreased DO and PO
4as compared to the control treatment (no-ducks but with the same amount of ducks feces were incorporated to stagnant water). These results indicate that intertillage and muddying by ducks resulted in the variation in stagnant water although the same amount of nutritions are incorporated. Moreover, the content of SS in the stagnant water subjected to intertillage and muddying by ducks was increased 8 folds as compared to the control and that high SS content was the result from the high clay amounts induced by free- ranging ducks. Previous researches reported that clay in arable fields were combined with particulate phosphorous, which include 75~90% of the type of phosphorous easily transportable to water body and became one of the factors causes eutrophication in river systems (Lee, 1971; Lemunyon et al., 1993; Ilg et al., 2005; Kim, 2005; Kim 2005). Therefore, effluents from RCFD with high SS is a potential source of non-point pollution in case of accidental overflow from paddy fields. According to Duda and Johnson (1985), the contribution of non-point source pollution from land use has been estimated at 64% of total suspended sediment and 76% of total phosphorus.
The T-N contents of the water obtained from the drainage outlet were similar to that of CRC and RCFD effluents. It was considered that the self-cleaning action of the drainage system was little because the length of the drainage channel of the experimental area was not long and made of concrete. The T-N content in wetland was
Fig. 4. Change of chemical component in influent and effluentof CRC and RCFD during the cultivation period.
"
CRC : Conventional rice cultural practice. RCFD : Rice culture using free-ranging ducks
56~61% of the T-N contents in RCFD effluent and drainage outlet. The T-P contents in wetland 50~65% of T-P contents in RCFD effluent and drainage outlet.
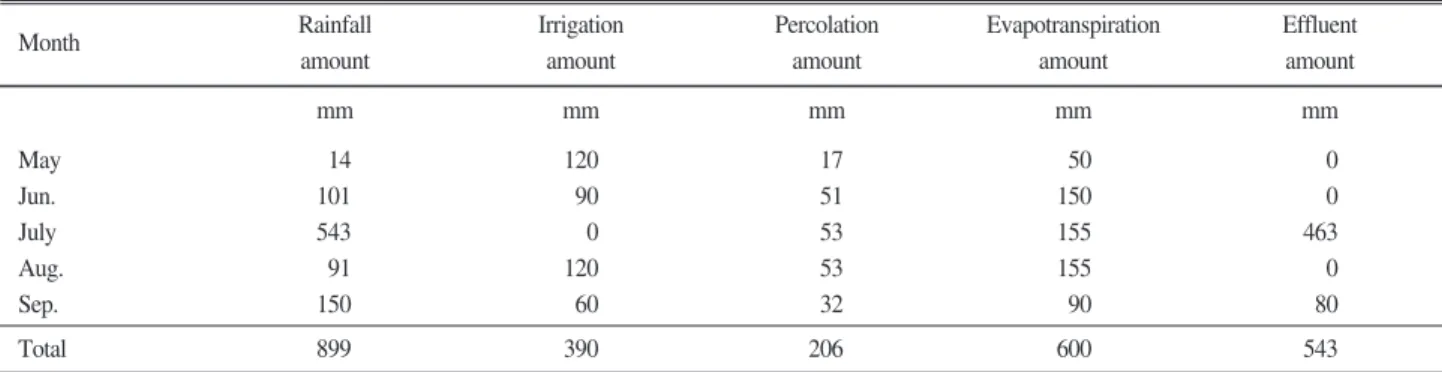
Nutrients loading amounts from RCFD and CRC area The runoff from RCFD and CRC areas were calculated during rice cultivation by the revised TANK model during the rice cultivation period and shown in Table 4. Most of the amount of runoff occurred in July and September. The computed total amount of effluent from both RCFD and CRC fields was 543 mm per ha.
The amount of nutrient loadings from RCFD and CRC
paddy fields during the rice cultivation period is presented in Table 5. The T-N amount from RCFD and CRC effluent were 13.7 and 11.3 kg/ha, while T-P amount were 2.5 and 1.0 kg ha-1, respectively.
The amount of nutrient loadings from RCFD showed low level of T-N, while T-P showed similar levels compared to earlier results of 48~52 N kg ha
-1and 1.1~1.6 P kg ha
-1in runoff water from CRC (Choi et al., 2001) and 8~39 N kg ha
-1and 1.9~4.2 P kg ha
-1(Chin et al 2002). The variations of T-N loading amounts from CRC is supposed that it can be attributed to the difference in rainfall amount during the investigated year.
Division
"
Average±Standard error, n=16
‡CRC : Conventional rice cultural practice. RCFD : Rice culture using free-ranging ducks
K mg L-1 Ca
mg L-1 PO4
mg L-1 NH4-N
mg L-1 T-P
mg L-1 T-N
mg L-1 T-C
mg L-1 EC
0.14"±0.011 0.15±0.018 0.24±0.012 0.20±0.014 0.14±0.011
12.6±0.50 15.5±1.22 30.8±2.38 22.9±2.28 16.5±1.21 Influent
Effluent from CRC‡ Effluent from RCFD Drainage outlet Natural wetland
1.5±0.28 2.1±0.41 2.5±0.38 2.3±0.34 1.4±0.28
0.15±0.057 0.19±0.533 0.52±0.683 0.40±0.599 0.26±0.575
0.16±0.031 0.65±0.247 0.39±0.053 0.37±0.063 0.25±0.045
0.05±0.007 0.04±0.005 0.07±0.010 0.06±0.006 0.05±0.008
15.2±1.16 16.1±1.73 29.3±1.89 23.2±1.65 14.8±1.04
2.6±0.29 3.4±0.68 4.0±0.41 4.5±0.28 4.6±0.35 dS m-1
Table 3. Average chemical contents of influent, effluents of CRC and RCFD, and drainage outlet and natural wetland during rice cultivation.
Month
* Height of bank of rice field: 200 mm, Height of sluice: 115 mm, Average ponding depth of RCFD and CRC paddy fields: 86 mm, Mid-season drainage, 20th July, Drainage, 10th Sep.
"
RCFD : Rice culture using free-ranging ducks, CRC : Conventional rice cultural practice.
Effluent amount
mm Evapotranspiration
amount mm Percolation
amount mm Irrigation
amount mm Rainfall
amount
14 101 543 91 150 899
120 90 0 120 60 390
17 51 53 53 32 206
50 150 155 155 90 600
0 0 463 0 80 543 May
Jun.
July Aug.
Sep.
Total
mm
Table 4. Monthly effluent amount calculated by revised TANK model during rice cultivation from RCFD""and CRC area.
Cultural method
"
CRC : Conventional rice cultural practice. RCFD : Rice culture using free-ranging ducks
‡Calculation by revised TANK model (Jeon et al. 2003)
T-P T-N
T-P T-N
T-P T-N
Contents of effluent (mg L-1)
Nutrient loading amount
(kg ha-1) Total (kg)
Area (ha)
16.3 2.1 0.2 11.3 1.0 184 16
45.6 2.5 0.5 13.7 2.5 624 114
61.9 - - - - 808 130
Amount of effluent
(mm)
543‡ CRC"
RCFD Total
Table 5. Amount of nutrient loadings from paddy fields of RCFD and CRC during rice cultivation period.
According to Choi et al. (2001), T-N loading amounts from CRC ranged from 8 to 39 N kg ha
-1depending on the amount of rainfall, while T-P amounts were nearly constant regardless of rainfall.
The T-N and T-P amounts of effluent from RCFD were 1.2~2.5 folds of the amount obtained in the CRC fields.
The total amount of T-N and T-P recorded from the entire paddy fields area were 808 kg and 130 kg, respectively.
Distribution and amount of nutrient absorbed by aquatic plants in the natural wetland The natural wetland located downstream of the RCFD area was 5.9 ha, 61% of which was coved with well developed aquatic plants. The aquatic plants distribution around natural wetland can be grouped and characterized into three area (Fig. 3, Table 6). Site 1, which is in front or upstream portion of the wetland, was covered with Phragmites communis and Persicaria thunbergii. The dominant aquatic plants in Site 2, with shallow water depth were Zizania latifolia and Persicaria thunbergii. The Site 3 area was vegetated by Trapa Japonica and covered 34%
of the wetland area.
The amount of nutrient absorbed by the aquatic plants in the natural wetland were 761 and 103 kg m
-2, T-N and T-P, respectively. These amounts were equivalent to 94 and 79% of T-N and T-P, respectively of the levels in the runoff from RFCD and CRC area. As shown in Table 3 earlier, the amounts of T-N and T-P in wetland water were decreased by similar amount when compared to the influent, and this can be attributed to the effects of
nutrition fixation or absorption by aquatic plants in wetland.
Among the investigated aquatic sites, the T-N and T-P amounts absorbed by aquatic plants at Site 2 were the highest at 46% T-N and 50% T-P, followed by Site 3 at 37% T-N and 34% T-P, and at Site 1 at 17% T-N and 16% T-P.
Conclusion
The amount of nutrients from the effluent of RCFD and the effects of a natural wetland located downstream of the RCFD in reducing nutrient loading amount from RCFD runoff were evaluated. The amount of nutrients in the effluents from RCFD were 13.7 and 2.5 kg ha
-1of T-N and T-P, respectively which are 1.2~2.5 folds the amount recorded in CRC area. These results imply that RCFD is hard to say LISA(low input sustainable agriculture) technology even though it is regarded as one of most popular environmental friendly cultural method because the products that can be derived from RCFD are safe for human consumption due to non-usage of pesticides and herbicides.
When the water quality of influent, effluent, and wetland located at downstream of the RCFD area were compared, results revealed that the T-N and T-P contents of wetland water (T-N 1.4 mg L
-1, T-P 0.26 mg L
-1) were at lower levels than in the influent (T-N 1.5 mg L
-1, T-P 0.15 mg L
-1), while higher levels were recorded in the effluent (T-N 2.5 mg L
-1, T-P 0.52 mg L
-1).
T-P T-N
T-P T-N
T-P T-N
Nutrients contents per plant
(g kg-1)
Nutrients contents per unit area
(g m-2)
Total nutrients amount in area
(kg) Biomass
(g m-2) No. of plants
(unit m-2) Aquatic
plant
Phragmites communis Persicaria thunbergii Others Sub total Zizania latifolia
Persicaria thunbergii Sub total Trapa Japonica
Sub total
116 2,082 12.4 3.0 25.8 2.7 110.0 11.7
76 201 24.7 10.5 5.0 0.9 21.2 3.9
16 27 16.2 5.9 0.4 0.1 1.9 0.3
208 2,311 53.2 19.4 31.2 3.7 133.0 16.0
104 1,273 16.3 5.3 20.7 2.9 253.8 35.8
72 409 19.2 6.2 7.7 1.3 94.0 16.4
176 1,682 39.2 11.5 30.3 4.2 347.8 52.2
146 492 28.3 8.1 13.9 1.7 280.4 35.1
492 28.3 8.1 13.9 1.7 280.4 35.1
- - - 761.2 103.3
Area (ha)
0.4
1.2
2.0
3.6 Site
St.1
St.2
St.3
Total
Table 6. Aquatic plants in downstream natural wetland and their biomass, T-N, T-P contents.
The T-N and T-P decrease in the wetland water can be attributed by the effects of nutrition fixation of aquatic plants around the wetland. The total amounts of absorbed nutrients by the biomass of the aquatic plants were 761 kg of T-N and 103 kg of T-P, equivalent to 94% and 79%
of the T-N and T-P in RCFD and CRC effluent.
Therefore, the use and maintenance of wetlands in RCFDs area could be a good solution to management the non-point pollution from duck feces in RCFD paddy fields.
References
American Public Health Association. 1989. Standard Method for the Examination of Water and Wastewater AWWA and WPCF (17th ed.). Washington DC.
Asano, H., Isobe, K. and Tsuboki, Y. 1999. Eating habits and behaviour of aigamo ducks in paddy fields. J. weed Sci. Tech. 44:
1-8.
Bavor, H. J. and C. M. Davies and K. Sakadevan. 2001. Stormwater treatment : do constructed wetlands yield improved pollutant management performance over a detention pond system? Wat. Sci.
Tech. 44(11): 565-570.
Chin, Y. M., S. W. Park, S. M. Kim, M. S. Kang and M. G. Kang.
2002. Nutrient loads estimation at paddy field using Creams-paddy model. Journal of Rural Development. 8(1): 60-68.
Choi, J. K., J. W. Koo, J. K. Son, K. S. Yoon and J. Y. Cho. 2001.
Nutrient balance and runoff loading during cropping period from a paddy plot in Maryeong irrigation district. Korean Society of Agricultural Engineers. 43(5): 153-162.
Duda, A.M., and R.A. Johnson. 1985. Cost- effective targeting of agiricultural nonpoint source pollution control. Journal of soil and water conservation. 40:108-111.
Ilg, K., Siemens, J., and Kaupenjohann, M. 2005. Colloidal and dissolved phosphorous in sandy soils as affected by phosphorous saturation. Journal of environmental quality. 34: 926-935.
Jeon, J. H., C. G Yoon, H. S. Hwang and K. S. Yoon. 2003. Water quality model development for loading estimates from paddy field, Korean Journal of Limnology. 36(3): 344-355.
Kang, Y. S., J. I. Kim and J. H. Park. 1995. Influence of rice-duck farming system on yield and quality of rice. Korean Journal of Crop Science. 40(4): 437-443.
Kim, C. W., C. G. Kim and G .C. Lee. 1984. Agricultural irrigation and drainage. 363 pp, 4nd edition, Hwangmoonsa.
Kim, J. K. 2007. Yeongnam Agricultural Research Institute, National Institute of Crop Science, Rural Development Administration. Milyang.
Kim, S. B. 2005. Agriculture phosphorous runoff and water quality management in watershed. Trends in agriculture & life science.
3(3): 22-28.
Ko, B. D. 2003. Effects of intertillage and muddying by free ranging ducks on pH and dissolved oxygen of stagnant water, and soil physiochemical properties in paddy field soil. 2003. Korean Journal of Crop Science. 48(3): 262-266.
Ko, J. Y., H. W. Kang, J. S. Lee, C. S. Kim, K. Sakadevan and H. J.
Bavor. 2003. Nutrients Removal Efficiency by Vegetation Density on Constructed Wetland from Small Watershed. Korean Journal of Environmental. Agriculture. 22(4): 266-272.
Lee, G.F. 1971. Role of phosphorous in eutrophication and diffuse source control. Water research pergamon press vol. 7 : 111-128.
Lee, G.H., J.H. Park, Y.J. Oh. 1993. Effects of free-range ducks paddy fields on rice quality. Annual Report of National Institute of Crop Science. Rural Development Administration. 184-187, Suwon, Korea.
Lemunyon, J.L. and Gilbert, R.G. 1993. The concept and need for a phosphorous assessment tool. Journal of production agriculture.
6:483-486.
Ministry of Environment, 2001, Standard Method for the Examination of Water.
Rural Development Administration. 2004. Manual for environmental friendly agriculture practice. Suwon, Korea.
Sakadevan, K. and H.J. Bavor. 1999. Nutrient removal mechanisms in constructed wetlands and sustainable water management Wat.
Sci. Tech. 40(2): 121-128.
Yang, H. M. and H. Kim. 2001. Calculation of pollutant loadings from stream watershed using digital elevation model and pollutant load unit factors. Journal of Korean Institute of Landscape Architecture. 29(1): 22-31.
Yoon, C. G., H. S. Seon, J. H. Jeon and J. H. Ham. 2003. Analysis of nutrients balance during paddy rice cultivation. Korea of Journal Limnology. 36(1): 66-73.
Yoon, H.B. and G.N. Hwang. 1998. Organic agriculture for sustainable nutrients cycling. Annual Report of National Academy of Agricultural Science. Rural Development Administration. 173- 181, Suwon, Korea.
Yoon, K. S., J. Y. Choi, K. H. Heon and J. Y. Cho. 2002. Flow weighted mean concentration and runoff-mass load relationship of pollutants derived from intensively sampled water quality data of a paddy field. Journal of the Korean Society of Agricultural Engineers. 44(5): 127-135.
오리농업재배가 이뤄지고 있는 소유역 하류에 위치한 자연습지가 오리농업시 유출되는 영양염류 부하량 저감 에 미치는 영향을 평가하였다. 오리농업재배가 이뤄지고 있는 소유역은 논면적이 61.9ha로서 총 논면적의 74%
에서 오리농업재배가 이뤄지고 있었으며 하류에 위치한 자연습지의 면적은 5.9ha를 차지하고 있었다.
재배기간 중 오리농업이 이뤄지고 있는 논물의 영양염류 함량을 조사한 결과 T-N 13.7, T-P 2.5 kg ha-1로 나 타났는데, 이는 동일기간 중 관행재배에 비해 1.2~2.5배 높은 결과였다. 하류에 위치한 자연습지의 우점초생은 갈대, 줄, 고마리 등이었으며, 이들 식생이 함유하고 있는 영양염류량은 T-N 761 kg, T-P103 kg으로서 오리재 배논으로부터 유출되는 영양염류 부하량의 94%와 79%에 해당되는 양이었다.
이와 같은 연구결과를 볼 때, 오리재배농업단지 하류에 습지를 유지하는 것은 오리농업 재배시 발생할 수 있는 영양염류 부하량을 저감시킬 수 있는 하나의 방법이 될 수 있으리라 생각된다.
오리농업재배 소유역내 자연습지가
오리농업시 유출되는 영양염류 부하량 저감에 미치는 영향
고지연*·이재생·정기열·최영대·윤을수·우관식·서명철·남민희 농촌진흥청 국립식량과학원 기능성작물부