186
JOURNALOF KOREAN FOREST SOCIETY ISSN 0445-4650(Print), ISSN 2289-0904(Online) http://e-journal.kfs21.or.kr
차세대 염기서열 분석을 이용한 굴참나무(Quercus variabilis)의 microsatellite 마커 개발 및 특성 분석
백승훈·이제완*·홍경낙·이석우·안지영·이민우
국립산림과학원 산림유전자원과
Identification and Characterization of Polymorphic Microsatellite Loci using Next Generation Sequencing in Quercus variabilis
Seung-Hoon Baek, Jei-Wan Lee
*, Kyung-Nak Hong, Seok-Woo Lee, Ji-Young Ahn and Min-Woo Lee
Division of Forest Genetic Resources, National Institute of Forest Science, Suwon 16631, Korea
요 약: 본 연구는 차세대 염기서열 분석방법을 이용하여 굴참나무의 microsatellite 마커를 개발하고 특성을 분석하 기 위해 수행되었다. GS-FLX Titanium 차세대 염기서열 분석 장비를 이용하여 305,771개의 read를 얻었고, 117 Mbp 의 데이터를 생산하였다. De novo assembly를 통하여 7,326개의 contig를 확보하였다. 크기가 500 bp 이상이 되는 contig는 2,921개로 나타났다. 그 중 microsatellite 영역을 포함하는 contig는 606개(20.75%)로 나타났으며, 총 microsatellite의 수는 911개로 확인되었다. 그 중 13개의 microsatellite 유전자좌에서 굴참나무 개체 간 다형성이 관찰 되었다. 이들 microsatellite 유전자좌에 대하여 주왕산 집단에서 관찰된 유효 대립유전자수(Ae)는 평균 4.966(2.439~7.515) 로 나타났다. 평균 이형접합도 관측치(Ho)와 평균 이형접합도 기대치(He)는 각각 0.873(0.731~1.000)과 0.766(0.590~0.867) 으로 나타났다. 다형성이 관찰된 모든 microsatellite 유전자좌에서 null 대립유전자는 관찰되지 않았으며, 마커 간 연 관불평형은 나타나지 않았다. 따라서 본 연구에서 개발된 13개의 microsatellite 마커는 굴참나무 집단의 유전변이 분 석에 유용할 것으로 사료된다.
Abstract: This study was conducted to develop microsatellite markers in Quercus variabilis using next generation sequencing. A total of 305,771 reads (384 bp on average) were generated on a Roche GS-FLX system, yielding 117 Mbp of sequences. The de novo assembly resulted in 7,346 contigs. A total of 606 contigs (20.75%) including 911 microsatellite loci were derived from the 2,921 contigs longer than 500 bp. A total of 180 primer sets were designed from the 911 microsatellite loci and screened in eight Q. variabilis individual trees sampled from a natural stand to obtain polymorphic loci. As a result, a total of thirteen polymorphic microsatellite loci were selected and used for estimating population genetic parameters in the 54 individual trees. The mean number of effective alleles was 4.996 ranging from 2.439 to 7.515. The observed heterozygosity and the expected heterozygosity ranged between 0.731 and 1.000 with an average of 0.873 and from 0.590 to 0.867 with an average of 0.766, respectively. Null alleles were not detected in all loci. No significant linkage disequilibrium was detected after Bonferroni correction in all loci. In the near future, these novel polymorphic microsatellite markers will be used to study population and conservation genetics of Q. variabilis of Korea in more detail.
Key words: Quercus variabilis, next generation sequencing, de novo assembly, microsatellite, SSR, genetic diversity
서 론
산림유전자원은 산림에 존재하는 현재 또는 미래의 경 제적 가치를 갖는 생물자원을 의미한다. 산림유전자원의 보존은 산림 생태계를 구성하는 생물 종이 지속적으로 세
대를 거듭하여 진화적 동력을 유지하고, 생물종으로서의 영속성을 지속하기 위한 측면에서 매우 중요한 의미를 갖 는다. 더욱이 국제 생물다양성협약(CBD)에 의해 생물자 원이 하나의 주권으로 인식되면서 생물자원을 효율적으 로 보존하고 관리할 필요성이 증대되고 있다(CBD-COP10, 2010).
산림유전자원의 효율적인 보존을 위해서는 정확한 평
*Corresponding author E-mail: leejeiwan@korea.kr
가가 선행되어야 한다. DNA 마커는 생물 종에 대한 유전 적인 특성을 분석할 수 있는 기술로 유전자원 보존을 위 한 평가 연구에 활용될 수 있다. 초기의 DNA 마커는 다 수의 유전자좌를 용이하게 확인할 수 있는 RAPD (randomly amplified polymorphic DNA), ISSR(inter-simple sequence repeat) 등의 우성 마커(dominant marker)가 주 로 이용되었다. 그러나 RAPD와 ISSR의 경우 재현성이 떨 어질 뿐만 아니라 우성마커의 특성상 2배체에서 우성 동 형접합체와 이형접합체 유전자형의 구분이 불가능한 단 점이 있다(Welsh and McClelland, 1990). 반면, microsatellite (또는 SSR; simple sequence repeat)는 생물체 genome상 에 존재하는 2~8 bp의 염기서열이 단순 반복되는 구조로 염기서열의 반복 횟수의 차이로 인해 다형성(polymorphism) 이 나타나는 공우성 마커이다. Microsatelltie 마커는 기타 DNA 마커와 비교하여 다형성 정도가 높아서 유전적 다 양성과 유연관계를 평가하는데 많이 이용되고 있다(Tautz, 1989; Coburn et al., 2002; Pinto et al., 2006).
Microsatellite 마커 개발을 위해 이미 밝혀져 있는 염기 서열 정보를 이용하는 방법(Varshney et al., 2005)과 selective hybridization protocol 이용하여 microsatellite 염 기서열 정보를 선택적으로 확보하는 방법이 주로 활용되 었다(Zane et al., 2002). 분석 대상종의 염기서열 정보가 충분히 밝혀진 경우 microsatellite 정보를 직접 탐색할 수 있으나, 염기서열 정보가 불충분한 경우 근연종의 염기서 열 또는 EST 정보를 활용할 수 있다. 그러나 근연종의 염 기서열 정보는 유연관계에 따라 적합하지 않을 수 있다.
EST 정보를 이용하는 경우 microsatellite 영역을 증폭하기 위한 primer 제작 시 전사 과정에 포함되지 않은 intron 영 역을 고려하지 못하기 때문에 PCR과정에서 목표한 microsatellite 영역이 잘 증폭되지 않는 경우가 발생할 수 있으며, 발현 부위에 해당하므로 전체 유전체 중 일부 영 역에 편중될 가능성이 있다. Probe를 이용한 selective hybridization protocol 방법은 반복서열로 구성된 probe에 따라 제한된 microsatellite 정보만을 확보할 수 있고, 개발 절차가 복잡한 단점이 있다. 또한, 근연종에서 이미 개발 된 마커를 이용하는 경우에도 종간 유연관계에 따라 활용 이 제한되는 단점이 있다. 최근에는 NGS(next generation sequencing)를 이용하여 마커 개발 대상종으로 부터 대량 의 염기서열 정보를 분석하고, microsatellite 영역을 직접 탐색함으로써 microsatellite 마커를 개발하는 방법이 이용 되고 있다(Gardner et al., 2011; Zalapa et al., 2012). 최 근 Vaccinium macrocarpon(Zhu et al., 2012), Quercus stellata(Chatwin et al., 2014), Acer miyabei(Saeki et al., 2015) 등 많은 수종에서 NGS기법을 이용한 microsatellite 마커가 개발된 바 있다.
국내 자생수종에 대한 microsatellite 마커 개발 연구는
염기서열 정보의 부재와 높은 초기 개발 비용으로 인하여 활발히 진행되지 않았으나, 최근 차세대 염기서열 분석 (NGS) 장비의 보급이 확대되고, 분석 비용이 절감됨에 따 라 microsatellite 마커가 개발되지 않은 자생수종에서 NGS 를 이용한 염기서열 확보와 microsatellite 마커 개발의 당 위성이 높아지고 있다.
굴참나무(Quercus variabilis Blume)는 참나무과(Fagaceae) 참나무속(Quercus)에 속하는 낙엽활엽교목으로서 중국, 대 만, 일본과 국내에는 제주도를 제외한 중부이남 전역에 분 포하는 수종이다(Lee, 2006; Chen et al., 2012). 굴참나무 유전변이 연구와 관련하여 우리나라를 비롯한 중국, 일본, 대만에 분포하는 자연집단을 대상으로 동위효소와 RAPD, chloroplast DNA, ISSR 마커를 이용하여 공간분포, 유전 다양성 및 구조에 관한 연구가 수행되었다(Song et al., 2000; Zhou et al., 2003; Xu et al., 2004; Chen et al., 2012). Xu et al.(2004)은 참나무속 근연종에서 개발된 microsatellite 마커를 이용하여 중국에 분포하는 굴참나무 집단의 유전다양성을 평가한 바 있으며, Wang et al.
(2015b)은 선택적인 probe를 이용하는 방법으로 굴참나무 microsatellite 마커를 개발하였으나, 분석 가능한 마커의 수와 다형성이 충분하지 않았다
본 연구는 굴참나무 유전변이 분석을 위한 microsatellite 마커를 개발하기 위하여, NGS를 이용하여 굴참나무의 염 기서열 정보를 확보하고, 염기서열 정보로부터 microsatellite 영역을 탐색하였으며, 이들 영역에서의 다형성 탐색을 위 한 특이적인 마커를 개발하고 유전적인 특성을 분석하였다.
재료 및 방법
1. 차세대 염기서열 분석 및 microsatellite 탐색 Microsatellite 마커 개발에 필요한 굴참나무의 염기서열 정보를 얻기 위하여 천연기념물 271호로 지정된 ‘신림동 굴참나무’로부터 DNA를 추출하였다. DNA 추출은 DNA 추출 키트(DNeasy Plant Mini Kit, QIAGEN, Germany) 를 사용하여 제조사의 설명에 따라 추출하였다. 추출된 DNA는 연무분무기(Aeromist Nebulizer, Alliance Medical, USA)를 이용하여 무작위로 절단시킨 후, 라이브러리 키 트(GS FLX Titanium Rapid Library Preparation Kit, Roche, Switzerland)를 이용하여 제조사의 설명에 따라 DNA library를 제작하였다. DNA 분석기(Agilent 2100 Bioanalyzer, Agilent Technologies, CA)을 이용하며 library 크기를 확인하고 fluorescence 측정을 통해 library양을 확 인하였다. 이후 GS-FLX Titanium(Roche) 염기서열 분석 기를 이용하여 pyrosequencing를 수행하였다. 생성된 염기 서열 정보는 미국국립생물정보센터(National Center for Biotechnology Information) SRA(Sequence Read Archive)
에 등록하였다(SRR3679030). GS-FLX platform을 통해 생성된 데이터로부터 Roche GS-FLX software(v 2.9)를 이 용하여 염기서열 read를 선별하였다. 선별된 read는 Roche GS De novo Assembler(v 2.9)를 이용하여 De novo assembly를 진행하였다. 생성된 contig중 500 bp 길이 이상 의 contig를 대상으로 MSATCOMMANDER (Faircloth, 2008) 프로그램을 이용하여 contig내에 존재하는 microsatellite 영역을 탐색하였다. 탐색조건은 mononucleotide의 경우 10 회 이상 반복, dinucleotide의 경우 6회 이상 반복, tri-, tetra-, penta-, hexanucleotide의 경우 4회 이상 반복으로 조정하였다. 단일 contig 내에 두 개 이상의 microsatellite 영역이 탐색되는 경우, 임의로 한 개의 microsatellite 영역 을 선택하여 contig 당 한 개의 microsatellite 영역만 분석 되도록 하였다. 탐색된 microsatellite 영역을 증폭하기 위 한 특이 primer의 설계는 Primer3(Untergasser et al., 2012) 프로그램을 이용하였으며, primer 길이는 18~22 bp, 증폭 산물의 크기는 150~350 bp, Tm 값이 57oC~63oC로 조정하였다.
2. microsatellite 유전자좌의 다형성 확인
염기서열 정보를 바탕으로 탐색된 microsatellte 영역을 실제로 증폭할 수 있는 primer를 선발하기 위하여 굴참나 무 8개체를 대상으로 PCR 분석을 수행하였다. PCR 분석 을 위한 반응용액은 12 µL당 20 ng 주형 DNA, 1X reaction buffer, 0.2 µM primer mix, 0.1 mM dNTPs, 1 mM MgCl2, 1 U Taq DNA polymerase(RBC Bioscience, Taiwan)로 조 성하였다. 각 primer의 forward sequence의 5'말단에는 형 광물질인 FAM 또는 HEX dye를 결합시켜서 합성함으로 써 증폭산물 분획 시 결과물이 형광을 띄게 만듦으로써 DNA 분석기(ABI 3730xl DNA Analyzer, Applied Biosystems, USA)를 이용한 PCR product의 절편 크기 측정이 가능하게 하였다. PCR 증폭은 95oC에서 5분간 초 기 DNA 변성 처리 후 95oC에서 30초간 DNA 변성, 60oC에서 30초간 주형 DNA와 primer 접합, 72oC에서 30 초간 DNA 신장 과정을 40회 반복하였으며, 추가적으로 72oC에서 10분간 신장 과정을 수행하였다. PCR 증폭산물 을 포름아마이드(Hi-DiTM Formamide, Applied Biosytems) 와 사이즈 스탠다드(GeneScanTM-500 ROXTM Size Standard, Applied Biosytems)와 혼합하여 분획하였다. 증폭산물의 유 전자형은 Gene Mapper software(v 4.0; Applied Biosystems) 를 이용하여 결정하였다.
3. Microsatellite 마커 유전통계분석
다형성이 확인된 유전자좌에 대하여 주왕산 지역의 굴 참나무 집단에서 채취된 54개체를 대상으로 PCR분석을 수행하였으며, 분석 조건은 위와 동일하였다. 굴참나무 집
단에서 분석된 SSR 증폭 결과에 따라 GenAlEx(v 6.5;
Peakall and Smouse, 2006)프로그램을 이용하여 각 유전 자좌별 대립유전자수(A), 유효 대립유전자수(Ae), 이형접 합도 관측치(Ho), 이형접합도 기대치(He), 고정지수(F), polymorphism information content(PIC)를 계산하였다.
Null 대립유전자의 존재는 MICRO-CHECKER (v 2.2.3;
Van Oosterhout et al., 2004)로 분석하였다. Hardy- Weinberg 평형(HWE)은 GENEPOP(v 4.2; Rousset, 2008)에서 Markov chain의 exact test(Guo and Thompson, 1992)를 통하여 분석하였으며, FSTAT(v 2.9.3.2; Goudet, 2002)를 이용하여 Weir (1979)의 방식에 따라 연관불평형 (linkage disequilibrium) 여부를 분석하였다.
결과 및 고찰
1. 염기서열 분석 및 de novo assembly
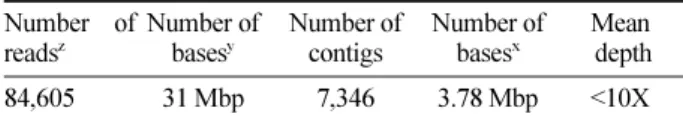
NGS를 이용하여 굴참나무의 염기서열을 분석한 결과 총 305,771개의 염기서열 read를 얻었으며, 총 길이의 합 은 약 117 Mbp로 나타났다(Table 1). 참나무속의 게놈 크 기는 565(Q. velutina)~901(Q. petraea) Mbp의 범위로 분 포하는데, 굴참나무와 함께 Cerris 아속에 포함되는 근연 종인 상수리나무(Q. acutissima)의 게놈 크기가 684 Mbp 임을 고려할 때 굴참나무의 게놈 크기도 이와 유사한 범 위에서 분포할 것으로 추정할 수 있다(Kremer et al., 2007). 근연종인 상수리나무의 게놈 크기를 기준할 경우 본 연구에서 분석된 굴참나무의 염기서열은 전체 게놈의 약 17.1%에 해당한다. 총 305,771개의 read를 이용하여 assembly를 수행 한 결과 전체의 약 28%에 해당하는 84,605개의 read가 assembly에 사용되었으며, 이들 read의 길이의 총 길이는 약 30 Mbp로 확인되었다. De novo assembly 결과 7,346개의 contig가 생성되었다. 이들의 총 길이는 3.78 Mbp(평균 515 bp)이었으며, G+C 함량은 38.4%로 나타났다(Table 2). 이러한 결과는 굴참나무와 같 이 참나무 속 수종인 Quercus stellata의 NGS 결과(염기서 열 read수=305,717개, 평균 contig 길이=601 bp)와 유사하
Table 1. Reads, total length, averaged read length of sequences.
Sequence reads Total bases Averaged read length
305,771 117 Mbp 384 bp
Table 2. Summary of de novo assembly.
Number of readsz
Number of basesy
Number of contigs
Number of basesx
Mean depth 84,605 31 Mbp 7,346 3.78 Mbp <10X
zthe reads used in the assembly computation
ythe length of reads used in the assembly computation
xthe length of contigs
였다(Chatwin et al., 2014). 본 논문에서 생성된 대부분의 contig가 3~6X 이하의 depth를 나타내었으며, 전반적으로 10X 미만의 depth를 나타내었다. 본 연구에서 확보된 contig의 크기 분포는 길이가 증가할수록 contig의 수가 감 소하여 멱법칙(power law) 분포와 유사하였으며, Primula possonii, P. wilsonii(Zhang et al., 2013) 및 Veratrilla baillonii(Wang et al., 2015a)에서에서 관찰된 contig 크기 의 분포와 유사하였다.
2. Microsatellite 탐색 및 다형성 확인
생성된 contig에 포함된 microsatellite를 탐색하기 위해 최소 길이가 500 bp 이상이 되는 contig를 선별한 결과 40%
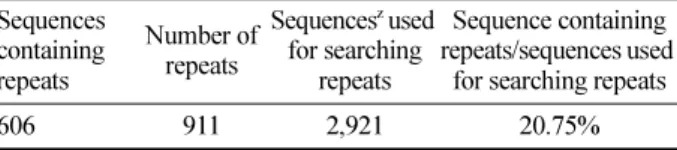
에 해당하는 2,921개로 나타났으며, 평균 808 bp(N50=752 bp)로 확인되었다. 이들 contig에 대하여 microsatellite 영 역을 탐색한 결과 20.75%에 해당하는 606개 contig에서 911개(1.5개/contig)의 microsatellte 영역이 확인되었다 (Table 3). 이들 microsatellite 영역에 대하여 PCR증폭이 가능한 primer set를 설계한 결과, 설계 조건에 적합한 primer 중 180개의 primer set를 제작하였다. 이들 primer set를 이용하여 주왕산 굴참나무 8개체를 대상으로 PCR 분석을 수행한 결과, 13개의 primer set에서 안정적인 증 폭양상을 나타내었으며, 개체 간 다형성이 확인되었다 (Table 4). Brondani et al.(1998)는 유칼립투스를 대상으로 수행한 연구에서 microsatellite enriched library 제작 과정
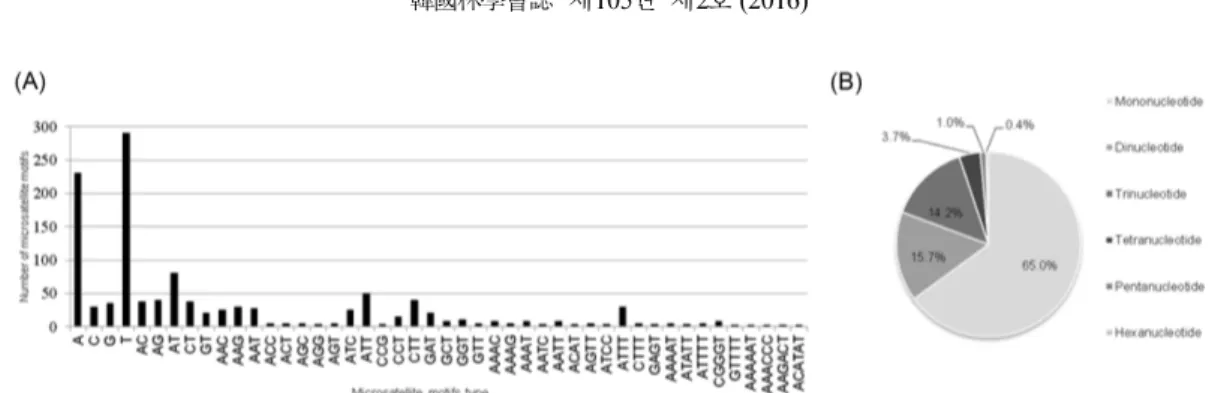
중 enrichment 단계에서 microsatellite를 포함하는 contig 가 10~40% 정도 산출된다고 보고하였다. 본 연구에서 microsatellite를 포함하는 contig가 20.75%로 나타나 Brondani et al.(1998)의 결과와 유사한 수준이었다. 본 연 구에서 500 bp 이상의 contig 만이 microsatellite 탐색에 이용되었기 때문에 분석된 전체 contig를 대상으로 microsatellite를 탐색한다면 보다 많은 microsatellite를 탐 색할 수 있을 것으로 추측된다. 그럼에도 불구하고 microsatellite 영역을 안정적으로 증폭할 수 있는 primer를 제작하기 위해서 microsatellite 영역을 포함하는 충분한 염 기서열 정보가 필요하기 때문에, 500 bp 이상의 contig를 우선하여 microsatellite 영역을 탐색하는 것이 유리할 것 으로 판단된다. 탐색된 microsatellite를 반복되는 염기서열 의 수에 따라 구분하면, 단일염기로 구성된 microsatellite 가 65%로 가장 많이 나타났다. 그 다음으로 두 개와 세 개 의 염기로 구성된 microsatellite가 각각 15.7%와 14.2%로 높은 비율을 차지하였다. 반면 4개 이상의 염기로 구성된 microsatellite은 5.1%에 불과하였으며, 그 중 6개의 염기 로 구성된 microsatellite가 0.4%로 가장 적게 나타났다 (Figure 1). Sonah et al.(2011)이 단자엽과 쌍자엽 식물의 염기서열(whole genome sequence)을 이용하여 microsatellite 를 탐색한 결과에서 단일염기로 구성된 microsatellite의 비 율이 43~79%, 4개 이상의 염기로 구성된 microsatellite가 0.9~5.4%, 6개의 염기로 구성된 microsatellite 비율이 0.1~0.6%로 나타나 본 연구의 결과와 유사하였다.
3. 유전다양성 및 특성
주왕산 지역의 굴참나무 집단에서 채취된 54개체를 대 상으로 개발된 13개의 microsatellite 마커를 적용하였다 (Table 5). 각 microsatellite 마커별 관찰된 대립유전자 수 (A)는 최소 4개에서 최대 22개로 확인 되었으며 평균 9.843 Table 3. Summary of microsatellite analysis.
Sequences containing repeats
Number of repeats
Sequencesz used for searching
repeats
Sequence containing repeats/sequences used for searching repeats
606 911 2,921 20.75%
zContigs longer than 500 bp
Table 4. Characteristics of 13 microsatellite markers developed in Q. variabilis.
Marker Motif Primer sequence (5'→3') Observed size
ranges(bp) QVn_001 (AAACCC)4 F: TGGAAAATTCTCCCACGACA R: TCACATGGGGTTTGTTAGGGA 229-253
QVn_014 (AAAT)4 F: GTGCCAGGCCAAATGCTTAA R: AGCACTTGTACCAAGCCCTT 330-378
QVn_016 (AAAG)4 F: TTGGTCTGTGATGGTCCGTG R: TGGTAACATTTCTCAATTTTTGATT 333-389
QVn_023 (AAT)6 F: CACGTTGCTTGTTGTTCCCC R: TAGGATTCAAGGCCCCCTCT 170-203
QVn_052 (AAT)7 F: TCAAATGGTGCGTTGAACTT R: AAATGTTGAGCCACCCCCAT 300-372
QVn_055 (CCT)4 F: CCCCCTCCTCCTCTTTCCTT R: AGAGGAGGACCCAGTACCAC 290-341
QVn_058 (ATT)6 F: AGAGCAGACATCCTCGGACT R: TTGGTAGCCAAACGCATACT 367-388
QVn_068 (AC)9 F: TCCCAATACTCTCAACAACAA R: ACATGTGCAGGTACAATGTGA 169-259
QVn_086 (AT)11 F: AGGACAAAGTGCCTTGCTCA R: CGCAATTCCTACGAATTAAGGGT 262-298
QVn_119 (ATT)12 F: TGAGTTAAGGGGATCAGAGT R: GGTTTGTTGGGCCATTGTCC 149-182
QVn_120 (GAT)4 F: TGAACACTCATGTCAGCCGT R: CACCGGAAGAGCTAGCATCC 158-185
QVn_122 (AGG)4 F: GCCGTCTTTTGAAGCTTGGG R: TCCAAGGATGCTTCAAGGCC 163-175
QVn_134 (AAT)11 F: ACTTTTGCCATTTCTCTCTATCTCT R: TCTTACGGATGCTGTTGGACA 243-270 Annealing temperature was 60oC for all markers, F: forward, R: reverse.
으로 나타났다. 평균 유효 대립유전자수(Ae)는 4.966으로 QVn_086 primer에서 7.515로 가장 많은 수의 유효 대립 유전자가 관찰되었고, Qvn_120 primer에서 2.439로 가장 낮은 수치가 확인되었다. 이형접합도 관측치(Ho)는 0.731~1.000으로 평균 0.873으로 나타났고, 이형접합도 기 대치(He)는 관측치보다 다소 낮은 0.590~0.867로 평균 0.766으로 나타났다. 13개의 유전자좌 중 3개의 유전자좌 에서 양의 고정지수 값을 갖는 것으로 나타났다. Botstein et al.(1980)은 마커의 다형성 정도를 나타내는 PIC 값이 0.5 이상이면 충분한 개체식별력을 갖는 것으로 보고하였 는데, 본 연구에서 개발된 13개의 유전자좌의 평균 PIC 값 이 0.732로 나타나 이들 마커가 상당히 높은 개체식별력 이 있는 것으로 판단된다. Wang et al.(2015b)이 보고한 microsatellite probe 기반의 굴참나무 microsatellite 마커 개발 연구에서 집단 내 대립유전자 수는 2~6개, 이형접합 도 기대치는 0.042~0.750으로 보고된 바 있다. 이러한 결 과와 비교할 때 본 연구에서 계산된 13개의 microsatellite 마커의 주왕산 집단에서의 대립유전자 수(4~22개)와 이형 접합도 기대치(0.590~0.867)가 보다 높게 나타나, 굴참나 무의 유전다양성을 확인하는데 유용한 마커로 판단된다.
Null 대립유전자는 microsatellite 마커 분석 시 해당 염 기의 반복은 존재하나 primer의 3'말단 측에 존재하는 변 이로 인해 증폭되지 않거나, PCR 과정에서 경쟁에 의해 특정 반복회수의 대립유전자가 치우쳐 증폭되어, 실제 존 재하는 대립유전자를 관찰하지 못하는 현상이다. Null 대 립유전자에 의해서 대립유전자 및 유전자형 빈도 해석에 오류가 나타날 수 있으며, Hardy-Weinberg 평형(HWE)상 태 보다 동형접합자의 빈도가 높아지는 결과를 초래할 수 있다(Dakin and Avise, 2004). 본 연구에서 개발된 13개의 microsatellite 마커의 null 대립유전자 분석결과, 모두 null 대립유전자가 존재하지 않는 것으로 나타났다. 또한 13개 의 마커 간 Bonferroni correction을 적용한 연관불평형 분 석 결과 마커 간 연관불평형은 나타나지 않아 굴참나무 집단의 유전변이를 분석하는데 유용한 것으로 판단된다.
결 론
산림유전자원 보존 대상종의 유전다양성과 유전구조에 대한 평가는 효율적인 보존 전략 마련에 합리적인 기준을 제시할 수 있다. DNA 마커는 산림유전자원의 유전특성 Figure 1. (A) Distribution and (B) proportion of microsatellite motifs from Q. variabilis genome.
Table 5. Genetic characterization of polymorphic microsatellite markers in Q. variabilis.
Locus N A Ae Ho He F PIC
QVn_001 53 4 2.881 0.774 0.653 -0.185 0.583
QVn_014 54 9 3.496 0.944 0.714 -0.323 0.678
QVn_016 54 12 6.545 0.778 0.847 0.082 0.831
QVn_023 54 12 6.696 0.815 0.851 0.042 0.835
QVn_052 53 10 3.665 0.868 0.727 -0.194 0.707
QVn_055 52 7 2.952 0.904 0.661 -0.367 0.604
QVn_058 54 8 4.490 0.944 0.777 -0.215 0.747
QVn_068 52 22 6.288 0.731 0.841 0.131 0.830
QVn_086 54 14 7.515 0.870 0.867 -0.004 0.856
QVn_119 54 11 7.336 0.870 0.864 -0.008 0.849
QVn_120 54 5 2.439 0.944 0.590 -0.601 0.506
QVn_122 54 4 3.399 1.000 0.706 -0.417 0.653
QVn_134 54 10 6.853 0.907 0.854 -0.062 0.839
Mean - 9.846 4.966 0.873 0.766 -0.163 0.732
A=number of alleles; Ae=number of effective alleles; Ho=observed heterozygosity; He=expected heterozygosity; F=fixation index; PIC=
polymorphism information contents
을 평가하기 위한 핵심 기술로 활용되는데, 최근에는 차 세대 염기서열 분석의 보급이 확대됨에 따라 분석 대상 종으로 부터 직접 염기서열을 분석하고, 이를 바탕으로 microsatellite와 같은 공우성 DNA 마커를 개발하는 추세 이다. 본 연구는 국내 굴참나무의 유전변이 분석을 위한 microsatellite 마커를 개발하고자 차세대 염기서열 분석 (NGS)을 수행하여 염기서열을 확보하였다. De novo assembly를 통하여 확보한 염기서열에서 직접 microsatellite 를 추출하는 방법을 통하여 180개의 후보 microsatellite 마 커에서 13개의 다형성 마커를 개발하였다. 이들 마커를 주 왕산 굴참나무 집단에 적용한 결과 충분한 다형성이 나타 났으며, null 대립유전자와 연관불평형성이 나타나지 않아 굴참나무 집단의 유전변이 분석에 유용한 것으로 확인되 었다.
국내 자생 수종의 경우 지역적으로 우리나라에만 분포 하거나 아시아 지역에 제한적으로 분포하기 때문에, 세계 적인 관심도가 낮아 염기서열 정보가 분석되거나 DNA 마 커가 다양하게 개발되지 않은 실정이다. 근연종에서 개발 된 염기서열 정보와 마커를 이용하는 방법이 대안이 될 수 있으나, 근연관계의 정도에 따라 직접 활용이 어려운 경우가 많다. 따라서 국내 분포하는 자생수종의 유전자원 보존을 위하여 보존 대상 수종의 충분한 DNA 마커를 개 발할 필요가 있으며, 이를 위하여 차세대 염기서열 분석 등의 관련 연구가 수반되어야 할 것으로 사료된다.
References
Botstein, D., White, R.L., Skolnick, M., and Davis, R.W. 1980.
Construction of a genetic linkage map in man using restriction fragment length polymorphisms. American Journal of Human Genetics. 32(3): 314.
Brondani, R.P.V., Brondani, C., Tarchini, R., and Grattapaglia, D.
1998. Development, characterization and mapping of micro- satellite markers in Eucalyptus grandis and E. urophylla.
Theoretical and Applied Genetics 97(5-6): 816-827.
Chatwin, W.B., Carpenter, K.K., Jimenez, F.R., Elzinga, D.B., Johnson, L.A., and Maughan, P.J. 2014. Microsatellite primer development for post oak, Quercus stellata (Fagaceae).
Applications in Plant Sciences 2(10).
Chen, D., Zhang, X., Kang, H., Sun, X., Yin, S., Du, H., Yamanaka, N., Gapare, W., Wu, H.X., and Liu, C. 2012.
Phylogeography of Quercus variabilis based on chloro- plast DNA sequence in East Asia: multiple glacial refu- gia and mainland-migrated island populations. PloS One 7(10): e47268.
Coburn, J.R., Temnykh, S.V., Paul, E.M., and McCOUCH, S.R. 2002. Design and Application of Microsatellite Marker Panels for Semiautomated Genotyping of Rice (L.). Crop
Science 42(6): 2092-2099.
COP10, C.B.D. 2010. Strategic Plan for Biodiversity, 2011- 2020. In Conference of the Parties to the Convention on Biological Diversity, Nagoya, Japan.
Dakin, E.E. and Avise, J.C. 2004. Microsatellite null alleles in parentage analysis. Heredity 93(5): 504-509.
Faircloth, B.C. 2008. msatcommander: detection of microsat- ellite repeat arrays and automated, locus-specific primer design. Molecular Ecology Resources 8(1): 92-94.
Gardner, M.G., Fitch, A.J., Bertozzi, T., and Lowe, A.J. 2011.
Rise of the machines–recommendations for ecologists when using next generation sequencing for microsatellite devel- opment. Molecular Ecology Resources 11(6): 1093-1101.
Goudet, J. 2002. FSTAT 2.9. 3: a program to estimate and test gene diversities and fixation indices (updated from Gou- det 1995).
Guo, S.W. and Thompson, E.A. 1992. Performing the exact test of Hardy-Weinberg proportion for multiple alleles.
Biometrics 361-372.
Kremer, A,, Casasoli, M., Barreneche, T., Bodénès, C., Sisco, P., Kubisiak, T., Scalfi, M., Leonardi, S., Bakker, E.G., Buiteveld, J., Romero-Severson, J., Arumuganathan, K., Der- ory, J., Scotti-Saintagne, C., Roussel, G., Bertocchi, M.E., Lexer, C., Porth, I., Hebard, F., Clark, C., Carlson, J., Plomion, C., Koelewijn, H., Villani, F., 2007. Fagaceae trees. pp.
161-187. In: C. Kol, ed. Genome Mapping and Molecu- lar Breeding in Plants. Springer, Berlin Heidelberg.
Lee, Y.N. 2006. New flora of Korea. Kyohaksa, Seoul, Korea.
pp. 975.
Peakall, R.O.D. and Smouse, P.E. 2006. GENALEX 6: genetic analysis in Excel. Population genetic software for teach- ing and research. Molecular Ecology Notes 6(1): 288-295.
Pinto, L.R., Oliveira, K.M., Marconi, T., Garcia, A.A.F., Ulian, E.C., and De Souza, A.P. 2006. Characterization of novel sugarcane expressed sequence tag microsatellites and their comparison with genomic SSRs. Plant Breeding 125(4):
378-384.
Rousset, F. 2008. genepop’007: a complete re-implementation of the genepop software for Windows and Linux. Molecular Ecology Resources 8(1): 103-106.
Saeki, I., Hirao, A.S., and Kenta, T. 2015. Development and evaluation of microsatellite markers for Acer miyabei (Sapindaceae), a threatened maple species in East Asia.
Applications in Plant Sciences 3(6): 1500020.
Sonah, H., Deshmukh, R.K., Sharma, A., Singh, V.P., Gupta, D.K., Gacche, R.N., Rana, J.C., Singh N.K., and Sharma, T.R. 2011. Genome-wide distribution and organization of microsatellites in plants: an insight into marker develop- ment in Brachypodium. Plos One 6(6): e21298.
Song, J.H., Kim, N.S., Yi, Y.S., Kim, Y.J., Song, J.M., and Yi, J.S. 2002. Genetic variation of Quercus variabilis in Korea based on RAPD marker analysis. Korean Journal of Genetics 24(2): 189-195.
Tautz, D. 1989. Hypervariabflity of simple sequences as a gen- eral source for polymorphic DNA markers. Nucleic Acids Research 17(16): 6463-6471.
Untergasser, A., Cutcutache, I., Koressaar, T., Ye, J., Faircloth, B.C., Remm, M., and Rozen, S.G. 2012. Primer3-new capabilities and interfaces. Nucleic Acids Rresearch 40(15):
e115-e115.
Van Oosterhout, C., Hutchinson, W.F., Wills, D.P., and Ship- ley, P. 2004. MICRO-CHECKER: software for identify- ing and correcting genotyping errors in microsatellite data.
Molecular Ecology Notes 4(3): 535-538.
Varshney, R.K., Graner, A., and Sorrells, M.E. 2005. Genic microsatellite markers in plants: features and applications.
Trends in Biotechnology 23(1): 48-55.
Wang, L., Wang, Z., Chen, J., Liu, C., Zhu, W., Wang, L., and Meng, L. 2015a. De Novo transcriptome assembly and development of novel microsatellite markers for the tradi- tional chinese medicinal herb, Veratrilla baillonii Franch (Gentianaceae). Evolutionary Bioinformatics 11: 39-45.
Wang, X., Li, J., and Li, Y. 2015b. Isolation and characteriza- tion of microsatellite markers for an endemic tree in East Asia, Quercus variabilis (Fagaceae). Applications in Plant Sciences 3(6): 1500032.
Weir, B.S. 1979. Inferences about linkage disequilibrium. Biomet- rics 235-254.
Welsh, J. and McClelland, M. 1990. Fingerprinting genomes using PCR with arbitrary primers. Nucleic Acids Research 18(24): 7213-7218.
Xu, X.L., Xu, L.A., Huan, M.R., and Wang, Z.R. 2004. Genetic diversity of microsatellites (SSRs) of natural populations of Quercus variabilis. Yi chuan=Hereditas/Zhongguo yi chuan xue hui bian ji 26(5): 683-688.
Zalapa, J.E., Cuevas, H., Zhu, H., Steffan, S., Senalik, D., Zeldin, E., McCown B., Harbut R., and Simon, P. 2012. Using next- generation sequencing approaches to isolate simple sequence repeat (SSR) loci in the plant sciences. American Journal of Botany 99(2): 193-208.
Zane, L., Bargelloni, L., and Patarnello, T. 2002. Strategies for microsatellite isolation: a review. Molecular Ecology 11(1): 1- 16.
Zhang, L., Yan, H.F., Wu, W., Yu, H., and Ge, X.J. 2013. Compar- ative transcriptome analysis and marker development of two closely related Primrose species (Primula poissonii and Primula wilsonii). BMC Genomics 14(1): 1.
Zhou, J.Y., Guo, J.Z., and Yang, Z.S. 2003. Variation of per- oxidase isozyme on natural populations of Quercus vari- abilis. Journal-Northwest Forestry University 18(2): 33-36.
Zhu, H., Senalik, D., McCown, B.H., Zeldin, E.L., Speers, J., Hyman, J., Bassil, N., Hummer, P., Simon, W., and Zal- apa, J.E. 2012. Mining and validation of pyrosequenced simple sequence repeats (SSRs) from American cranberry (Vaccinium macrocarpon Ait.). Theoretical and Applied Genetics 124(1): 87-96.
(Received: February 29, 2016; Accepted: April 4, 2016)