GIS-based Meteorological Data Processing Technology for Forest Fire Danger Rating Forecast System of China
7
0
0
전체 글
(2)
(3)
(4)
(5)
(6)
(7)
수치
관련 문서
Abstract The variability and temporal trends of the annual and seasonal minimum and maximum temperature, rainfall, relative humidity, wind speed, sunshine hours, and
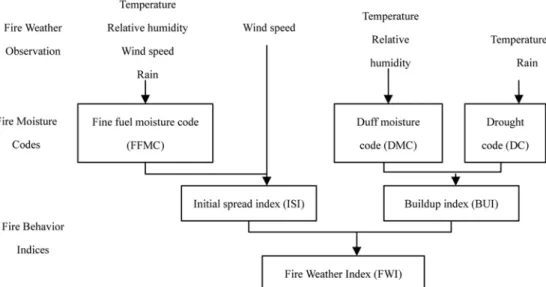
National integrated daily weather index (DWI) model to calculate the forest fire danger rating by Spring and Fall (T mean : average temperature, Eh : effective humidity, Rh
Daily mean of air pressure, air temperature, dew-point temperature, wind direction and speed, relative humidity and cloud amount is the average of hourly
Daily mean of air pressure, air temperature, dew-point temperature, wind direction and speed, relative humidity and cloud amount is the average of hourly
Daily mean of air pressure, air temperature, dew-point temperature, wind direction and speed, relative humidity and cloud amount is the average of hourly
Daily mean of air pressure, air temperature, dew-point temperature, wind direction and speed, relative humidity and cloud amount is the average of hourly
Daily mean of air pressure, air temperature, dew-point temperature, wind direction and speed, relative humidity and cloud amount is the average of hourly
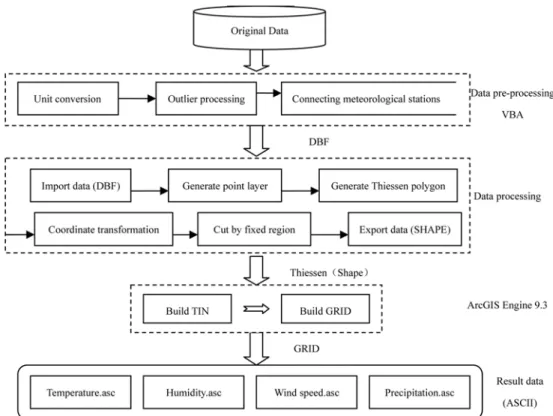
As a first step, we obtained the data of the meteorological factors (i.e., precipitation, humidity, temperature, insolation, snowdrifts, wind velocity) and the output of
