한국농림기상학회지, 제14권 제4호(2012) (ISSN 1229-5671)
Korean Journal of Agricultural and Forest Meteorology, Vol. 14, No. 4, (2012), pp. 265~268 DOI: 10.5532/KJAFM.2012.14.4.265
ⓒ Author(s) 2012. CC Attribution 3.0 License.
알레르기 꽃가루 위험도 예보모델의 개발과 검증
김규랑1
*
·박기준2·이혜림1·김미진1·최영진1·오재원31국립기상연구소응용기상연구과
,
2국립기상연구소정책연구과,
3한양대학교의과대학(2012
년11
월29
일접수; 2012
년12
월7
일수정; 2012
년12
월7
일수락)
Development and Evaluation of the Forecast Models for Daily Pollen Allergy
Kyu Rang Kim
1* , Ki-Jun Park2, Hye-Rim Lee
1, Mijin Kim
1, Young-Jean Choi
1 and Jae-Won Oh
3
1Applied Meteorology Research Laboratory, National Institute of Meteorological Research, Seoul, Korea
2Policy Research Laboratory, National Institute of Meteorological Research, Seoul, Korea
3College of Medicine, Hanyang University, Seoul, Korea
(Received November 29, 2012; Revised December 7, 2012; Accepted December 7, 2012) ABSTRACT
There are increasing number of allergic patients due to the increasing outdoor activities and allergenic pollens by local climate changes. Korea Meteorological Administration provides daily forecasts for pollen allergy warnings on the Internet. The forecast models are composed of pollen concentration models and risk grade levels. The accuracy of the models was determined in terms of risk grade.
Pollen concentration models were developed using the observed data during from 2001 to 2006 and accuracy was validated against the data during from 2010 to 2011. The accuracy was different from location to location. The accuracy for most tree species was higher in April than that in May. The accuracy for weed species was higher in October than in September. Our result suggest that the models presented in this study can be used to estimate daily number and risk grade of pollens.
Key words
: Pollen concentration, Meteorological conditions, Forecast model, Risk grade
I. 서 론
최근 주
5
일 근무제에따른 여가시간 증대와삶의질향상을위한가치관변화등으로여가활동을야외 에서즐기는인구가늘어나고있다
.
이에따라과거에비해꽃가루알레르기환자도점차 늘고있는추세이 다
(Kim
et al., 2012).
꽃가루는알레르기성비염,
기 관지천식,
알레르기성결막염등각종질병의원인이 되며,
최근에는아토피피부염을악화,
자극시키는경 우도있다고보고되고있다.
해외에서는이미 꽃가루예보시스템들이개발되어
상용 및 공용으로운영되고 있다
.
예를 들어,
미국에서는알레르기를일으키는꽃가루에대한예측시스템
을개발하여인터넷포털
(www.pollen.com)
을통해서비스하고 있다
.
영국 기상청에서는 기상예보와 함께 꽃가루대기농도의공간적인분포를예측하여이러한 정보를실시간으로제공하고있다(http://www.metoffice.
gov.uk).
기상청국립기상연구소에서는관찰되는주요꽃가루와이들의알레르기유발성을고려하여국내실 정에 맞는 꽃가루 알레르기 위험도 지표를제공하는 예보모델을개발하였다
.
현재기상청홈페이지를통하 여이모델을이용한꽃가루농도위험지수가제공되단 보
* Corresponding Author : Kyu Rang Kim
([email protected])
266 Korean Journal of Agricultural and Forest Meteorology, Vol. 14, No. 4
고있다
.
본연구에서는이모델의예측정확도를 분 석하여예보시스템의신뢰도를판정하였다.
II. 분석자료와 연구방법
현재꽃가루관측지점은전국
12
개지점(
서울,
부산,
대구
,
대전,
광주,
강릉,
제주,
청주,
구리,
전주,
춘천,
울산
)
에분포하고있다.
관측지점은1997
년부터설치되어점차 확대되었으며
, Burkard seven-day recording volumetric spore trap (Burkard Manufacturing Co.
Ltd., England)
을이용하여7
일간격으로꽃가루를수집한후광학현미경을이용하여판독하고일별로계수
하였다
.
조사한종은 수목류는22
종,
잡초류는9
종이 다.
우리나라에서는1
월과12
월을제외하고연중꽃가루가관측되고있으며수목류는
3-5
월,
잡초류는8-10
월의 기간에 집중적으로관측된다
(Park
et al., 2008;
Table 1.
The revised criteria for the risk grade levels of pollen allergy in Korea
Risk Grade Trees Pine Weeds
Mild 0-19 0-499 0-19
Moderate 20-49 500-999 20-49
Severe 50-99 1000-1499 50-199
Dangerous
≥100
≥1500
≥200
Table 2.
Concentration models for daily pollens of trees, pine, and weeds based on daily observed number of pollens and weather variables during 2001-2006
Site Month Species Daily Concentration Model (2001-2006)
Seoul
April Trees 0.494386+0.002296
×AccumT
−0.009812
×PRE-0.012852
×AS+0.047051
×MeanT May Trees 3.734477
−0.039974
×PH
−0.032431
×AS+0.074371
×WIND
−0.000864
×AccumT
+0.022925
×PRE
−0.037523
×MaxT
Sep. Weeds
−8.12693+0.00217
×AccumT+0.07439
×MeanT
Oct. Weeds 3.105090
−0.000521
×AccumT-0.011980
×AS+0.036886
×DR+0.025268
×PRE Busan
April Trees 1.177035+0.005638
×PRE+0.000773
×AccumT
−0.043159
×MeanT+0.038745
×WIND May Trees 0.730695
−0.009694
×AS+0.090319
×MinT
−0.000614
×AccumT
Sep. Weeds
−5.0407+0.07337
×MaxT+0.00082
×AccumT+0.0149
×RH+0.00833
×AS-0.05477
×DR Oct. Weeds
−2.2394+0.01747
×RH
−0.06437
×PH+0.02506
×PRE+0.00046
×AccumT
Daegu
April Trees 2.147351
−0.018781
×AS
−0.016099
×PH+0.02648
×MeanT
May Trees 3.289447
−0.167443
×WIND
−0.011323
×AS
−0.009843
×RH
−0.038546
×DR+0.018934
×
PRE
−0.035456
×PH
Sep. Weeds 5.18806
−0.000678
×AccumT
−0.16221
×WIND+0.004365
×AS
−0.032062
×DR+0.003404
×
PRE
−0.009058
×RH
Oct. Weeds
−0.02537+0.032392
×MinT+0.037667
×PRE
−0.049606
×PH+0.007524
×RH
Gwangju
April Trees 1.051444+0.000449
×AccumT+0.052516
×MeanT
−0.033223
×PH
−0.011967
×AS+0.140643
×
WIND
−0.005644
×RH
May Trees 2.495318
−0.011665
×AS
−0.049456
×MinT
−0.000343
×AccumT
Sep. Weeds
−2.49052+0.0745
×MaxT+0.00073
×AccumT
−0.01528
×AS
−0.01039
×RH+0.04806
×WIND Oct. Weeds 9.581082
−0.047606
×MaxT
−0.64892
×WIND
−0.045595
×RH+0.199869
×MeanT+0.184928
×
PRE
−0.25355
×PH
−0.001522
×AccumT Gangneung
April Trees 0.848285+0.001677
×AccumT
−0.085431
×WIND
−0.006496
×AS+0.017049
×MinT May Trees 1.41944
−0.009657
×PRE+0.000425
×AccumT
−0.050007
×WIND
−0.00419
×AS Sep. Weeds
−1.0367+0.00062
×AccumT
Oct. Weeds 1.295626
−0.009824
×AS
−0.010613
×PH
Jeju May Trees 2.205682
−0.01926
×AS+0.036406
×DR
−0.000534
×AccumT
Sep. Weeds 1.415962+0.012723
×AS
−0.003129
×PRE+0.009016
×RH
−0.031926
×DR
−0.000288
×AccumT Oct. Weeds
−1.07383+0.09155
×MeanT
MeanT: daily mean temperature, MinT: daily minimum temperature, MaxT: daily maximum temperature, RH: daily
mean relative humidity, WIND: daily mean wind speed, PH: precipitation hours, PRE: daily total precipitation,
AS: daily accumulated sunshine hours during the last seven days, DR: daily temperature range.
Kyu Rang Kim
et al.: Development and Evaluation of the Forecast Models for Daily Pollen Allergy 267 Oh
et al., 2012).
관측된일별꽃가루자료와기상자료를이용하여일 별 꽃가루 농도를 추정하는 농도모델을 개발하였다
.
농도모델은회귀모델을바탕으로기상요소에따른꽃 가루 농도를예측하는데
,
농도모델 개발에사용된꽃 가루 자료는2001-2006
년의 봄철(4-5
월)
과 가을철(9- 10
월)
의6
개지역(
서울,
부산,
대구,
광주,
강릉,
제주)
관측 자료였다
.
분석에 사용된 기상요소는평균기온,
적산온도
,
최고기온,
최저기온,
일교차,
강수량,
습도,
풍속
,
강수지속시간, 7
일누적일조시간이었다.
한편꽃가루알레르기환자의알레르기반응과일별 꽃가루 수를 이용하여 꽃가루 농도에따른 알레르기 위험도를
4
단계(
미약,
조심,
위험,
매우 위험)
로구분하여 한국형 꽃가루 알레르기 위험도를 개발하였다
(National Institute of Meteorological Research, 2008).
알레르기꽃가루위험도예보모델은일별꽃가루수 를예측하는농도모델과알레르기위험도로구성되어 있다
.
일별 꽃가루수(
C)
를 예측하기위해 각기상변 수와해당계수간의선형결합인다중회귀분석을이용하 였으며식은다음과같다.
C = W
×A' (1)
여기에서
C
는일별 꽃가루수를상용로그변환 한값 이며, W
는 평균기온,
적산온도,
최고기온,
최저기온,
일교차
,
강수량,
습도,
풍속,
강수지속시간, 7
일일조시 간으로구성된기상변수값의벡터이고, A=[a
1, a
2, ..., a
10]
는 해당 기상변수별 계수를 가진 벡터이다(Table
2). a
값들을추정하기위하여2001-2006
년자료를이용하였으며 유의수준은
0.15
수준으로 단계별 선택(stepwise method)
방법을사용하였다.
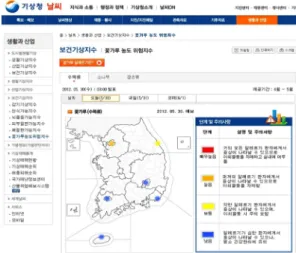
농도모델에의해 계산된일별 꽃가루 수를 꽃가루 알레르기위험도에적용하여예측한일별꽃가루알레 르기 농도 위험지수가 기상청 홈페이지
(http://www.
kma.go.kr)
를통해 제공된다(Fig. 1).
기상청에서제공하고있는일별꽃가루알레르기위험도에대한예측
력검증은
2010-2011
년간관측된꽃가루수에따른일별위험도와농도모델에따른위험도의정확도를이용 하여평가하였다
.
III. 결과 및 고찰
6
개지역의2010-2011
년도일별위험도예측결과에대한 모델의정확도를 검증한결과
, 4
월수목류정확도는 부산
,
광주,
대구31~43%,
서울,
강릉63~65%
였다
. 5
월수목류정확도는서울,
대구,
강릉22~38%,
부산
,
광주,
제주58~67%
였다. 9
월 잡초류 정확도는33~60%, 10
월잡초류정확도는77~100%
였다(Table 3).
알레르기를일으키는일별꽃가루농도는기상에따 라크게변화하기때문에일기예보와함께예측이가 능하였다
.
일반적으로꽃가루농도가높을수록알레르기증상은심해지나그종류에따라증상의심각도는 다르게나타날수있다
.
따라서기상청에서는 꽃가루농도에따른국민의건강에대한영향을일별 꽃가루 Fig. 1.
Web service for daily forecasting of allergenic pollens by Korea Meteorological Administration.
Table 3.
The accuracy of the daily pollen concentration models in terms of the risk grade levels during 2010-2011 for trees, pine, and weeds
Month Species Site / Accuracy (unit: %)
Seoul Busan Daegu Gwangju Gangneung Jeju
April trees 65.00 31.67 31.67 43.33 63.33 .
May trees 38.71 66.13 22.58 67.74 22.58 58.06
Sep. weeds 33.33 55.00 35.00 45.00 60.00 56.67
Oct. weeds 90.32 77.42 98.39 77.42 100.0 83.87
268 Korean Journal of Agricultural and Forest Meteorology, Vol. 14, No. 4
농도 위험지수로 제공하고 있으며, 본 연구를 통하여 제공되는 위험지수의 정확도를 밝혔다.
일별 꽃가루 수의 지역적 분포는 생명기상 또는 보 건기상 분야에서 호흡기 알레르기나 천식의 발병 원인 으로 고려될 수 있으나 장기간 동안의 안정적 관측이 필요하기 때문에 여러 지역을 대상으로 연구되지는 못 하였다. 또한 꽃가루 관측 자료 자체에 내재되어 있는 불확실성으로 인하여 자료의 활용이 제한되어 온 것도 사실이다. 본 연구의 꽃가루 위험도 예보 모델을 이용 함으로써 꽃가루 관측자료의 불균질성을 어느 정도 상 쇄할 수 있을 것이다.
또한 지점별 기상자료를 통해 꽃가루의 농도를 예측 할 경우 풍향과 풍속과 같은 기상변화에 따른 꽃가루 확산을 고려하지 못하는 단점이 있다. 이를 위해, 대 기 확산 모형을 활용한 꽃가루 예측 시스템 개발이 필요할 것이다. 앞으로 본 연구 결과를 활용하여 꽃가 루 농도 또는 위험지수에 따른 국민의 건강 영향이 좀 더 심층적으로 연구되기를 기대한다.
적 요
실외활동의 증가와 기후변화에 의한 알레르기 유발 꽃가루의 증가로 알레르기 질환 환자가 급증하고 있다.
현재 기상청에서는 홈페이지를 통하여 일별 꽃가루 농 도 위험지수를 예보하고 있다. 예보모델은 농도 추정 모델과 알레르기 위험도로 구성되어 있으며, 예보모델 의 위험도 예측 정확도를 검증하였다. 꽃가루 농도모 델은 2001~2006년 자료를 이용하여 개발하였고, 정확 도는 2010~2011년 자료로 검증하였다. 수목류 정확도 는 지역별로 다르게 나타났으나 5월보다 4월에 높게
나타났다. 잡초류는 9월보다 10월에 더 높게 나타났다.
본 연구 결과를 통해 기상자료를 이용한 일별 꽃가루 수와 위험도를 추정할 수 있으며, 이를 이용하여 생명 기상 또는 보건기상 분야의 심층 연구가 수행될 수 있을 것이다.
감사의 글
본 연구는 기상청 국립기상연구소의 “생명산업기상 기술개발연구” 지원으로 수행되었습니다.