1. Introduction
A water source heat pump system with sea water, river water, sewage, wide area water, or ground water is much more simple and efficient than an air source heat pump system. The use of the water source heat pump system that consume less power than air source heat pump system is gradually increasing in the new climate change regime.
The system optimization technologies of an air source heat pump system using the variable speed compressor controls have been studied extensively
(2).
However, in case of the water source heat pump systems, many studies have not been conducted because of few installation cases.
Recently, due to the geothermal expansion policy of the government, researches on geothermal systems have been actively under way
(3,4).
In general, the efficiency of a heat pump system is determined by the amount of power in compression, condensation, and evaporation process
(5,6). In the case of the air heat pump system, researches for improving the system efficiency controlling the variables in proportion to the heat load have been studied extensively
(7).
The main purpose of this study is to derive the optimal operating conditions and find the variables for the water source heat pump system.
For this study, we have selected the water heat pump system of K-water S water treatment plant as a pilot
* K-water 물산업플랫폼센터(K-water Water Industry Platform Center)
** 충남대학교 기계공학부(School of Mechanical Engr., Chungnam National University)
† Corresponding Author, E-mail : [email protected]
◎ Original Paper ISSN (Print): 2287-9706
물 히트 펌프 시스템의 성능 연구
차상훈
*
ㆍ고성호**†
1)A Study on The Performance of A Water Heat Pump System
Sanghoon Cha * , Sungho Ko **†
Key Words : Heat pump( 히트펌프 ), Optimization( 최적화 ), Water Heat Pump System( 물 히트펌프 시스템 ), Heat pump performance curve( 히트펌프 성능곡선 ), Heat exchange rate( 열교환율 )
ABSTRACT
The main purpose of this study is to derive the optimal operating conditions and determine control variables for a water
source heat pump system. In this study, a water heat pump system from the K-water S water treatment plant was used as the
pilot system. An inverter system was applied to the raw water, brine water, and circulation water pump to conduct an optimal
operating condition analysis. In addition, a real-time monitoring and control system was implemented to calculate the system
efficiency. The real-time monitoring system stores the flow, temperature, pressure, power, and pump operation data every 10
minutes. A simulation model was developed to analyze the system COP under various operating conditions and the model was
calibrated using a pump performance test. The variation of the system efficiency was simulated by varying the flow rate of
the pumps with respect to the raw water temperature. The simulation analysis and operation data were compared and the
effectiveness of introducing a variable speed water heat pump system was verified. Finally, the control variables related to the
systems efficiency were derived.
system. An inverter system of the raw water, brine water and circulation water pump, and realtime monitoring and control system have been implemented for an optimal operating condition analysis. The realtime monitoring system stores flow rate, temperature, pressure, power, and pump operation data every 10 minutes. A simulation model has been developed to analyze the system COP under various operating condition and the model has been calibrated by a pump performance test. The variation of the system COP was simulated by changing the flow rate of the pumps under the condition of the raw water temperature. We compared the simulation analysis and operation data and have verified the effectiveness of the variable speed system.
Finally, the correlation between heat exchanger temperature differences and system COP has been analyzed. With the correlation results, control variables related to the system COP have been derived.
2. Method 2.1. Pilot System
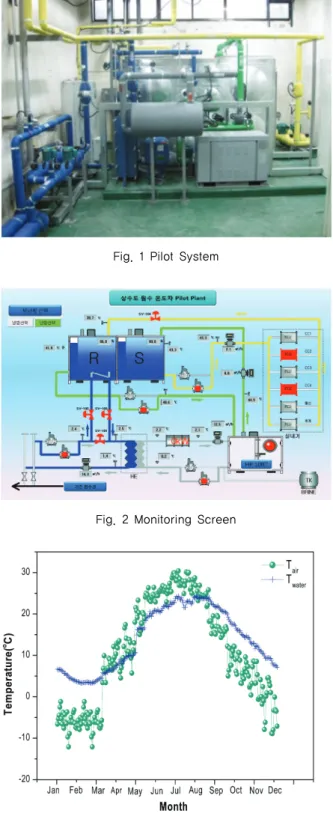
The pilot system on site is as shown in Fig. 1. The pilot water source heat pump system was built for an office heating and cooling in the S water treatment plant.
This system uses raw water from the Han River as a heat source. The system has been in operation since 2010. Raw water pump, brine pump, heat exchanger, heat pump, circulating water pump, heat storage tank, FCU, etc. are the main components of the system. For this study, an inverter system was applied to all pumps. A realtime monitoring and control system was implemented to measure the system efficiency.
The real-time monitoring system stores the flow rate, temperature, pressure, power, and pump operation data every 10 minutes. A heat pump is a 10 RT capacity water heat pump, a heat exchanger is 40,000 kcal/h, a heat storage tank is 10 ㎥, a raw water and a brine water pump is 0.75 kW, 15 ㎥/h. , 15 ㎥/h. Fig. 2 is the control and monitoring screen of the system.
The all year round temperature of the water in the pilot system is 3℃ to 25℃ such as in Fig. 3. The water temperature is lower than the atmospheric temperature
effective than air in a heat exchange.
2.2. Simulation Model
A simulation model has been developed for analysis
Fig. 1 Pilot SystemFig. 2 Monitoring Screen
Fig. 3 Comparison of the air and water annual temperature
is normally used for simulation of heating and cooling system. WP is a raw water pump, BP is a brine pump, CP is a circulating water pump, Type 927 is a heat pump, Type 38 is a heat storage tank, and the other components are the computational elements necessary for simulation.
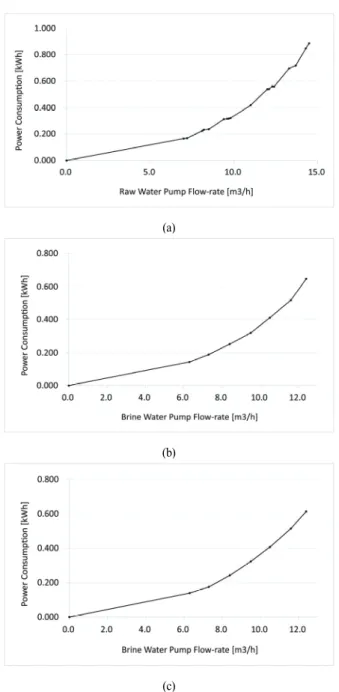
To improve the reliability of the model, the performance test of the pumps has been conducted and the results were used to verify the simulation model.
Fig. 5. (1) to (3) are the flow-energy curves of the pumps from the results of field test.
Fig. 6 is a comparison of pilot data and simulation results under the same conditions. As shown in Fig.
6 there is no significant difference between operational and simulation data. Therefore, the simulation model can be considered to be reliable.
2.3. Simulation condition
Table 1. is the input condition for the simulation model. The heating and cooling capacity and power of the heat pump have been referred to manufacturer's data.
Fig. 6 Comparison of operation and simulation results Fig. 4 Simulation Model
(a)
(b)
(c)
Fig. 5 (a) Raw water pump Q-P, (b) Brine water pump Q-P, (c) Circulation water pump Q-P
Contents Values
Internal setting temperature of cooling condition 18 ℃ Internal setting temperature of heating condition 27 ℃ Heat storage tank temperature of cooling condition 12~17 ℃ Heat storage tank temperature of heating condition 38~43 ℃ Heat storage tank volume 10 m3 Heat pump cooling capacity 128 MJ/h Heat pump heating capacity 132 MJ/h
Table 1 Simulation conditions
3. Results and Discussion
3.1. Simulation results of cooling condition
Fig. 7 is the results of simulation under cooling condition with the raw water temperature of 22°C changing the flow rate of raw water and brine water pump. The system COP was discovered to be the highest at the raw water pump flow rate of 6~8 ㎥/h.
In addition, the relationship between the heat exchange rate and system COP also has been analyzed.
It can now be confirmed that the systems efficiency drops sharply below 2°C of raw water temperature.
Fig. 8 shows the relationship between the system COP and heat exchange of raw water. This analysis
results show that the optimal control can be achieved by controlling the flow rate of raw water and brine water pump. System COP can be optimized by controlling the variable speed of pumps. In other words, it means that the temperature difference of the heat exchanger can be a good control variable for optimal operation.
3.2. Simulation results of heating condition
Fig. 9 is the results from simulated analysis under the heating condition based on the raw water temperature of 4°C changing the flow rate of raw water and brine water pump. The system COP was discovered to be the
(a)
(b)
Fig. 7 Flow rate and system COP curves of (a) Raw water pump (b) Brine water pump
(a)
(b)
Fig. 9 Flow rate and system COP curves of (a) Raw water pump, (b) Brine water pump
highest at the raw water pump flow rate of 8~9 ㎥/h and the brine pump flow rate of 9~10 ㎥/h.
In addition, the relationship between heat exchange rate and the system COP was analyzed. It can be confirmed that the system COP drops sharply below 4°C.
Fig. 10 shows the relationship between the system COP and heat exchange of raw water. This analysis data shows that the optimal control can be achieved by controlling the flow rate of raw water and brine water pump. The system COP can be optimized by controlling the variable speed pump. In other words, it means that the raw water temperature difference of a heat exchanger can be a good control variable for optimal operation.
3.3. Comparison of operation and simulation results
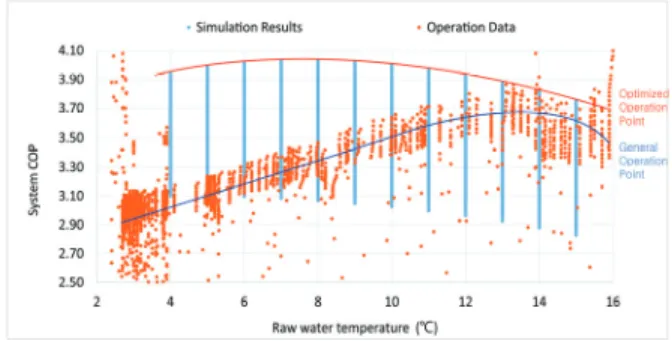
Fig. 11 shows the comparison between the operational data and simulation results under a cooling condition.
Fig. 12 shows the comparison of operational data and simulation results under heating conditions. The result of this analysis reveals that the optimal operation using a variable speed pump can be approximately 20% more efficient than the current operating results.
As shown in Fig. 12, it can be seen that the difference between optimal efficiency and operation efficiency sharply increases when the raw water temperature goes down in winter. From the results, the system COP can be improved by maximizing the amount of heat exchange by operating the raw water and brine water pump at a lower flow rate in winter. In other words, it is necessary to adapt the variable speed pump control system in order to improve the system COP, and it can also be seen that the system COP can be improved considerably by controlling the temperature difference of the heat exchanger as the control variable.
4. Conclusions
In this study, the effects of raw water pump, brine water pump flow rate and raw water, brine water heat exchange on system COP were investigated for a pilot system. Based on the simulation and pilot system results, the following results were obtained.
(1) There is a particular raw water and brine water pump flow rate that maximizes system COP for both cooling and heating conditions.
(2) There is a particular raw water and brine water heat exchange rate that maximizes system COP.
(3) If the amount of heat exchange rate between the raw water and the brine water is reduced to a certain amount or less. The system COP sharply decreases.
(4) The system COP varies by approximately 20%
depending on the raw water pump and brine water pump flow rate at the same raw water temperature.
Acknowledgment
This work was supported by research fund of Chungnam National University
References
(1) Y. Cho, D. G. Kim, J. S. Seo, J. P. Moon, and H. S.
Kim, 2011, Development of Riverbank Filtration Water Supply and Return System fro Sustainable Green House Heating and Cooling, New Zealand Geothermal Workshop.
Fig. 12 Raw water temperature and system COP of heating Fig. 11 Raw water temperature and system COP of cooling