연료전지 차량의 전기 안전성 규제안 작성 방법론
김일구*
†, 첸 시**, 박재홍*
*서울대학교 대학원, **SK C&C
Rulemaking Process of Electrical Safety Regulation for Fuel Cell Vehicles
EALGOO KIM*
†, CHEN XI**, JAEHONG PARK*
*Graduate School of Seoul National Univ., Korea
**SK C&C, Korea
ABSTRACT
본 논문에서는 전기자동차의 고전압 시스템의 안전성을 확보하기 위한 법규 규제안 생성 방법 론을 제시하였다. 법규가 기술적으로 모든 영역을 빠뜨리지 않고 정의하고 있는지를 파악하기 위한 방법으로 법규분포분석법(Regulation Distribution Analysis Method)과 법규완전도분석법(Regulation Completeness Analysis Method)을 제시하였다.
자동차 설계와 생산에 있어서 법규/규제는 중요한 이슈가 되고 있다. 원칙적으로 법규는 자동 차 승객과 환경을 보호하는 목적으로 생성되고, 이윤 추구 중심의 시장에서 놓칠 수 있는 기술적 항 목들을 규제할 수 있도록 한다. 매연 배출 정도, 매연 모니터링 시스템, 전기 안전성과 같은 항목이 그 예이며, 향후 연료전기자동차 양산을 앞두고는 고전압 안전성과 관련된 규제 또한 필요하게 될 것으로 파악된다. 그러나 규제 항목에서 미정의된 부분이 있는지를 확인하는 체계적인 방법이 없어 본 논문에서는 기술적인 파라미터를 중심으로 규제항목을 검토하는 방법론을 제시하였다.
KEY WORDS : Electrical safety(전기 안전성), Fuel cell vehicles(연료 전지차), FMVSS 305, Safety regu- lation(안전 법규), Regulation distribution analysis method(법규분포분석법), Regulation completeness analysis method(법규완전도분석법)
†
Corresponding author : [email protected] 1. Introduction
Compliance to regulations becomes an important issue while designing and manufacturing vehicles.
Vehicle related regulations are generated in order to assure the safety of passengers and pedestrians,
and to keep environment from pollutions, which could not be guaranteed in cost driven market.
Most of the electronic system characteristics in vehicles are affected by regulations such as emis- sion of the engines, accuracy of the monitoring systems, brightness and angle of the lightings.
In this paper, we are proposing Regulation Dis-
regulation item pool regulation
item pool
new regulation
items new regulation
items
new regulation
items new regulation
items Regulation
Coverage Analysis Method
Regulation Completeness
Analysis Method
update &
merge
update &
merge check
compensate
compensate brainstorm
regulation items
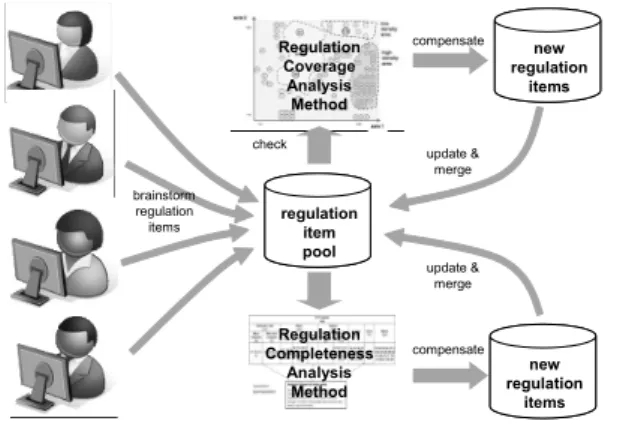
Fig. 1 Proposed rule making concept
Distribution Graph Importance Importance
1
Human 2
3
4
5
6 7
8 9
10
11 12 13
14 15 16
17 18
19 20
21 22
2324 25
26 27
28 29
30
31 32
33 34
35 36 39 38 37 40
424344 44 45 46
474849 50 5152
53 54
555657 5859
606162 63 64 65
66 67 68 69 70 71 72
73 74
75 76
77
78 79 80
81 82
83
84 85
86
low high axis 2
axis 1
low high
high density area low density area
empty area
regulation item pool regulation
item pool
new regulation
items new regulation
items
99 113
98 98
Fig. 2 Concept of regulation distribution analysis method
tribution Analysis Method (RDAM) and Regulation Completeness Analysis Method (RCAM) for check- ing and revising regulation items during rule- making process.
In RDAM, we proposed how to check the coverage area of regulation items and whether they cover the whole area that needs to be con- sidered. In RCAM, we proposed how to check the completeness of a regulation item using set concept.
We introduced these two methodologies with examples to ensure their applicability to existing regulations for electrical vehicle safety such as FMVSS 305
1), R101
2), A1003).
Researches on hydrogen related safety regulation were conducted for hydrogen generation facility
4)or hydrogen station
5). While their work focused on analyzing and proposing a criteria for a specific safety situation, our work focuses on checking regulation items whether they covers all possible safety related situations.
Figure 1 shows proposing rule making concept.
Draft regulation items are brainstormed by multiple individuals and collected in a regulation item pool.
Then, the items are reviewed and analyzed by Regulation Distribution Analysis Method (RDAM) and Regulation Completeness Analysis Method
(RCAM). Missing areas and conditions are found during these process and new regulation items derived that can compensate the missing area and conditions. Derived new regulation items are added to the regulation item pool.
This research was conducted while we were generating safety rules for high-voltage system in Fuel Cell Vehicles. We found the necessity to find methodologies to brainstorm, check, and revise regulation items that covers all possible safety situations.
Proposed methods can be applied to other rule making process and will be highly effective if the system in interest can be characterized and de- composed logically and quantitatively.
2. Regulation Distribution Analysis Method (Rdam)
The basic idea of RDAM is to distribute every regulation item into a distribution graph and search areas where regulation items are not filled.
Figure 2 shows the concept of RDAM. Items in
the regulation item pool are distributed into distri-
bution graph. The distribution graph is composed
of two axes which are selected during the analysis
process. The density of the distributions is analyzed
and empty or low density areas are marked. If
the marked areas do not have proper reasons,
Step 1
Step 2
Step 3
Step 4
Step 5
Step 6
Start
Brainstorm / Generate Axis Pool
Draw empty Distribution Graphs
Categorize items with axes
Analyze Distribution Graphs
Is the emptiness/weakness
reasonable?
Compensate weak area
End
Yes
No
Fill in Distribution Graphs
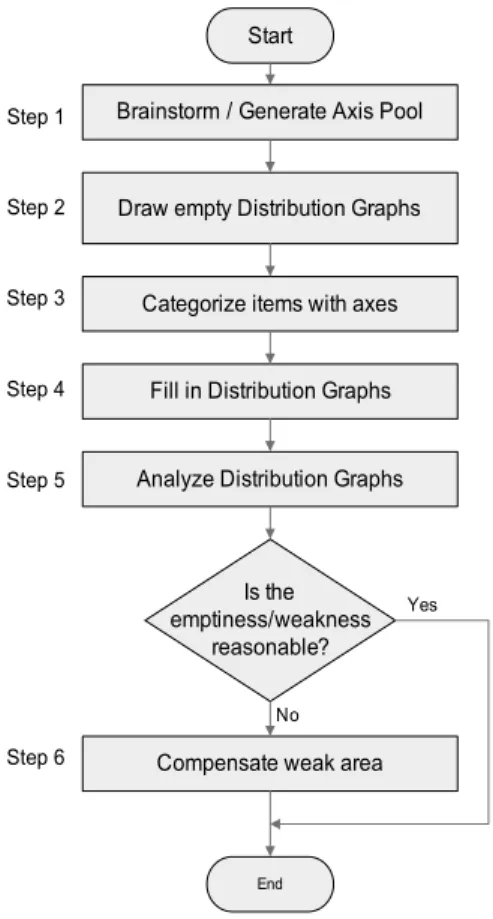
Fig. 3 Procedure for regulation distribution analysis method
Importance
Manufacturer Related
User Related Importance
2
1
Fig. 4 Process of filling regulation items into distribution graph
additional regulation item are generated in those areas and filled into the regulation item pool.
The procedure for RDAM is described in Fig 3. First step is to brainstorm and generate the axes for analysis. Example of axes can be speed
of vehicle, electric current, relevance to driver, and development stages.
Second step is to draw empty distribution graphs. An empty distribution graph can be drawn by choosing two axes generated in the first step and drawing a two dimensional plane.
Third step is to categorize regulation items for each axis for the distribution graph. If we have chosen vehicle speed as the axis, we can categorize the regulation items according to the speed of the vehicle.
Fourth step is to fill the Distribution Graphs with categorized regulation items. By this step we can visualize the distribution of regulation items.
Fifth step is to analyze distribution graph and find weak areas. Some areas in the distribution graph might be empty and we can find the reason for the empty area. If an empty area has proper reason, we can ignore that area. Otherwise that empty area needs to be filled up with additional regulation items.
Sixth step is to compensate the weak area found in fifth step. The empty or low density area can be filled up with additional regulation items de- ducted from existing regulation items.
Explanation for each step is given in detail with examples in the following three sections.
2.1 Generate Axis pool & Categorize Regulation Items
Brainstorming axis is an important to step to ensure full coverage of inspection area. The axes found in the step forms the basis of the following steps. Every characteristic of the system in inter- ested needs to be considered during this process.
After brainstorming all possible axes in the form
of an axis pool, every regulation item can be
assigned a value for each axis. Figure 4 shows
an excel file where the regulation items on the
Importance
Manufacturer
Related User
Related Importance
1 2
3 4
5 6
7
8 9
10 16
17 18
19
20 11
12 13
14 15
21 22
23 24
25 26
27 28
29
30
31 32 33 34
35 36
37 38
39
40
41 42 43 44
45 46
47
4850 49
51 52 53 54
56 5557
58 59
60 61 62
63 64 66 65
67 68
69 70
71 72
73 74
75 76 77
78 79 80
81 82
83
84 85
86
low probability high probability
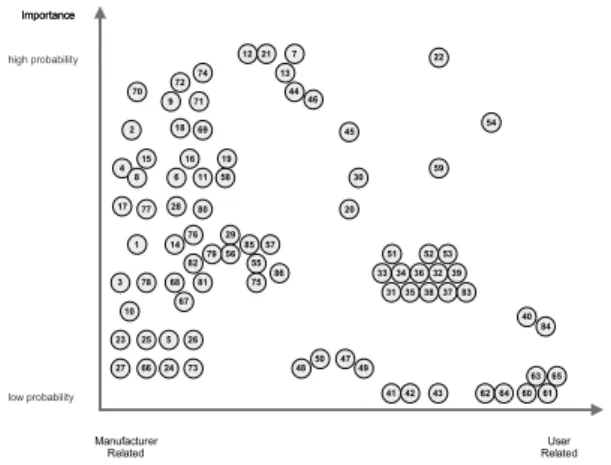
Fig. 5 Distributed regulation items
Importance
Manufacturer Related
User Related Importance
1 2
3 4
5 6
7
8 9
10 16
17 18
19
20 11
12 13
14 15
21 22
23 24
25 26
27 28
29
30
31 32 33 34
35 36
37 38
39
40
41 42 43 44
45 46
47
4850 49
51 52 53
54
55
56 57
58 59
60 61 62
63 64 66 65
67 68
69 70
71 72
73 74
75 76 77
78 79 80
81 82
83
84 85
86
2 1
3 5
4
low probability high probability
Fig. 6 Analyzed distribution graph
row are assigned with values for each axis on the column.
We can generate empty distribution graph combining two axes out of the axis pool. The axes are chosen in a way that every area in the distribution graph can have a significant meaning.
For example, if the axes were chosen to be vehicle load and electric current, then regulation items related to low vehicle load and low electric current, high vehicle load and low electric current, low vehicle load and high electric current, high vehicle load and high vehicle current should have signifi-
cant meaning from which the distribution regu- lation item can be checked.
2.2 Draw Distribution Graph
Figure 4 shows the process of filling regulation items into the distribution graph. The regulation items in the Excel file are already assigned with values for each axis and empty distribution graphs are generated by combining two axes.
Numbers are assigned to every regulation item and assigned numbers are put into distribution graph with positions determined by the value of each axis. For example, as depicted in Figure 4, regulation item “High voltage cores must be separated by at least XX mm from chassis ground”
is assigned with number 1, and has value 5 for Y-axis representing possibility of accidental situation when violated, and value 1 for X-axis representing relativity of manufacturer or user (smaller number represent more relation to manu- facture). This regulation item is put to position (1, 5) in the distribution graph with number 1.
Figure 5 shows the distribution graph filled up with all regulation items.
2.3 Compensate Weak Area
After filling the distribution graph, analysis is performed to derive significant meaning. High density area where many regulation items exist , low density area where small number of regulation items exist, and empty area where no regulation item exists can be identified.
Figure 6 shows an example of the analyzed
distribution graph. We can identify area 2 and
area 3 as empty, area 1 as low density, and area
4 and area 5 as high density. If the reason for the
emptiness of weak area (low density and empty
area) can not be explained, the area needs to be
Importance
Manufacturer
Related User
Related Importance
1 2
3 4
5 6
7
8 9
10 16
17 18
19
20 11
12 13
14 15
21 22
23 24
25 26
27 28
29
30
31 32 33 34
35 36
37 38
39
40
41 42 43 44
45 46
4850 4749 51 52 53
54
56 5557
58 59
6061 62
63 64 66 65
67 68
69 70
71 72
73 74
75 76 77
78 79 80
81 82
83
84 85
86
87 88
89
90 91
92 93 94 95
96
97 98
99 100 99
Fig. 7 Example of generating new regulation items on the distribution graph
Completeness Table
cells with small # items empty
cell regulation
item pool regulation
item pool
new regulation
items new regulation
items cells
with high # items Basic Elements
Category
(lowest sub-category)
101 101 102102
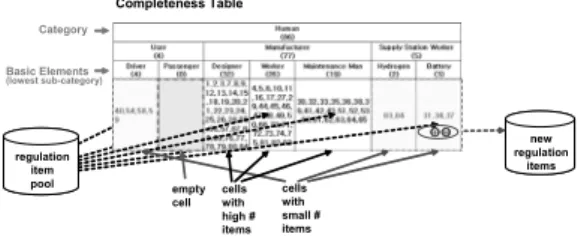
Fig. 8 Concept of regulation completeness analysis method
filled with proper regulation items.
Compensating weak area in the distribution graph can be done by inferring new regulation items from adjacent regulation items. For example, in figure 7, regulation items 95 and 99 are inferred from regulation item 71. Regulation item 71 means
“Battery should be designed to work normally (Voltage maintains at xx V - xx V, Energy xx W - xx W, temperature under xx C) longer than xx hours)” By inferring regulation items which is more related to user, new regulation item can be generated located to the left side the original regulation item.
Examples can be item 95 with “Every battery should be diagnosed before released to market.
Battery should work normally as specified in regu- lation item 71.” This regulation is more related
to user because it is related to the market rather than the manufacturing site for design process.
Another example can be item 99 with “10 Year warranty should be guaranteed by manufacturer to the customer. Any case when the normal work condition of item 71 is not satisfied, battery should be replaced free of charge.” which is more related to user because this regulation is related to warranty or after market.
Applying the approaches and procedures proposed in RDAM can generate more complete regulation whose items are covering all possible situations.
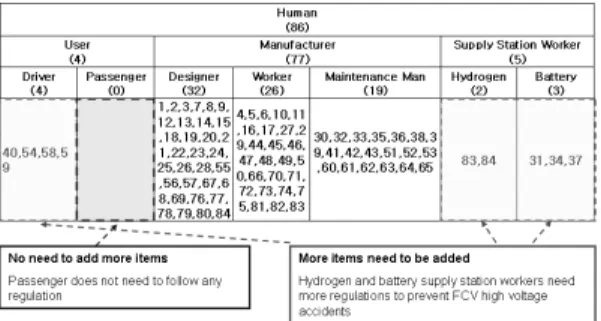
3. Regulation Completeness Analysis Method
Figure 8 shows the concept of RCAM. Each item in the regulation pool is distributed into complete- ness table to verify the completeness of the regu- lation. Completeness table is made for every cate- gory which is related to system in interest. For each category, subsets are divided into tree struc- ture in a way that in each level the subsets become mutually exclusive and complete (exhaus- tive). By grouping regulation items to each subset, we can see which subset is weak or empty and needs to be filled with additional regulations.
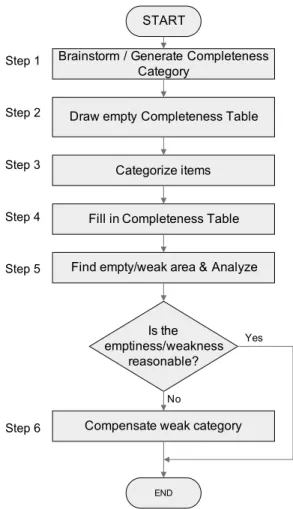
Figure 9 shows proposed procedure for RCAM.
First step is to brainstorm and generate categories which are going to be divided into subsets. The categories can be selected from given set or newly brainstormed from existing regulations.
Second step is to draw empty Completeness Table.
Each category is divided into complete subsets at this step. Third step is to categorize regulation times according to subsets for each category.
Forth step is to fill the completeness table with
regulation items. Fifth step to find empty or weak
subset and analyze whether emptiness or weakness
Step 1
Step 2
Step 3
Step 4
Step 5
Step 6
START
Brainstorm / Generate Completeness Category
Draw empty Completeness Table
Categorize items
Find empty/weak area & Analyze
Is the emptiness/weakness
reasonable?
Compensate weak category
END
Yes
No
Fill in Completeness Table
Fig. 9 Procedure for regulation completeness analysis method
Driver Passenger Designer Worker Maintenance Man Hydrogen Battery
40
1,2,3,7,8,9, 12,13,14,15 ,18,19,20,2 1,22,23,24, 25,26,28
4,5,6,10,11 ,16,17,27,2
9,
30,32,33,35,36,38,3
9,41 31,34,37
Human
User Manufacturer Supply Station Worker